Strongest Levels Global
- 유틸리티
- 버전: 1.24
- 업데이트됨: 6 4월 2020
- 활성화: 8

Description
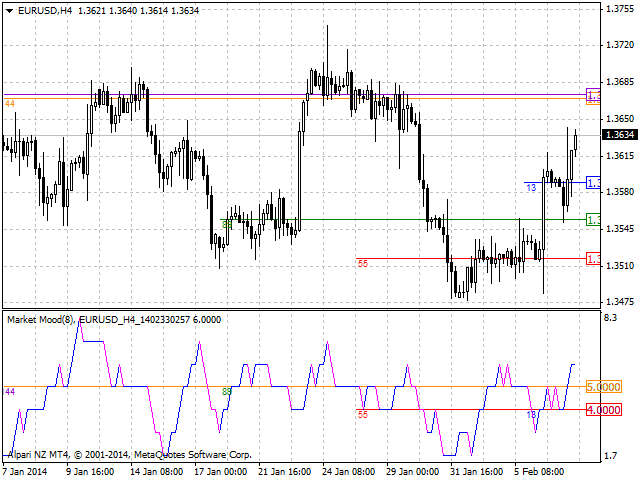
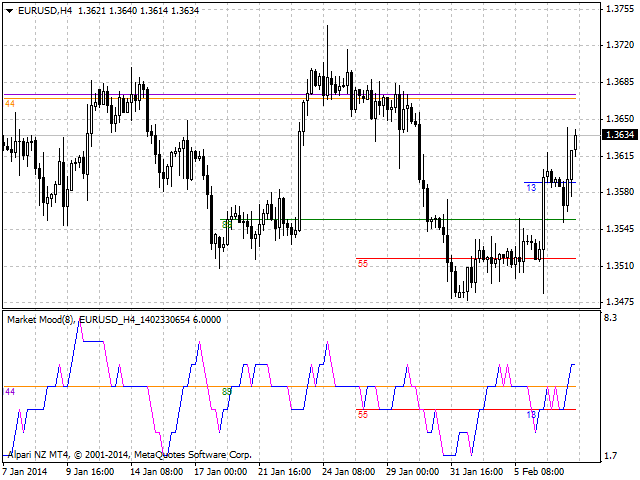
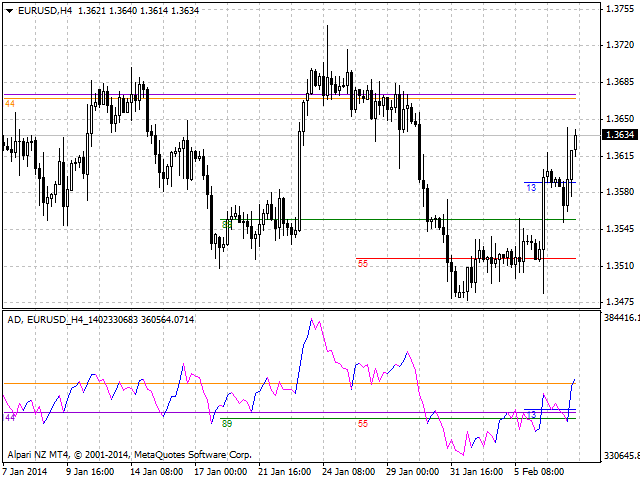
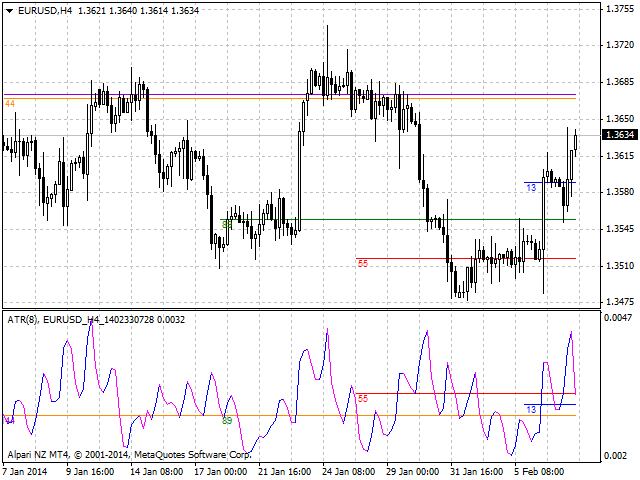
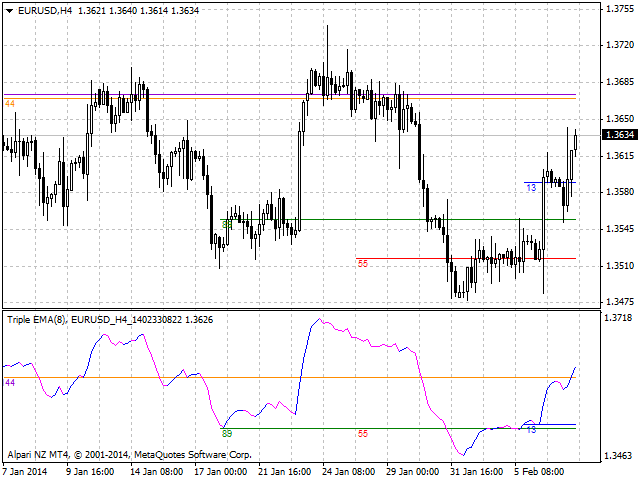
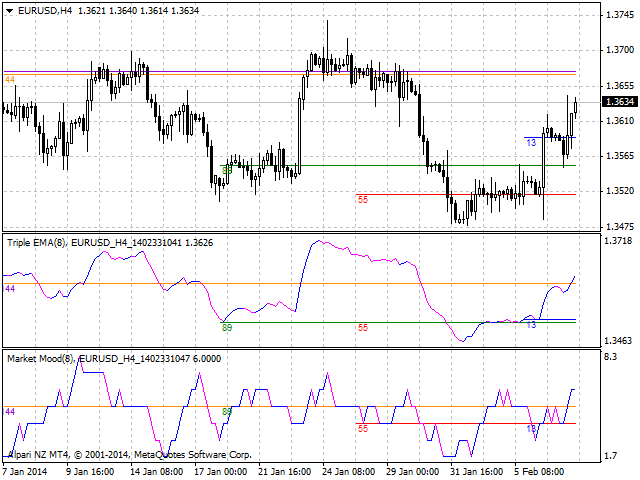
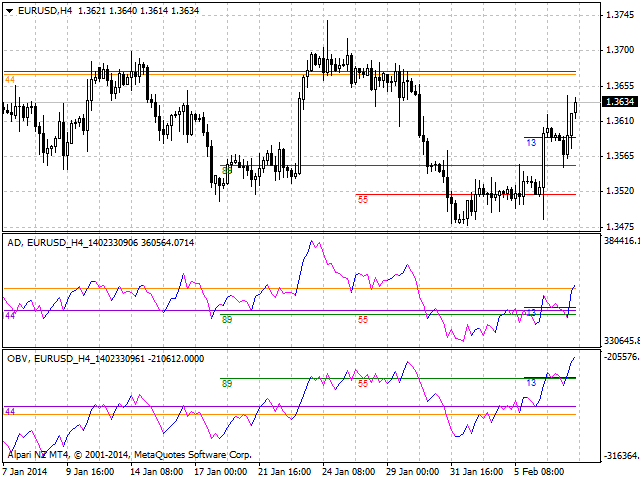
Strongest Levels Global is a colored multicurrency/multisymbols indicator that automatically plots a system of the nearest levels of strongest resistance and support in the separate window on one of nine different indicators of the current timeframe in accordance with user's choice.
The indicator calculates and plots levels based on the number of bars set by the user. It is recommended to set numbers from a golden ratio according to Fibonacci (13, 21, 34, 55, 89, 144, 233, 377, 610 etc.).
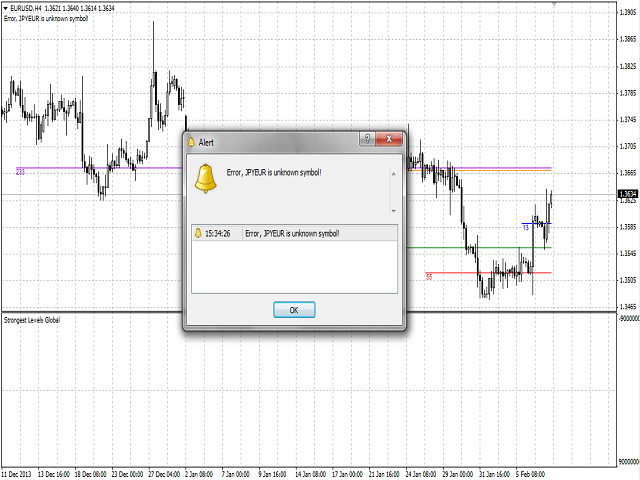
The indicator may be used with any broker, irrespective of the name of the financial instrument since it is necessary to manually enter the name as an input parameter. If you enter a non-existent or incorrect name of a financial instrument, you will receive an error message that this financial instrument is unknown (does not exist).
Users can set the colors of indicator's lines and levels of support and resistance.
At the request of the user, the indicator can show the levels with different ways of display and info (see Input Parameters).
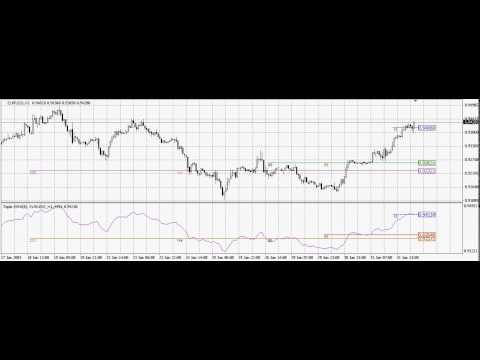
Enclosed video demonstrates operation of the indicator based on the example of levels by number of settlement bars 13, 55, 89, 144 and 233.
Purpose
The indicator can be used for manual or automated trading as part of an Expert Advisor. For automated trading, use the indicator buffer of double type:
- The bullish line of the indicator - buffer 0, must not be equal to 0.
- The bearish line of the indicator - buffer 1, must not be equal to 0.
- The main line of the histogram - buffer 2.
- The value of the first level of support and resistance - buffer 3.
- The value of the second level of support and resistance - buffer 4.
- The value of the third level of support and resistance - buffer 5.
- The value of the fourth level of support and resistance - buffer 6.
- The value of the fifth level of support and resistance - buffer 7.
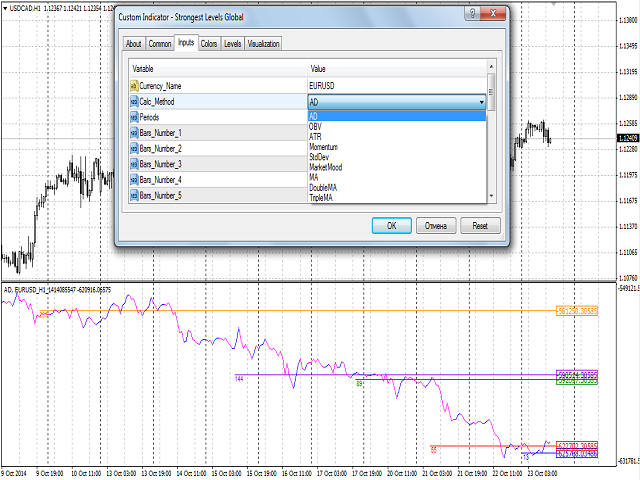
Input Parameters
- Currency_Name - the name of the financial instrument.
- Calc_Method - the index of the indicator:
- 0 - AD (an indicator of accumulation and distribution of volume), by defoult.
- 1 - OBV (On Balance Volume).
- 2 - ATR (Average True Range).
- 3 - Momentim.
- 4 - Standard Deviation.
- 5 - Market Mood (an oscillator the the marlet mood)
- 6 - Moving Average.
- 7 - Double Moving Average.
- 8 - Triple Moving Average.
- Periods - indicator/oscillator calculation period.
- Bars_Number_1 - number of bars for calculation of the first level.
- Bars_Number_2 - number of bars for calculation of the second level.
- Bars_Number_3 - number of bars for calculation of the thrid level.
- Bars_Number_4 - number of bars for calculation of the fourth level.
- Bars_Number_5 - number of bars for calculation of the fifth level.
- Line_Type - type of the line:
- 0 - horizontal line (by default).
- 1 - line long by number of bars.
- Style - style of the line:
- 0 - solid line (by default).
- 1 - dashed line.
- 2 - dotted line.
- 3 - dashed and dotted line.
- 4 - dashed and double dotted line.
- Width - width of the line.
- MA_Method - averaging method for the MA of the calculated indicator/oscillator:
- MODE_SMA - 0.
- MODE_EMA - 1 (by defoult).
- MODE_SMMA - 2.
- MODE_LWMA - 3.
- Applied_Price - the used price of the calculated indicator/oscillator:
- PRICE_CLOSE - 0 (by defoult).
- PRICE_OPEN - 1.
- PRICE_HIGH - 2.
- PRICE_LOW - 3.
- PRICE_MEDIAN - 4.
- PRICE_TYPICAL - 5.
- PRICE_WEIGHTED - 6.
- Shift - the sift o thecalculated indicator/oscillator relative to the price chart.
- Line_Color_1 - color of the first line.
- Line_Color_2 - color of the second line.
- Line_Color_3 - color of the third line.
- Line_Color_4 - color of the fourth line.
- Line_Color_5 - color of the fifth line.
- Symbol_Right_Value - flag for setting Symbol_Right_Price.
- Screen_Info - flag for information about number of bars.
Recommendations
Before using the indicator, please update historical data of financial instruments for all the required time frames.
If number of bars in history of chosen symbol is less than or equal to Periods, the indicator will be inactive. Please update the history!
For testing in the strategy tester it is necessary to set the period of the bars exceeded the maximum number of bars for calculation of support/resistance.
The product can be successfully used with other indicators, such as Strongest Level or Strongest Higher Level or others.