Signal Level Rollback Pro

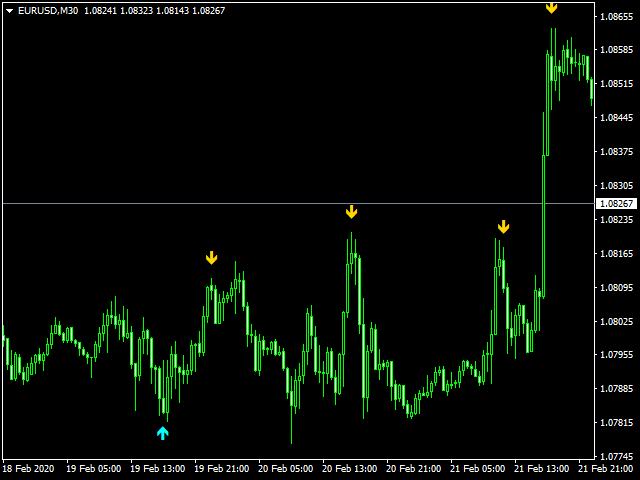
Signal Level Rollback the tool is designed to determine the lows and highs to determine the pivot of the market
recommended for use with resistance support levels
buy signal blue arrow sell signal red arrow
It is recommended to use on a timeframe from M15 and higher since there are large movements
and less market noise
Stoploss is set for the nearest minimum or maximum or at a distance of 10-30 points.....


추천 제품
The indicator detects and displays М. Gartley's Butterfly pattern. The pattern is plotted by the extreme values of the ZigZag indicator (included in the resources, no need to install). After detecting the pattern, the indicator notifies of that by the pop-up window, a mobile notification and an email. The pattern and wave parameters are displayed on the screenshots. The default parameters are used for demonstration purposes only in order to increase the amount of detected patterns. Parameters z
Price Magnets
Ivan Simonika
Price Magnet — Price Density and Attraction Levels Indicator Price Magnet is a professional analytical tool designed to identify key support and resistance levels based on statistical Price Density. The indicator analyzes a specified historical period and detects price levels where the market spent the most time. These zones act as “magnets,” attracting price action or forming a structural base for potential reversals. Unlike traditional Volume Profile tools, Price Magnet focuses on price-time d
Auto Fibo Pro m
DMITRII GRIDASOV
"Auto FIBO Pro" Crypto_Forex 지표 - 거래에 유용한 보조 도구입니다! - 지표는 자동으로 Fibo 수준과 로컬 추세선(빨간색)을 계산하여 차트에 배치합니다. - Fibonacci 수준은 가격이 반전될 수 있는 주요 영역을 나타냅니다. - 가장 중요한 수준은 23.6%, 38.2%, 50%, 61.8%입니다. - 역전 스캘핑이나 존 그리드 거래에 사용할 수 있습니다. - Auto FIBO Pro 지표를 사용하여 현재 시스템을 개선할 수 있는 기회도 많습니다. - Info Spread Swap Display가 있습니다. 현재 Spread와 Swap이 부착된 외환 쌍을 표시합니다. - 디스플레이에는 계정 잔액, 자본 및 마진도 표시됩니다. - 차트의 어느 모서리에서나 Info Spread Swap Display를 찾을 수 있습니다. 0 - 왼쪽 상단 모서리, 1 - 오른쪽 상단, 2 - 왼쪽 하단, 3 - 오른쪽 하단. 여기를 클릭하여 고품질 트레이딩 로봇과
The indicator detects and displays Shark harmonic pattern (see the screenshot). The pattern is plotted by the extreme values of the ZigZag indicator (included in the resources, no need to install). After detecting the pattern, the indicator notifies of that by a pop-up window, a mobile notification and an email. The indicator highlights the process of the pattern formation and not just the complete pattern. In the former case, it is displayed in the contour triangles. After the pattern is comple
Italo Trend Indicator
Italo Santana Gomes
4.74 (34)
BUY INDICATOR AND GET EA FOR FREE AS A BONUS + SOME OTHER GIFTS! ITALO TREND INDICATOR  is the best trend indicator on the market, the Indicator works on all time-frames and assets, indicator built after 7 years of experience on forex and many other markets. You know many trend indicators around the internet are not complete, does not help, and it's difficult to trade, but the Italo Trend Indicator is different , the Italo Trend Indicator shows the signal to buy or sell, to confirm the signal t
The indicator detects and displays 3 Drives harmonic pattern (see the screenshot). The pattern is plotted by the extreme values of the ZigZag indicator (included in the resources, no need to install). After detecting the pattern, the indicator notifies of that by a pop-up window, a mobile notification and an email. The indicator highlights the process of the pattern formation and not just the complete pattern. In the former case, it is displayed in the contour triangles. After the pattern is com
PointsVsBars
Stanislav Korotky
This indicator provides a statistical analysis of price changes (in points) versus time delta (in bars). It calculates a matrix of full statistics about price changes during different time periods, and displays either distribution of returns in points for requested bar delta, or distribution of time deltas in bars for requested return. Please, note, that the indicator values are always a number of times corresponding price change vs bar delta occurred in history. Parameters: HistoryDepth - numbe
FREE
Trend Ray
Andriy Sydoruk
The indicator shows the potential trend direction by cyclical-wave dependence. Thus, all the rays of the intersection will be optimal rays, in the direction of which the price is expected to move, taking into account the indicator period. Rays can be used as a direction for potential market movement. But we must not forget that the approach must be comprehensive, the indicator signals require additional information to enter the market.
Rainbow Price Visualizer
Vincent Jose Proenca
Rainbow Price Visualizer v1.21 See where the market really breathes. Turns your MT4 chart into an ultra-precise heatmap that highlights price zones favored by big players. Why it matters 300 price levels at 0.2‑pip resolution — microscopic detail. 8 visual themes (Rainbow, Fire, Ocean…) for instant readibility. Smart opacity: low noise fades, real zones pop. Lightweight rendering with automatic cleanup. Fully customizable: saturation, opacity, resolution, history depth. Bands project into the f
TrendInChannel
Andriy Sydoruk
This indicator is the undisputed leader among the indicators. And for this statement there is a good reason. The indicator builds a very high quality channel in which it generates signals to enter! What is the ideal strategy for the trader, since the trader always hesitates when choosing a strategy for the job. That is, this indicator will allow you to solve the dilemma of choosing a job by trend or to the channel, since it combines these two basic concepts. Working with the indicator is very
Scalper Strike
Yaroslav Varankin
works great with the trend, ideal for traders who trade using the scalping system. This is a pointer indicator. how to make deals. when the blue one appears, you need to open a trade to increase by 1 candle if the timeframe is m1 then for 1 minute, etc. if a red dot appears, you should make a deal to reduce it by 1 candle. Indicator signals appear along with a new candle; the working candle is the one on which the signal is located.
Double HMA lines MTF
Pavel Zamoshnikov
5 (1)
This is a multi-timeframe version of the popular Hull Moving Average (HMA). The Double HMA MTF Light indicator combines two timeframes on a single chart. The HMA of the higher timeframe defines the trend, and the HMA of the current timeframe defines short-term price movements. The indicator is freely distributed and hasn't audio signals or messages. Its main function is the visualization of price movements. If you need advanced functionality of the HMA multi-timeframe indicator (information ab
FREE
Trend PA
Mikhail Nazarenko
5 (3)
The Trend PA indicator uses   Price Action   and its own filtering algorithm to determine the trend. This approach helps to accurately determine entry points and the current trend on any timeframe. The indicator uses its own algorithm for analyzing price changes and Price Action. Which gives you the advantage of recognizing, without delay, a new nascent trend with fewer false positives. Trend filtering conditions can be selected in the settings individually for your trading style. The indicator
Wise Men Indicator demo
Bohdan Kasyanenko
3 (2)
The indicator displays signals according to the strategy of Bill Williams on the chart. Demo version of the indicator has the same features as the paid, except that it can work only on a demo account . Signal "First Wise Man" is formed when there is a divergent bar with angulation.  Bullish divergent bar - with lower minimum and closing price in the upper half. Bearish divergent bar - higher maximum and the closing price at the bottom half. Angulation is formed when all three lines of Alligator
FREE
The   Trendlines Oscillator   helps traders identify trends and momentum based on the normalized distances between the current price and the most recently detected bullish and bearish trend lines. The indicator features bullish and bearish momentum, a signal line with crossings, and multiple smoothing options. USAGE The   Trendlines Oscillator   works by systematically: Identifying pivot highs and lows. Connecting pivots to form bullish (support) and bearish (resistance) trendlines. Measuring
VSA Histogram
Richard Bystricky
VSA - P (Volume Spread Analysis) Period-Based Histogram is a tool that visually represents market volume dynamics using Volume Spread Analysis principles, with a focus on highlighting key volume changes over specific time periods. The histogram captures changes in volume and price spread relationships in real-time, enabling traders to detect early signals of accumulation, distribution, and shifts in buying or selling pressure. Indicator is non repainting and working with real-time on tick data.
Master the market rhythm with the Advanced Market Sessions indicator. Timing is everything in trading. Knowing exactly when major financial centers open and close is the key to understanding market volatility, liquidity, and directional bias. This indicator gives you crystal-clear visibility into the three major trading sessions: Asia, London, and New York. By automatically mapping the exact High and Low of each session in real-time, this tool empowers you to trade with true institutional contex
FREE
MACalcAuto MT4
Tatiana Savkevych
As you know, the main invariable indicator of all traders is the moving average; it is used in some way in most strategies. It is also obvious that this indicator is capable of showing good entries in every local area. For which it usually needs to be optimized or just visually adjusted. This development is intended for automatic optimization of the indicator. Once placed on the chart, the indicator will automatically re-optimize itself with the specified period ( PeriodReOptimization ) and dis
Persian Ichimoku: The Next Generation of Fibonacci-Enhanced Trading Elevate your Ichimoku strategy with the most advanced and customizable Ichimoku indicator on the Market. The Persian Ichimoku is not just another Ichimoku cloner; it is a professional-grade trading powerhouse designed for traders who demand precision, flexibility, and deeper market insights. By merging classic Ichimoku Kinko Hyo logic with Fibonacci ratios and the innovative Quality Line , this tool redefines trend analysis. ###
Basic Theme Builder
Mehran Sepah Mansoor
5 (1)
Basic Theme Builder: 차트 맞춤화를 간편하게 Basic Theme Builder   지표로 거래 경험을 혁신하세요. 이 다용도 도구는 MetaTrader 4 에서 차트의 외관을 간편하게 사용자 맞춤화할 수 있도록 설계된 직관적인 패널을 제공합니다. 다양한 테마와 색상 스킴을 간단히 전환하여 거래 환경의 시각적 매력과 기능성을 향상시킬 수 있습니다.   Free MT5 version Basic Theme Builder   지표는 MetaTrader 4 차트를 손쉽게 개인화하려는 거래자에게 최적의 도구입니다. 간단한 패널 인터페이스와 다양한 테마 프리셋을 통해 거래 스타일이나 기분에 맞게 차트의 외관을 빠르게 조정할 수 있습니다. 클래식한 룩부터 현대적인 미학까지, Basic Theme Builder는 시각적 경험을 향상시키고 집중력을 높이는 데 도움이 되는 다양한 옵션을 제공합니다. 오늘 이 실용적이고 사용하기 쉬운 지표로 거래 환경을 최적화하세요. 주요 기능: 간편
FREE
하모닉 패턴은 시장 반전점을 예측하는 데 가장 적합합니다. 이러한 패턴은 높은 승률과 하루 동안 다양한 거래 기회를 제공합니다. 저희 인디케이터는 하모닉 트레이딩 문헌에 기반하여 가장 인기 있는 하모닉 패턴을 식별합니다. 중요 사항: 이 인디케이터는 다시 그리지 않으며 (D 지점에서 패턴을 감지함), 따라잡지 않습니다 (패턴이 유효하거나 취소됨). 사용 방법: MT5 차트에 인디케이터를 끌어다 놓으세요. 패턴 감지를 TRUE로 설정하세요 (ABCD; Gartley). 원하는대로 편차를 조정하세요 (높은 편차는 더 많은 패턴, 낮은 편차는 더 적은 패턴). 색상을 원하는 대로 사용자 정의하세요. 필요에 따라 ENTRY POINT, TP 및 SL에 대한 경고를 활성화하거나 비활성화하세요. 패턴 감지 시: 알고리즘은 D 지점에서 패턴을 감지합니다. 경고가 활성화되어 있으면 패턴 감지에 대한 알림을 보냅니다. 패턴이 무효화되면 "패턴 취소"라는 메시지가 포함된 경고가 트리거됩니다. 성공적인
FREE
Currency Strength Multimeter
Sameer Shariff
4.57 (7)
VIEW THE CURRENCY STRENGTH AND PAIR STRENGTH FOR "X" BARS IN A GIVEN TIMEFRAME. The Currency Strength Multimeter indicator shows the strength, direction and rank of each of the following currencies: AUD CAD CHF EUR GBP JPY NZD USD Furthermore, it also shows the strength, direction and rank of each of the following currency pairs: AUDCAD AUDCHF AUDJPY AUDNZD AUDUSD CADCHF CADJPY CHFJPY EURAUD EURCAD EURCHF EURGBP EURJPY EURNZD EURUSD GBPAUD GBPCAD GBPCHF GBPJPY GBPNZD GBPUSD NZDCAD NZDCHF NZDJPY
FREE
Power Trend Free
Yurij Kozhevnikov
5 (2)
Power Trend Free - the indicator shows the trend strength in the selected period. Input Parameters The indicator has three input parameters: Period - a positive number greater than one, it shows the number of candlesticks used for calculations. If you enter one or zero, there will be no error, but the indicator will not be drawn. Applied Price - the standard "Apply to:" set meaning data used for the indicator calculation: Close - Close prices; Open - Open prices; High - High prices; Low - Low p
FREE
평균 방향 지수(ADX) 다중 통화 스캐너 MT4는 여러 통화 쌍을 동시에 분석하기 위해 설계된 고급 거래 지표입니다. 이는 평균 방향 지수를 기반으로 실시간 신호를 제공하여 거래자가 의사 결정 프로세스를 향상시키는 데 도움을 주며, 효율적인 시장 추세 분석을 가능하게 합니다. 이 도구는 추세 강도와 방향 이동을 식별하는 과정을 단순화하여 거래 경험을 간소화하며, ADX 기반 전략을 사용하는 거래자에게 필수 자산이 됩니다. 실시간 알림과 사용자 친화적인 대시보드를 통해 거래자는 시장 상황을 신속하게 평가하고 정보에 기반한 거래 결정을 내릴 수 있습니다. MQL 제품 설치 가이드 | 구매한 MQL 제품 업데이트 MT4/MT5 | 일반 문제 해결 가이드 | 지표 설정 / 가이드 주요 기능 버퍼 통합: 지표 값을 접근 가능한 버퍼로 노출하여 Expert Advisor가 자동 거래를 위해 신호 데이터를 활용할 수 있도록 합니다. 시각적 화살표 신호: 신호 캔들에서 차트에 명확한 매수/매도
Hi Low Last Day MT4
Igor Vishnevskii
The  Hi Low Last Day ( Hi Lo Last Day )  indicator shows the high and low of the last trading day and the second trading day,  as well as the minimum and maximum of last week . There are many trading strategies on the daily levels. This indicator is indispensable when using such trading strategies. In fact, everything is simple in trading, you just need to understand and accept it for yourself. There is only price!!! What is price? This is the level on the chart. The level is the price that the
Currency Index Pro
Makarii Gubaydullin
8대 주요 통화의 현재 강도 내   #1 다기능 유틸리티:  66개 이상의 기능 포함, 이 지표 포함  |   질문이 있으면 저에게 연락하세요   |    MT5 버전 이 지표는 별도의 창에 표시되며 차트의 아무 곳으로 이동할 수 있습니다. 입력 설정에서   조정할 수 있습니다: 인터페이스 테마 : 다크 / 화이트; 접두사와 접미사, 브로커의 통화 쌍에 있는 경우: (예: 심볼이 "EURUSD .pro "라면, " .pro "를 접미사로 설정하세요); 패널 크기 폰트 크기 내   #1 다기능 유틸리티:  66개 이상의 기능 포함, 이 지표 포함  |   질문이 있으면 저에게 연락하세요   |    MT5 버전 내   #1 다기능 유틸리티:  66개 이상의 기능 포함, 이 지표 포함  |   질문이 있으면 저에게 연락하세요   |    MT5 버전 //---------------
Crypto_Forex 지표 HTF Ichimoku for MT4. - Ichimoku 지표는 가장 강력한 트렌드 지표 중 하나입니다. HTF는 - Higher Time Frame을 의미합니다. - 이 지표는 트렌드 트레이더와 가격 액션 항목과의 조합에 탁월합니다. - HTF Ichimoku 지표를 사용하면 더 높은 타임프레임의 Ichimoku를 현재 차트에 첨부할 수 있습니다. - 상승 추세 - 파란색 선 위에 빨간색 선(두 선 모두 클라우드 위에 있음) / 하락 추세 - 파란색 선 아래에 빨간색 선(두 선 모두 클라우드 아래에 있음). - 가격이 Ichimoku 클라우드 상단 테두리를 돌파했을 때만 BUY 주문을 엽니다. - 가격이 Ichimoku 클라우드 하단 테두리를 돌파했을 때만 SELL 주문을 엽니다. - HTF Ichimoku 지표는 큰 트렌드를 포착할 수 있는 기회를 제공합니다. 여기를 클릭하여 고품질 트레이딩 로봇과 지표를 확인하세요! 이 MQL5 웹사이트에서만
Support and resistance based on price action. Shows when level is filled and levels which are still active. Parameters are very simple, just max bars to see into history and color settings. Plan to add alerts and more parameters for flexibility. Also will be available for MT5 soon. Any suggestions are welcome. Usually I'm updating it fast when somebody is interesting in improvements.
Combined MT4
Ahmed Alaaeldin Abdulrahman Ahmed Elherzawi
Welcome to Investment Castle products   This product is exclusively available in the MQL5 market and is not available and will not be available anywehere else. The Combined indicator is a multi-time frame indicator and it is built using 3 indicators: Bands indicator which draws the support and resistance key levels   using up to 5 different time frames Patterns indicator which draws the chart patterns using up to 6 different time frames Spots indicator which shows the common candlestick pattern
Hello! Tired of constantly subscribing to other people's signals and earning pennies? Want to manage your own trading? Then you are on the right page! It's very simple ==> buy my indicator ==> put it on the chart ==> blue arrow - buy ==> red arrow - sell. Even an infant can do it! A handy histogram to trace the market direction. Are you still here? Then read the parameter descriptions and take a look at the screenshots: Stoch K period - period for calculating the% K oscillator line. Stoch
이 제품의 구매자들이 또한 구매함
Genesis Matrix Pro is a professional multi-timeframe trend detection indicator designed to help traders identify high-quality market alignment with clarity and structure. It combines 12 different technical indicators into one visual alignment matrix, allowing traders to quickly see when market conditions are bullish, bearish, or neutral. A signal is generated only when the selected strategies are aligned, helping reduce noise and improve decision-making. PLEASE CONTACT ME AFTER PURCHASE TO GET
Gann Made Easy
Oleg Rodin
4.83 (163)
Gann Made Easy 는 mr.의 이론을 사용하여 최고의 거래 원칙을 기반으로 하는 전문적이고 사용하기 쉬운 Forex 거래 시스템입니다. W.D. 간. 이 표시기는 Stop Loss 및 Take Profit Levels를 포함하여 정확한 BUY 및 SELL 신호를 제공합니다. PUSH 알림을 사용하여 이동 중에도 거래할 수 있습니다. 구매 후 거래 방법 안내 및 유용한 추가 지표를 무료로 받으시려면 저에게 연락주세요! 아마도 Gann 거래 방법에 대해 이미 여러 번 들었을 것입니다. 일반적으로 Gann의 이론은 초보자 거래자뿐만 아니라 이미 거래 경험이 있는 사람들에게도 매우 복잡한 것입니다. Gann의 거래 방식은 이론적으로 적용하기 쉽지 않기 때문입니다. 나는 그 지식을 연마하고 Forex 지표에 최고의 원칙을 적용하기 위해 몇 년을 보냈습니다. 표시기는 적용하기가 매우 쉽습니다. 차트에 첨부하고 간단한 거래 권장 사항을 따르기만 하면 됩니다. 지표는 지속적으로 시장 분석
The Propfolio Master Suite is the ultimate all-in-one analytical workstation for professional traders. Combining the power of the Beat The Market Maker (BTMM) methodology, Smart Money Concepts (SND/Liquidity), and Advanced Volume Profile, this suite replaces multiple different indicators with one optimized engine. Monitor up to 14 pairs simultaneously from a single chart, instantly identify market cycles, and seamlessly map institutional footprints with the click of a button. The Command Center
Scalper Inside PRO
Alexey Minkov
4.74 (69)
Scalper Inside PRO Scalper Inside PRO is an intraday trend and scalping indicator for MetaTrader 4 that uses an exclusive algorithm to quickly detect market direction and key target levels. It automatically calculates entry, exit and multiple profit targets, and shows detailed performance statistics so you can see how different instruments and strategies performed. This helps you choose the most suitable trading instruments for the current market conditions. Additionally, you can easily integrat
M1 Sniper
Oleg Rodin
5 (23)
M1 SNIPER 는 사용하기 쉬운 거래 지표 시스템입니다. M1 시간대에 맞춰 설계된 화살표 지표입니다. 이 지표는 M1 시간대 스캘핑을 위한 단독 시스템으로 사용할 수 있으며, 기존 거래 시스템의 일부로도 사용할 수 있습니다. 이 거래 시스템은 M1 시간대 거래용으로 특별히 설계되었지만, 다른 시간대에도 사용할 수 있습니다. 원래는 XAUUSD와 BTCUSD 거래를 위해 이 방법을 설계했지만, 다른 시장 거래에도 유용하다는 것을 알게 되었습니다. 이 지표의 신호는 추세 방향과 반대로 거래될 수 있습니다. 저는 지표의 신호를 활용하여 양방향으로 거래할 수 있도록 돕는 특별한 거래 기법을 알려드립니다. 이 방법은 특별한 동적 지지선과 저항선 가격 영역을 활용하는 것을 기반으로 합니다. 구매하시면 M1 SNIPER 화살표 지표를 바로 다운로드하실 수 있습니다. 또한, 아래 스크린샷에 표시된 Apollo Dynamic SR 지표는 M1 SNIPER 도구를 사용하는 모든 사용자에게 무료로
PRO Renko System
Oleg Rodin
5 (30)
PRO Renko System 은 RENKO 차트 거래를 위해 특별히 고안된 매우 정확한 거래 시스템입니다. 이것은 다양한 거래 상품에 적용될 수있는 보편적 인 시스템입니다. 체계는 효과적으로 당신에게 정확한 반전 신호에 접근을 주는 소위 시장 소음을 중화합니다. 이 표시기는 사용하기가 매우 쉽고 신호 생성을 담당하는 매개 변수가 하나만 있습니다. 당신은 쉽게 당신의 선택의 어떤 무역 계기에 공구를 적응시킬 수 있고 renko 막대기의 크기. 나는 항상 당신이 내 소프트웨어로 수익성있게 거래 할 수 있도록 추가 지원을 제공 할 준비가되어 있습니다! 나는 당신에게 행복하고 수익성있는 거래를 기원합니다! 구매 후 저에게 연락하십시오! 내 렌코 차트 생성기를 보내드립니다. 또한 내 개인 권장 사항 및 시스템의 다른 모듈을 무료로 공유 할 것입니다!
Auto Optimized Parabolic RSI: 고급 3D 모멘텀 엔진 대부분의 개인 투자자용 보조지표는 시장의 변동성이 변하는 순간 무용지물이 되는 정적인 입력값에 의존하기 때문에 실패합니다. Auto Optimized Parabolic RSI는 자체적인 수학적 우위를 지속적으로 재계산하여 "보조지표 노후화" 문제를 해결하며, 기관급 퀀트 트레이딩의 적응력을 귀하의 MT5 터미널에 직접 제공합니다. 핵심 이점: 맞춤형 인메모리 3D 최적화   표준 자동 최적화 도구들은 일반적인 보조지표 호출로 터미널에 과부하를 일으켜 MT5 플랫폼을 멈추게 하는 경우가 많습니다. 이 도구는 이러한 병목 현상을 완전히 우회합니다. 맞춤형 네이티브 RAM 기반 계산기로 구축된 내부 엔진은 차트를 로드하거나 타임프레임을 변경할 때마다 빛처럼 빠른 3D 그리드 검색을 실행합니다. RSI 기간(주기), SAR 스텝(가속도) 및 SAR 최대치(속도 제한)를 동시에 스캔하여 플랫폼 지연 없이 수만 개의
NAM Order Blocks
NAM TECH GROUP, CORP.
3.67 (3)
MT4 Multi-timeframe Order Blocks detection indicator. Features - Fully customizable on chart control panel, provides complete interaction. - Hide and show control panel wherever you want. - Detect OBs on multiple timeframes. - Select OBs quantity to display. - Different OBs user interface. - Different filters on OBs. - OB proximity alert. - ADR High and Low lines. - Notification service (Screen alerts | Push notifications). Summary Order block is a market behavior that indicates order collection
Smart Price Action Concepts
Issam Kassas
4.77 (13)
우선적으로, 이 거래 도구는 전문적인 거래에 이상적인 비-다시 그리기 및 지연되지 않는 지표입니다.  온라인 강좌, 사용자 매뉴얼 및 데모. 스마트 가격 액션 컨셉트 인디케이터는 신규 및 경험 많은 트레이더 모두에게 매우 강력한 도구입니다. Inner Circle Trader Analysis 및 Smart Money Concepts Trading Strategies와 같은 고급 거래 아이디어를 결합하여 20가지 이상의 유용한 지표를 하나로 결합합니다. 이 인디케이터는 스마트 머니 컨셉트에 중점을 두어 대형 기관의 거래 방식을 제공하고 이동을 예측하는 데 도움을 줍니다.  특히 유동성 분석에 뛰어나 기관이 어떻게 거래하는지 이해하는 데 도움을 줍니다. 시장 트렌드를 예측하고 가격 변동을 신중하게 분석하는 데 탁월합니다. 귀하의 거래를 기관 전략에 맞추어 시장의 동향에 대해 더 정확한 예측을 할 수 있습니다. 이 인디케이터는 시장 구조를 분석하고 중요한 주문 블록을 식별하고 다양한
Quants HL Break
Ferhat Mutlu
5 (2)
LH 및 HL 브레이크아웃을 찾기 위한 순수 가격 조치에 의한 고급 계산. 그것은 당신에게 시장에서 큰 반전 포인트를 줄 것입니다.LH 및 HL 신호는 traingle 브레이크 아웃에도 사용할 수 있습니다. 브레이크 아웃이 발생하면 강한 반전을 나타냅니다. 이동 평균에 대한 좋은 필터입니다. 추세 지표와 함께 사용하는 것이 좋습니다. 지원 및 저항, 공급 수요 지표에 대한 추가 확인으로 사용할 수 있습니다. 자세한 내용은 다음 외환 스레드에서 찾을 수 있습니다. 표시기가 다시 칠해지지 않습니다. Buffers :   SetIndexBuffer ( 0 ,UpBar);      SetIndexBuffer ( 1 ,UpBar2);           SetIndexBuffer ( 2 ,DnBar);      SetIndexBuffer ( 3 ,DnBar2);           SetIndexBuffer ( 4 ,UpBarTop);      SetIndexBuffer ( 5 ,UpBa
Dynamic Forex28 Navigator
Bernhard Schweigert
4.43 (7)
Dynamic Forex28 Navigator - 차세대 외환 거래 도구. 현재 49% 할인. Dynamic Forex28 Navigator는 오랫동안 인기 있는 지표의 진화형으로, 세 가지의 힘을 하나로 결합했습니다. 고급 통화 Strength28 지표(695개 리뷰) + 고급 통화 IMPULSE with ALERT(520개 리뷰) + CS28 콤보 신호(보너스). 지표에 대한 자세한 정보 https://www.mql5.com/en/blogs/post/758844 차세대 Strength 지표는 무엇을 제공합니까?  원래 지표에서 좋아했던 모든 것이 새로운 기능과 더 높은 정확도로 강화되었습니다. 주요 기능: 독점적인 통화 Strength 공식.  모든 시간대에 걸쳐 부드럽고 정확한 강도선. 추세와 정확한 진입을 식별하는 데 이상적입니다. 역동적인 시장 피보나치 수준(시장 피보나치).  이 지표에만 있는 고유한 기능. 가격 차트가 아닌 통화 강도에 피보나치가 적용됩니다.
PZ Harmonacci Patterns
PZ TRADING SLU
3.17 (6)
Trade smarter, not harder: Empower your trading with Harmonacci Patterns This is arguably the most complete harmonic price formation auto-recognition indicator you can find for the MetaTrader Platform. It detects 19 different patterns, takes fibonacci projections as seriously as you do, displays the Potential Reversal Zone (PRZ) and finds suitable stop-loss and take-profit levels. [ Installation Guide | Update Guide | Troubleshooting | FAQ | All Products  ] It detects 19 different harmonic pric
RFI levels PRO
Roman Podpora
5 (1)
이 지표는 추세 반전 지점과 가격 반등 영역을 정확하게 보여줍니다.       주요 투자자들   . 새로운 트렌드가 형성되는 곳을 파악하고 최대한 정확하게 의사결정을 내리며 모든 거래를 완벽하게 통제합니다. TREND LINES PRO   지표와 함께 사용할 때 최대의 잠재력을 발휘합니다.  VERSION MT5 지표가 보여주는 내용: 새로운 추세의 시작 시 활성화되는 반전 구조 및 반전 수준. 최소한의 위험 대비 수익률을 갖는 이익 실현   (TAKE PROFIT)   및   손절매(STOP LOSS)   레벨 표시       RR 1:2   . 지능형 손실 감소 로직이 적용된 손절매 기능. 지정된 지표에서 두 가지 추세 유형에 대한 반전 패턴을 표시합니다. 지표: 트렌드를 따라   트렌드 라인 프로   (글로벌 트렌드 변화) 트렌드 프로   (빠른 트렌드 변화) 간단하고 효과적입니다       스캐너       실시간 추세 (신규). 다중 시간 프레임 도구 필터링. 표시하다  
Trend Catcher ind
Ramil Minniakhmetov
트렌드 캐처 인디케이터 트렌드 캐처 인디케이터는 개발자가 자체 개발한 맞춤형 적응형 트렌드 분석 지표들을 조합하여 시장 가격 움직임을 분석합니다. 단기적인 노이즈를 제거하고 근본적인 모멘텀 강도, 변동성 확대, 가격 구조 움직임에 집중하여 진정한 시장 방향을 파악합니다. 또한 이동 평균, RSI, 변동성 필터와 같은 맞춤형 지표들을 활용하여 가격을 평활화하고 트렌드를 필터링합니다. 실제 운영 모니터링 및 기타 제품은 다음 링크에서 확인하실 수 있습니다: https://www.mql5.com/en/users/mechanic/seller 텔레그램에서는 EA나 설정 파일을 판매하지 않습니다. 사기이니 주의하세요. 모든 설정 파일은 블로그에서 무료로 제공됩니다. 중요! 구매 후 즉시 연락 주시면 사용 방법 및 보너스를 드립니다!
Apollo SR Master
Oleg Rodin
5 (2)
Apollo SR Master는 지지/저항 구간에서의 거래를 더욱 쉽고 안정적으로 만들어 주는 특수 기능을 갖춘 지지/저항 지표입니다. 이 지표는 지역 가격의 고점과 저점을 감지하여 시간 지연 없이 실시간으로 지지/저항 구간을 계산합니다. 새롭게 형성된 저항 구간을 확인하기 위해 지표는 해당 저항 구간을 실제 매도 또는 매수 신호로 활용할 수 있음을 나타내는 특수 신호를 표시합니다. 이 경우, 저항 구간의 강도가 높아지고, 따라서 저항 구간에서의 성공적인 거래 가능성도 높아집니다. 이것이 바로 이 지표의 핵심 아이디어입니다. SR 존은 손절매와 이익실현을 더욱 쉽게 할 수 있도록 해줍니다. 신호 방향에 따라 SR 존 위 또는 아래 공간을 손절매로 활용할 수 있습니다. 또한, 반대쪽 SR 존은 잠재적 이익실현 영역으로 활용할 수 있습니다. 또한 Apollo SR Master 지표를 사용하는 모든 사용자에게 "Apollo Price Action System" 지표를 무료로 제공합니다.
Grabber System
Ihor Otkydach
5 (2)
탁월한 기술적 지표인 Grabber를 소개합니다. 이 도구는 즉시 사용 가능한 “올인원(All-Inclusive)” 트레이딩 전략으로 작동합니다. 하나의 코드 안에 강력한 시장 기술 분석 도구, 매매 신호(화살표), 알림 기능, 푸시 알림이 통합되어 있습니다. 이 인디케이터를 구매하신 모든 분들께는 다음의 항목이   무료로   제공됩니다: Grabber 유틸리티: 오픈 포지션을 자동으로 관리하는 도구 단계별 영상 매뉴얼: 설치, 설정, 그리고 실제 거래 방법을 안내 맞춤형 세트 파일: 인디케이터를 빠르게 자동 설정하여 최고의 성과를 낼 수 있도록 도와줍니다 다른 전략은 이제 잊어버리세요! Grabber만이 여러분을 새로운 트레이딩의 정점으로 이끌어 줄 수 있습니다. Grabber 전략의 주요 특징: 거래 시간 프레임: M5부터 H4까지 거래 가능한 자산: 어떤 자산이든 사용 가능하지만, 제가 직접 테스트한 종목들을 추천드립니다 (GBPUSD, GBPCAD, GBPCHF, AUDCAD
Advanced Supply Demand
Bernhard Schweigert
4.91 (300)
현재 40% 할인! 초보자나 전문 트레이더를 위한 최고의 솔루션! 이 보조지표는 우리가 다수의 독창적 기능과 새로운 공식을 통합한 독특하고 고품질이며 저렴한 거래 도구입니다. 이 업데이트를 통해 이중 시간대를 표시할 수 있습니다. 더 높은 TF를 표시할 수 있을 뿐만 아니라 차트 TF와 더 높은 TF 모두를 표시할 수 있습니다: 중첩 영역 표시. 모든 Supply Demand 트레이더들이 좋아할 것입니다. :) 중요한 정보 공개 Advanced Supply Demand의 잠재력을 극대화하려면 다음을 방문하십시오. https://www.mql5.com/ko/blogs/post/720245   진입 또는 목표의 명확한 트리거 포인트를 정확히 찾아냄으로 해서 거래가 어떻게 개선될지 상상해 보십시오. 새로운 알고리즘을 기반으로 매수자와 매도자 간의 잠재적인 불균형을 훨씬 더 쉽게 분간할 수 있습니다. 왜냐하면 가장 강한 공급영역과 가장 강한 수요 영역과 과거에 어떻게 진행 되었는지를(이전
GoldRush Trend Arrow Signal
Kirk Lee Holloway
5 (2)
GoldRush 트렌드 화살표 신호 GoldRush 트렌드 화살표 신호 지표는 XAU/USD 시장에서 고속 단기 스캘핑 트레이더를 위해 설계된 정밀한 실시간 트렌드 분석을 제공합니다. 1분 시간대에 특화되어 설계된 이 도구는 명확한 진입점을 표시하는 방향성 화살표를 제공하여 스캘퍼들이 변동성이 높은 시장 환경에서도 자신 있게 거래할 수 있도록 합니다. 이 지표는 PRIMARY 및 SECONDARY 경고 화살표로 구성됩니다. PRIMARY 신호는 추세 방향의 변화를 나타내는 흰색과 검은색 방향성 화살표이며, SECONDARY 신호는 PRIMARY 화살표가 지시하는 방향을 확인하고 잠재적인 거래 진입점을 표시하는 파란색과 빨간색 화살표입니다. 참고: 추세 방향이 변경된 후 PRIMARY 경고 화살표가 단 하나만 표시될 경우, 다수의 SECONDARY 파란색/빨간색 화살표가 표시될 수 있음을 유의해야 합니다. SECONDARY 신호는 신호 기준을 충족하는 어떤 캔들 이후에도 표시
Introduction to Fractal Pattern Scanner Fractal Indicator refers to the technical indicator that makes use of the fractal geometry found in the financial market. Fractal Pattern Scanner is the advanced Fractal Indicator that brings the latest trading technology after the extensive research and development work in the fractal geometry in the financial market. The most important feature in Fractal Pattern Scanner is the ability to measure the turning point probability as well as the trend probabi
Advanced Currency Strength28 Indicator
Bernhard Schweigert
4.91 (657)
현재 40% 할인 초보자 또는 전문가 트레이더를 위한 최고의 솔루션! 이 지표는 우리가 독점 기능과 새로운 공식을 통합했기 때문에 독특하고 고품질이며 저렴한 거래 도구입니다. 단 하나의 차트로 28 Forex 쌍의 통화 강도를 읽을 수 있습니다! 새로운 추세 또는 스캘핑 기회의 정확한 트리거 포인트를 정확히 찾아낼 수 있기 때문에 거래가 어떻게 개선될지 상상해 보십시오. 사용 설명서: 여기를 클릭  https://www.mql5.com/en/blogs/post/697384 그것이 첫 번째, 원본입니다! 쓸모없는 지망생 클론을 사지 마십시오. 더 스페셜  강력한 통화 모멘텀을 보여주는 하위 창의 화살표 GAP가 거래를 안내합니다! 기본 또는 호가 통화가 과매도/과매도 영역(외부 시장 피보나치 수준)에 있을 때 개별 차트의 기본 창에 경고 표시가 나타납니다. 통화 강도가 외부 범위에서 떨어질 때 풀백/반전 경고. 교차 패턴의 특별 경고 추세를 빠르게 볼 수 있는 다중 시간
Cycle Sniper
Elmira Memish
4.39 (36)
Please contact us after your purchase and we will send you the complimentary indicators to complete the system Cycle Sniper is not a holy grail but when you use it in a system which is explained in the videos, you will feel the difference. If you are not willing to focus on the charts designed with Cycle Sniper and other free tools we provide, we recommend not buying this indicator. We recommend watching the videos about the indiactor and system before purchasing. Videos, settings  and descri
Market Structure Patterns MT4
Samuel Manoel De Souza
5 (18)
Market Structure Patterns   is an indicator based on   smart money concepts   that displays   SMC/ICT   elements that can take your trading decisions to the next level. Take advantage of the   alerts ,   push notifications   and   email messages   to keep informed from when an element is formed on the chart, the price crosses a level and/or enters in a box/zone. Developers can access the values of the elements of the indicator using the   global variables  what allows the automation of trading d
Advanced UT BOT ALERTS for MT4 전문가용 다중 필터 추세 탐지 시스템|강화된 UT BOT 엔진 우리는 고품질 지표만 제공합니다. Advanced UT BOT 은 전문가용으로 설계되었으며, 안정적인 신호 로직과 안전한 계산 구조로 지연이나 잘못된 갱신을 방지합니다. 과거 신호를 다시 그리거나, 수정하거나, 삭제하지 않습니다. 모든 BUY / SELL 신호는 캔들이 마감된 후에만 생성되어 고정됩니다. 실시간 거래 중에는 리페인트가 없으며 , 캔들이 닫히는 즉시 신호가 표시됩니다. 한정 기간 할인 중 — 다음 가격은 49달러로 인상됩니다. 가격 인상 전에 지금 바로 확보하세요. 제품 개요 Advanced UT BOT ALERTS   는   UT BOT 의 핵심 로직을 기반으로 완전히 재설계된 차세대 추세 신호 시스템입니다. MT5 환경에 맞게 최적화되었으며, 다중 필터 구조, 실시간 시각화, 정밀 알림 시스템을 통합했습니다. UT Bot 지표는 원래   Yo
구매 후 저에게 연락하여 이 지표를 기반으로 한 보너스 EA를 받으십시오. Self Optimizing Double MA Strategy는 파라미터 추측을 없애기 위해 설계된 전문가 수준의 트레이딩 도구입니다. 내장된 자동 최적화 엔진으로 구동되며, 통계적 우위를 유지하기 위해 백그라운드에서 수천 개의 파라미터 조합을 시뮬레이션하여 변화하는 시장 조건에 지속적으로 적응합니다. 정적이고 구식인 설정에 의존하는 대신, 이 인디케이터는 자체 로직을 동적으로 업데이트하여 현재 시간대와 종목에 가장 수익성 있는 구성을 찾습니다. 주요 기능 내장된 자동 최적화: 시스템은 단기 MA, 장기 MA 및 RSI 기간을 주기적으로 다시 계산하여, 선택한 업데이트 빈도에 따라 설정이 항상 현재 시장 리듬과 일치하도록 보장합니다. MA 다이버전스 필터: 이동평균선이 활발하게 발산(확장)할 때만 시그널을 검증하는 핵심 추세 강도 지표입니다. 이는 평균선이 수렴하거나 평탄한 횡보장에서는 잘못된 진입을 방지합
Day Trader Master
Oleg Rodin
5 (15)
Day Trader Master 는 데이 트레이더를 위한 완벽한 거래 시스템입니다. 시스템은 두 개의 지표로 구성됩니다. 하나의 지표는 매수 및 매도를 위한 화살표 신호입니다. 얻을 수 있는 화살표 표시기입니다. 2차 지표를 무료로 드립니다. 두 번째 지표는 이러한 화살표와 함께 사용하도록 특별히 설계된 추세 지표입니다. 표시기는 반복하지 않고 늦지 않습니다! 이 시스템을 사용하는 것은 매우 간단합니다. 2색 선으로 표시되는 현재 추세 방향의 화살표 신호를 따라가기만 하면 됩니다. 파란색은 구매 추세입니다. 빨간색은 판매 추세입니다. 파란색 화살표는 매수 신호입니다. 빨간색 화살표는 매도 신호입니다. 추세선의 색상과 일치하려면 화살표의 색상과 신호의 방향이 필요합니다. 화살표 표시기는 주로 시간 간격 M5 및 M15에서 일중 거래를 위해 만들어졌습니다. 그러나 기술적으로 시스템은 다른 시간 간격으로 사용할 수 있습니다. 표시기에는 PUSH 메시지 기능이 있는 팝업 경고가 장착되어 있
Candle Power Pro
Thushara Dissanayake
4.5 (8)
그만큼       캔들 파워 프로       디코딩하도록 설계된 정교한 거래 도구입니다.       실제 거래량 압박, 틱 데이터 불균형, 기관 주문 흐름 역학       측정하여       황소 진드기와 곰 진드기의 싸움       실시간으로. 이 지표는 원시       볼륨 데이터를 실행 가능한 통찰력으로 변환하여   트레이더가 식별할 수 있도록 돕습니다.       스마트 머니 움직임, 유동성 탐색 및 숨겨진 시장 심리학       각 가격 캔들 뒤에 있는       구매자/판매자 볼륨 비율, 분기 패턴 및 볼륨 기반 확인을   통해 격차를 해소합니다.       가격 변동 및 볼륨 분석은   거래자에게 매우 중요합니다.       ICT, SMC 및 기관 거래 방법론   . 기존의 볼륨 지표와 달리,       캔들 파워 프로       에 초점을 맞춘다       각 캔들의 움직임이 기초 자산과 일치하는지 여부를 보여주는   틱 데이터 세분성       황소/곰의 힘  
외환 거래를 한다면, 통화 강도와 통화쌍 상관관계에 대한 상세한 정보를 아는 것은 거래 실력을 한 단계 끌어올리는 데 큰 도움이 됩니다. 상관관계를 분석하면 리스크를 절반으로 줄일 수 있고, 강도 분석을 통해 수익을 극대화할 수 있습니다. 이 지표는 통화 강도 분석과 통화쌍 상관관계를 결합하여 가장 적합한 통화쌍을 선택할 수 있도록 도와주는 하이브리드 접근 방식을 제공합니다. 통화 강도 분석 활용 방법 예를 들어, 당신의 거래 전략이 AUD/JPY 매수 기회를 제공한다고 가정해 봅시다. 하지만 KT 통화 강도 분석을 통해 JPY가 AUD보다 강해지고 있다는 것을 발견했다면, 이 거래는 손실로 끝날 가능성이 높습니다. 이 지표를 사용하면 이러한 손실을 쉽게 피할 수 있습니다. 통화쌍 상관관계 활용 방법 또 다른 예로, 거래 전략이 NZD/USD와 GBP/JPY 두 통화쌍 모두에 대해 매도 기회를 제공한다고 가정해 봅시다. KT 통화쌍 상관관계 분석을 사용하면 이 두 통화쌍 간 상관
Route Lines Prices - 은 가격 방향을 찾는 데 사용되는 지표입니다. 간단한 인터페이스에는 가격 움직임 및 미래 방향 계산을 위한 다양한 알고리즘이 포함되어 있습니다. 이러한 알고리즘에는 사용된 시간대에 따른 변동성 계산 및 가격 평활화 기능이 있습니다. 이 지표는 " Calculating price values " 값을 변경하는 단일 매개변수를 제공합니다. 기본값인 1은 균형 잡힌 자동 계산을 제공하며, 별도의 설정 없이 바로 사용할 수 있습니다. 2에서 500 사이의 값을 수동으로 변경하여 자신만의 거래 시스템에 맞게 지표를 맞춤 설정할 수 있습니다. 이 지표는 M1부터 H4까지의 시간대에서 사용을 권장합니다. 모든 거래 상품에 적용 가능합니다. 신호 화살표는 캔들 종가에 생성되며, 과거 차트에는 다시 그려지지 않습니다. 메인 차트에 동일한 화살표가 표시됩니다. 다양한 유형의 알림을 사용할 수 있으며, 내장된 라인 궤적 카운터는 종가를 기반으로 작동합니다. 이는
KURAMA GOLD SIGNAL PRO (MT4) — 7층 필터, 자동 TP/SL, 품질 점수를 탑재한 XAUUSD 완벽 트레이딩 시스템 리페인트 없음. 리드로우 없음. 지연 없음. 모든 신호는 영구적입니다. 보이는 것이 그대로입니다. 보너스: 영구 라이선스 구매자에게 AI Zone Radar ($59 상당) + 전체 PDF 매뉴얼을 무료 제공. 구매 후 메시지를 보내주세요. AI Zone Radar: https://www.mql5.com/en/market/product/175834 트레이더의 신뢰: 활발한 골드 트레이더 커뮤니티에서 이미 사용 중. 정확도와 사용 편의성으로 호평을 받고 있습니다. 당신의 문제 — 그리고 해결책 골드가 하루 $30-50 움직인다는 걸 알고 있죠. 여기서 돈을 벌 수 있다는 것도. 하지만: - 너무 일찍 진입해서 가격이 당신 방향으로 가기 전에 $10 손절당함 - MA 터치마다 진입하지만 절반은 실패 - TP/SL 시스템이 없어서 너무
Master head and shoulders patterns for better trading decisions A head and shoulders pattern is a chart formation that resembles a baseline with three peaks, the outside two are close in height and the middle is highest. It predicts a bullish-to-bearish trend reversal and is believed to be one of the most reliable trend reversal patterns. It is one of several top patterns that signal, with varying degrees of accuracy, that a trend is nearing its end. [ Installation Guide | Update Guide | Trouble
제작자의 제품 더 보기
Sniper MACD
Yaroslav Varankin
4.35 (17)
The "Sniper MACD" indicator is an improved version of the classic MACD, designed to enhance trading efficiency. It features additional filtering and multiple smoothing methods, allowing for more accurate signals. Features: Additional Filtering: Improves signal quality, reducing the likelihood of false triggers and increasing forecast accuracy. Multiple Smoothing: Reduces market noise, providing more reliable signals. Volume Integration: The built-in volume indicator helps assess market conditio
FREE
RVI Sniper Alert
Yaroslav Varankin
4.5 (4)
The Alert Arrows RVI indicator is an advanced version of the Relative Vigor Index (RVI), augmented with alert arrow functionality. It can identify potential support and resistance levels, providing traders with valuable insights into market dynamics. Key Features: Alert Arrows: Integrated alert arrows offer visual cues for potential trading opportunities. Additional Filters: Two extra filters are implemented to improve the indicator's readings, increasing the accuracy and reliability of signals
FREE
Big Scalper Pro
Yaroslav Varankin
Big Scalper Pro комбинированный осциллятор, отображающий на ценовом графике  Сигналы на вход отображаются в виде стрелок соответствующего цвета, а также дублируются текстовым сообщением. есть звуковые и текстовые алерты push уведомления уведомления на email все это можно включить и выключить в настройках индикатора настройки период это период г л авного индикатора в период это период дополнительного индикатора волатильности
Scalping Binary Option Pro is an arrow indicator that is completely free from repainting . Although it may work incorrectly in strategy testers, its signals remain relevant for real trading. Signals: A red arrow pointing down indicates a selling opportunity, while a green arrow pointing up indicates a buying opportunity. Settings: All you need to adjust are the colors of the signal arrows and the sound alert for signal notifications. Usage Recommendations: It is best to use the indicator on hig
Revolution martingale
Yaroslav Varankin
5 (3)
Revolution Martingale is an indicator designed for trading binary options on the M5 timeframe. Features: M5 Timeframe: It is recommended to use the indicator on the M5 timeframe for optimal trading. Trade Entry: Trades should only be opened on the first candle after a signal appears. Signals: A blue diamond indicates a buying opportunity for upward movement, while a red diamond indicates a buying opportunity for downward movement. Configured for Effective Binary Options Trading: The indicator i
FREE
Magic Filter MTF
Yaroslav Varankin
Magic Filter MTF is perfect for any strategy. you do not need to load the chart with extra indicators like this one indicator will replace all additional filters for you it can also be a great strategy. it combines well with trading at local minima and maximums (resistance levels) multi-timeframe-multi-currency indicator 4 screen system is used 4 rows of arrows UTB indicators adjusted for different periods when two arrows pointing in the same direction on the same timeframe coincide,I t c
Mega Alert Level
Yaroslav Varankin
Mega Alert Level Indicator: A Simple Yet Valuable Tool The Mega Alert Level indicator provides sound, informational, push, and email notifications when the price of a currency pair touches or approaches standard support and resistance levels, as well as any other objects on the chart you select. Features: Notifications: Customize notifications to your preference—choose between Email, Popup, or Push. All settings are displayed in the upper right corner of the chart. Ease of Use: Simply attach th
FREE
Almas Wall Street
Yaroslav Varankin
Almas Wall Street is a professional arrow indicator with no repainting. Signals appear simultaneously with the formation of a candle. Trading Guidelines: Enter a trade for at least 2 candles or on the next candle after the signal for 1 candle. Screenshot 5 . A red arrow pointing down suggests considering sales, while a blue arrow suggests buying. All you need to configure are the colors of the signal arrows. It is recommended to apply this indicator in scalping on timeframes M1-M5. Signals occur
Brilliant Wall Street is a professional arrow indicator.  It is based on a mathematical calculation.  thanks to a special calculation algorithm that was developed by the best specialists  he is not late, moreover, he gives advanced signals.  -----------almost complete absence of redrawing------------.  signals appear with the advent of the candle.  It is recommended to enter a trade for at least 1-2 candles on the next candle, but you can also use a signal...  The red down arrow indicates that
Insider Sniper MTF
Yaroslav Varankin
This is a dial indicator for trading from the level of support resistance  --- complete lack of redrawing ---  He is able to determine the levels of support resistance  Finds the best entry points and shows them with arrows.  If a trend is forming, the indicator will always notify with a arrow signal.  buy signal blue arrow for sale red arrow  This signaling tool can also be used on a sideways market.  The main thing is that it is volatile.!!!!!!  Good percentage of correct indicator predictio
Level Wall Street
Yaroslav Varankin
I n the tester does not work, see how it works in the video; sorry for the inconvenience. UTB is done for real-time work quotation when trading. indicator draws resistance support levels Also, when a level appears, an arrow appears where to open a deal. You will not miss any desired level approach. The indicator showed good results on all graphs and time frames. recommended settings step 1800 p.s traders selling from wall street also use resistance support levels in their analytics how do tra
Mega Level
Yaroslav Varankin
Esta es una de las modificaciones de los canales Keltner. Ayuda a identificar puntos de entrada y salida lógicos. Ayuda a determinar un posible movimiento de precios. Crea canales equidistantes que se convierten en niveles de soporte y resistencia dinámicos. Facilita enormemente el análisis del mercado visual. El indicador es un multi-tiempo multi-tiempo muestra buenos resultados.
Ideal Channels MTF
Yaroslav Varankin
trading indicator, which automatically recognizes equal levels of support and resistance and otorova content and resistance and poison indicator uses elder system can be applied to any financial instruments and on any timeframes. the same indicator draws to. it is perfect for scalping as its essence is to trade in the channel. The indicator has many parameters that allow it to be conveniently customized. indicator settings filter - it filters the market noise that is, we get more accurate channe
Bad Boys
Yaroslav Varankin
The Bad Boys indicator is a arrow indicator percentage (of positive trades) of correct forecasts of the indicator, even during news releases, the indicator was tested on a real account and showed a good result of correct forecasts. Settings allow you to customize the color of the arrows. volatility period indicator period the number of bars for which the market analysis will be carried out price is the method when a signal will appear when opening when closing a candle, etc. volatility allows yo
Dream Wall Street
Yaroslav Varankin
Dream Wall Street   It represents the visualization of support resistance levels. the indicator marks the levels that are formed on a candle whose tick volume exceeds the average volume; it is perfect as it is without filters for scalping by level it can also be used as an addition to an existing trading system. The indicator can be used as a filter. It is already set up to configure anything for you. Settings allow you to customize the light levels
Divergent Accuracy
Yaroslav Varankin
The Divergent Accuracy indicator is designed to identify discrepancies on the price chart of a currency pair. The Divergent Accuracy indicator recognizes bullish and bearish divergences, and can also output a signal that a divergence has been detected... In addition to identifying divergences, the indicator works with overbought and oversold levels, and also shows arrows to enter the market...
Premium Volume
Yaroslav Varankin
The premium loudness indicator draws on the chart of a currency pair based on data on the price level in the back period in the input parameters of the indicator in the form of a histogram. The width of the histogram at this level means, conditionally, the number of transactions conducted on it If the broker provides real volume data, Cannot be received For example, the range H1 can be specified as H1, H4, D1, W1, MN1. For M1, it is recommended to use periodic settings for M5 values.
Premium Volumes Lite
Yaroslav Varankin
Premium Volume Lite The Premium Volume Lite indicator plots the distribution of deals according to price levels in the form of a histogram on a chart of a currency pair. The width of the histogram at this level means, conditionally, the number of transactions carried out on it. If the broker provides data on real volume, the indicator can show the distribution over it. Ranges can be equal only to standard timeframes not lower than the current one. о periods value is current then the indicator wi
Invisible Sniper
Yaroslav Varankin
The Invisible Sniper arrow indicator is built on the use of candlestick analysis. The indicator finds the “Absorption” reversal candlestick patterns on the price chart and, depending on the figure, bullish or bearish absorption, gives a signal to enter in the form of blue arrows to buy, red to sell. in the indicator Invisible Sniper implemented sound and text alert..
Dawn In Trading
Yaroslav Varankin
Dawn In Trading indicator is a new ray of light in trading! This indicator has been tested on a real chart in real trading; All statistics about this indicator from real trading on the market! From the screenshots you can see the profitability of quality and the number of signals of this tool, you can also check it in the tester! As soon as a blue arrow appears, open a deal to increase, when a red arrow appears, open a deal to fall! Signals appear when you open a new candle and do not redraw, t
Dream Binary Option
Yaroslav Varankin
It is possible to trade on any basic asset, but the experts holding testing give preference to currency pair USD/JPY, EUR/USD. Optimum time for work is considered European, the American session. with the standard settings which are already perfected to an ideal At emergence of a blue arrow under a candle the option UP is acquired. At emergence of a red arrow the option DOWN is acquired. It should be noted one feature of the indicator: the signal is formed on the current bar, but it is worth
Boss New
Yaroslav Varankin
boss ! Trading opportunities can be used in any underlying asset, but experts in conducting tests prefer the currency pair USD / JPY. The most favorable time for work is the European, American session. When the blue arrow appears, a red option under the candle is acquired UP. When the red arrow appears, the option DOWN is acquired. It is recommended to avoid trading during strong news releases
This indicator was tested on the basis of real statistics for all market indicators according to indicators for 3 months of trading. trade forecasts for usd / jpy on the m30 time frame were received on our statistics! if you have any questions, please contact us in private messages or in discussions under this indicator and we will figure it out and help any questions will arise personal messages or in discussions under this indicator As soon as the blue points appear, we open a deal to increa
Trend Hunter Pro
Yaroslav Varankin
The indicator is designed for opening trades for a long period. he is set up to get as many points from each trade as possible. he uses the scalping method... you can trade on any currency pairs indicator is already  you can trade at any time of the day but the preferred time of trading during the European American session. currency pairs eur / jpy, eur / usd currency pairs with high volatility then the results are much better.
Venom
Yaroslav Varankin
Venom indicator is a new type of indicator for scalping with high accuracy of correct predictions in the indicator you can select the indicator signal does not redraw, does not disappear, you can trust it 100% When a red blue arrow appears under the candlestick, an UP option is purchased. When red arrows appear, the DOWN option is purchased. the indicator is based on our new development, if there is an order with a large amount that opens in the direction we need, according to the analysis of th
Atom Pro Maximum
Yaroslav Varankin
the indicator showed excellent results in the scalping trade, and the same excellent results in the trading of exact instruments led to the fact that of these indicators showed themselves perfectly during the exit from the news with an  during low volatility,  This instrument has been tested for more than 1 month. What can we say about the number? It is reliable, accurate, at any time of trading. Atom Pro Maximum, this indicator showed excellent results in scalping trading. The accuracy of this
Fast rollback
Yaroslav Varankin
can recognize candlestick patterns he also recognizes the lows and highs of the price for a certain time. MTF works on all currency pairs in futures and sulfur, cryptocurrency does not redraw. his work can be seen in the test. you can trade at any time of the day but the preferred trading time during the European American session ----------------------------------------------------------------------------------------------------------------------------------------------------------
Above sea level
Yaroslav Varankin
Multi-timeframe indicator perfectly determines when there will be a rollback from the level ideal for binary options. of correct true signals Forex Stop Loss trading can be dragged behind the line thereby moving the deal to breakeven there is a signal in the indicator. The indicator showed excellent results during testing. Test in the test and make sure it is accurate. For any questions, suggestions, please always communicate with you.
Zero linea
Yaroslav Varankin
multi-timeframe indicator. Ideal for both the Forex market and binary options. Good accuracy of this tool the indicator showed excellent results during testing. test it in a tester and make sure it is accurate.... complete lack of redrawing. You can choose absolutely any instrument. the indicator will provide many profitable and accurate signals. advantages of the indicator: advanced signals. high signal accuracy. frequency of occurrence of signals.
Revolution Martingale Pro indicator for binary options! at the time of opening and the appearance of the signal! Blue diamond is shopping up. A red diamond is an option down. The indicator is already set to trade in binary options. ----------- protection is set against hitting on (steps - martingale knees) protection of several minuses under the row. ------------------------------------------- (Redrawing possible)
필터:
리뷰 없음
리뷰 답변