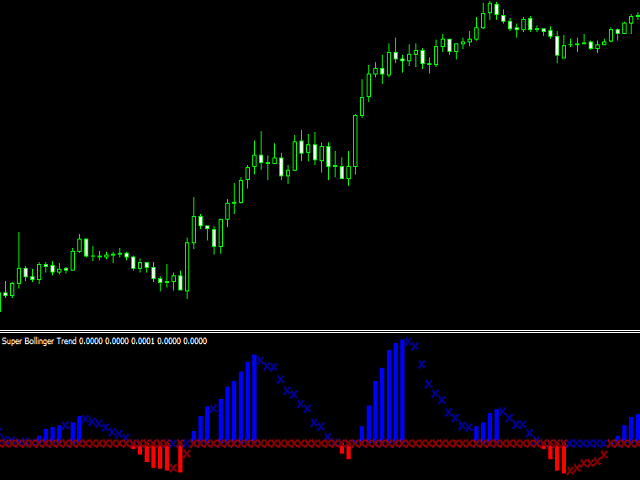
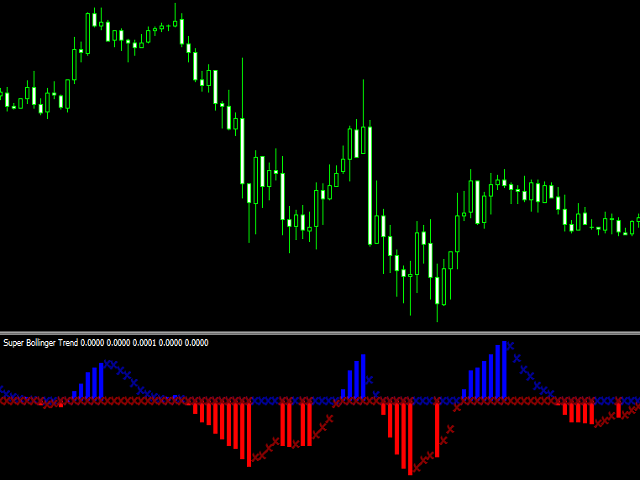
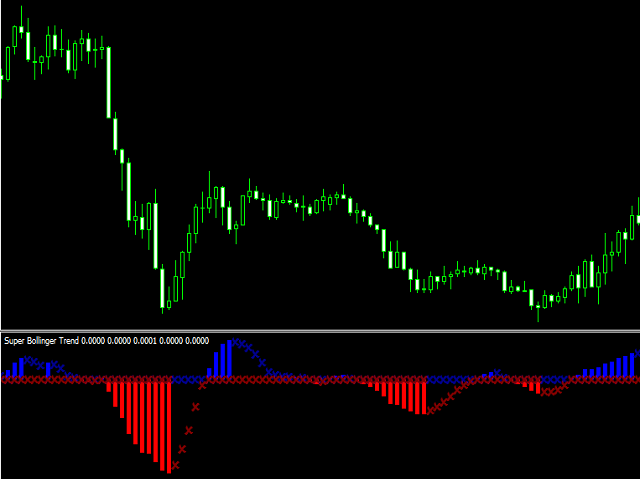
Super Bollinger Trend
- 지표
- 버전: 1.0
- 활성화: 20

Super Bollinger Trend indicator is an oscillator designed to calculate trend points. A set of bollinger bands calculations and a set of algorithms to calculate trend reversals.
Level probing system with high probability trends. All of these features combine to make it easier for investors to find trends.
Prameters
- bollinger_Period - bollinger bands period setting
- bollinger_Deviations - bollinger bands deviations setting