AZ Vwap Dpoc

  • 지표
  • Jose Antonio Valle Magana
    Jose Antonio Valle Magana
    The profession of trader is something I love because once you learn a system, you do not need to be learning and learning new things, but all you have to do is apply the knowledge day by day with more and more discipline. I am an architect by profession and a trader at heart.
  • 버전: 1.43
  • 활성화: 10
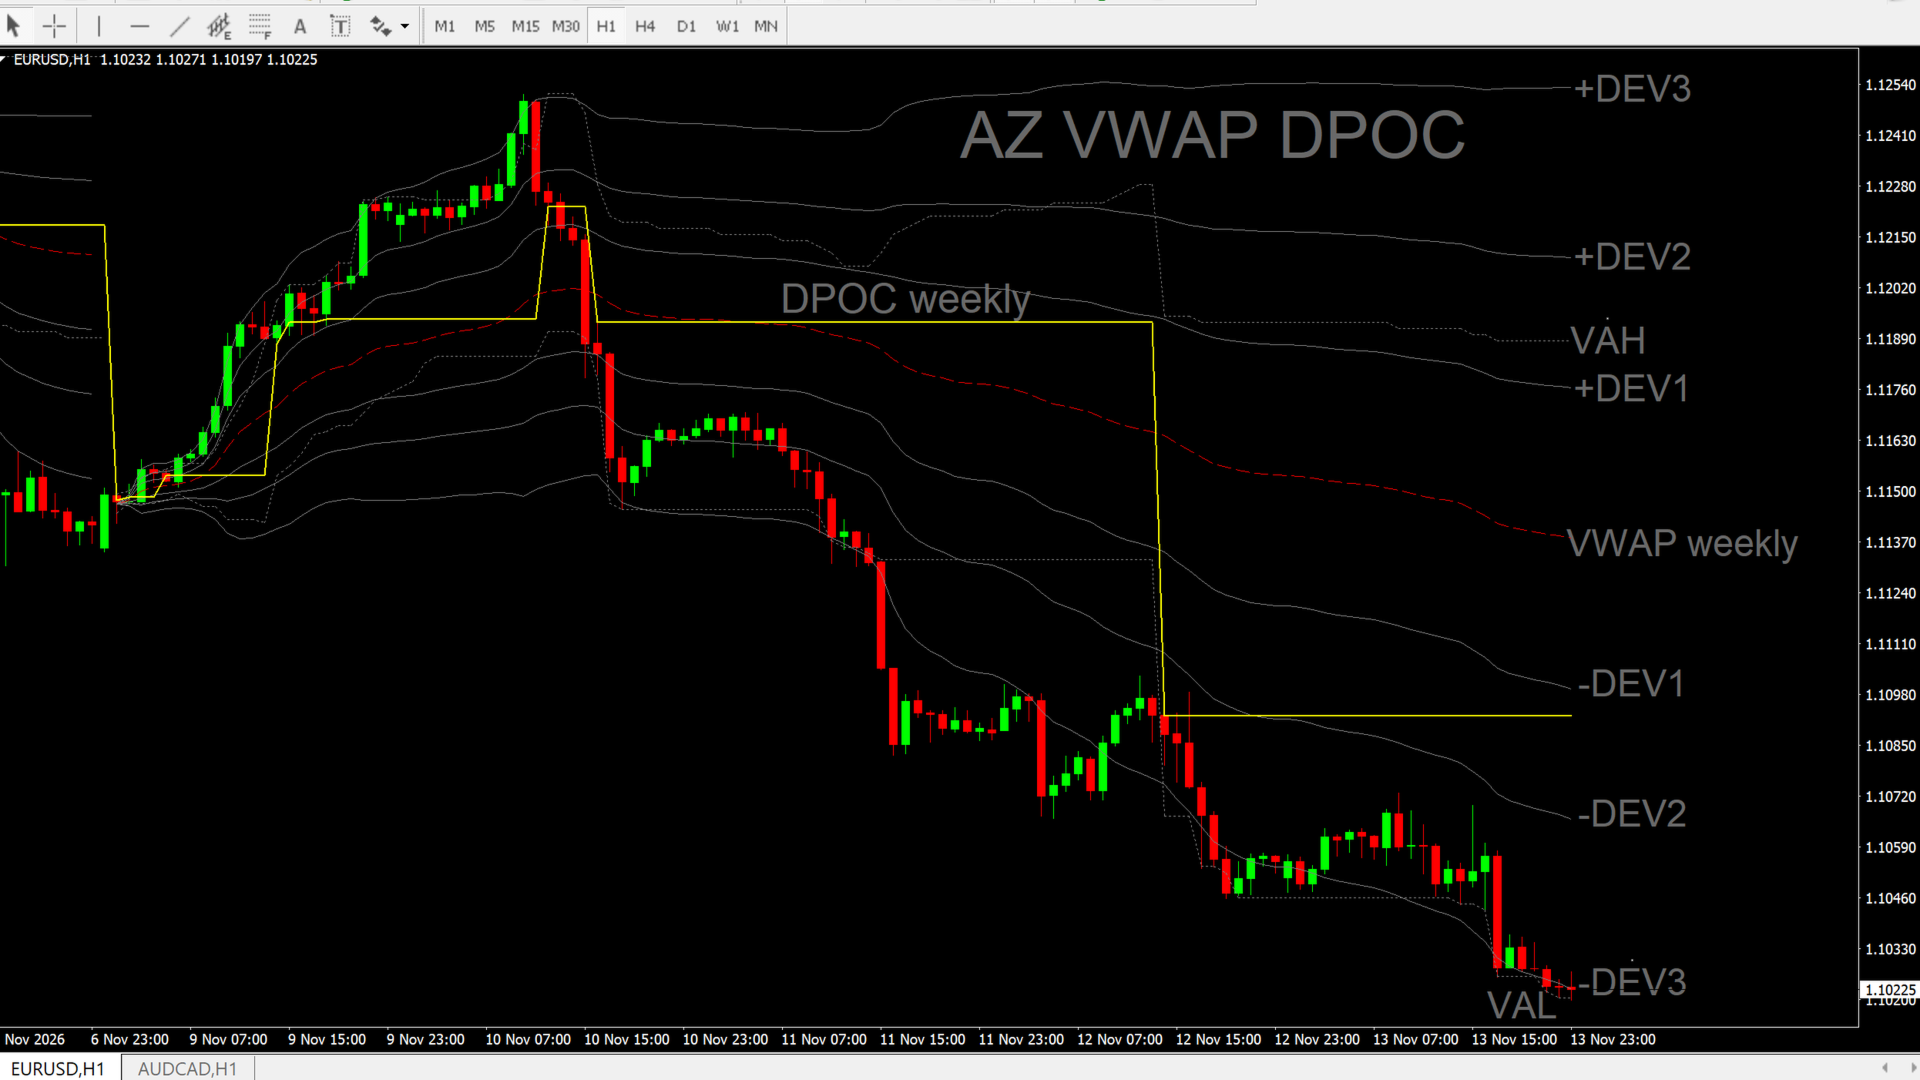
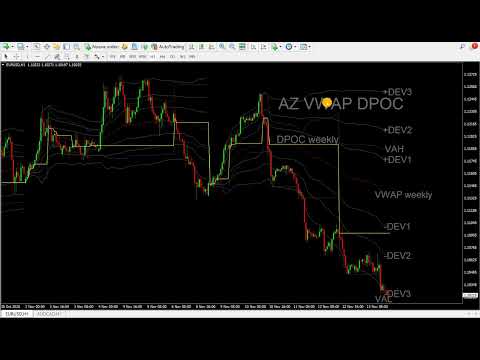
AZ VWAP + DPOC plots a volume-weighted average price (VWAP) with deviation bands, a dynamic DPOC and a dynamic Value Area (VAH / VAL) directly on the MetaTrader 4 chart. It also includes configurable cross alerts.

WHAT YOU GET

VWAP with deviation bands
• VWAP line with three upper and three lower deviation bands (volume-weighted standard deviation).
• Default deviations: 0.6, 1.12 and 1.8. Each one can be changed or hidden (0 = hide).
• Weekly or daily reset, with a configurable session start hour and week start day.
• Choice of price source: typical, close, median or weighted.
• Lines stay continuous between sessions by default, or can be broken at each new period.
• Choose how many VWAP periods to display.

Dynamic DPOC and Value Area
• DPOC (point of control): the price level with the highest volume in the selected period, drawn as a stepped line.
• VAH and VAL: the upper and lower limits of the Value Area, drawn as dotted lines.
• Value Area percentage is adjustable (default 70%).
• Weekly or daily DPOC period, and up to 30 periods can be displayed.
• The volume profile is built from M1 bars. The price step is automatic or can be set in points.

Cross alerts (each one can be switched on or off)
• VWAP line
• Deviation bands (+/- 1, 2 and 3)
• DPOC
• VAH / VAL
• Sound alert and push notification (a MetaQuotes ID is required for push).
• Minimum time between alerts on the same level, to avoid repeated notifications.
• No alert is sent when a new period starts or while the history is loading.

HOW IT WORKS
The VWAP, deviations, DPOC and Value Area are recalculated on every new bar and tick. The DPOC and Value Area are rebuilt from M1 data inside the selected period, so the volume profile adjusts as the period develops.

IMPORTANT NOTES
• The indicator uses the broker's tick volume, not real exchange or futures volume. Values may differ between brokers and from other platforms or data providers.
• The DPOC and Value Area need enough M1 history for the selected period. If the lines look incomplete, open the M1 chart of the symbol first so the terminal downloads the history.
• This is a charting and alert tool. It does not generate trade signals and does not guarantee any result.
• Trading involves risk. Not financial advice.

INPUT PARAMETERS

VWAP
• VWAP period – Daily or Weekly reset.
• VWAP price source – Price used in the calculation.
• Deviation 1 / 2 / 3 – Band multipliers (0 = hide). Defaults: 0.6, 1.12, 1.8.
• VWAP periods to show – Number of periods displayed (0 = all). Default: 5.
• Break VWAP lines between periods – Cut the lines at each new period.

DPOC
• Show DPOC – Show or hide the DPOC.
• DPOC period – Daily or Weekly.
• DPOC periods to show – Number of periods displayed (1–30). Default: 5.
• Show VAH / VAL – Show or hide the Value Area lines.
• Value area percentage – Default 70.
• Profile step in points – 0 = automatic.
• Build the profile from M1 bars – Use M1 data for the profile.
• VAH / VAL color – Color of the Value Area lines.

Alerts
• Sound alert – On/off.
• Push notification – On/off (MetaQuotes ID required).
• Alert on VWAP line cross – On/off.
• Alert on +/- deviation 1, 2 and 3 cross – On/off.
• Alert on DPOC cross – On/off.
• Alert on VAH / VAL cross – On/off.
• Sound file – File in the Sounds folder.
• Minimum seconds between alerts on the same level – Default 60.

Session
• Session start hour (SERVER time) – Default 1.
• Market break hours before session start to exclude – 0 = none.
• Week start day – Monday or Sunday.

Colors of the lines can be changed in the Colors tab of the indicator properties.

Developer: Jose Antonio Valle Magana (valletrading) – AZ Trading Tools.
추천 제품
Max Volume
Maksim Slovakov
Подкрашивает аномально большие тиковые объёмы в красный цвет. Имеет следующие настройки: "Процент" по умолчанию "70"  (Процент на который аномальный объём должен быть больше предыдущего) "Уровень" по умолчанию "500" (Количество тиков, больше которого будем брать во внимание аномальный объём) Внимание! Данный индикатор был разработан для мелких таймфреймов M1,M5,M15. Идея в том, что на таких Таймфреймах увеличение количества тиков говорит об увеличении количество сделок, увеличения интереса к цен
Market Profile
Artem Titarenko
5 (1)
The "Market Profile" indicator displays the profiles and volumes of periods – weekly, daily, session (8-hour), 4-hour, hour, summary. The VAH/VAL price area is automatically highlighted by a dotted line for each profile (except for the summary). The indicator includes chroma Delta, which colors the profile areas. The areas of prevailing Buys is colored in green, that of Sells - in red. The intensity histogram features blue/red respectively. In the filter mode, the indicator displays the volume a
MT4용 Crypto_Forex 지표 "Trend Flat Pro Histogram", 리페인트 없음.   - "Trend Flat Pro Histogram" 지표는 매우 민감하고 일반적인 이동 평균보다 훨씬 효율적입니다. - 현재 시장 상황(플랫, 상승 추세, 하락 추세)을 보여주도록 설계되었습니다. - 지표는 세 가지 색상으로 표시됩니다. 플랫 시장 상황은 노란색, 하락 추세는 빨간색, 상승 추세는 녹색입니다(색상은 설정에서 변경 가능). - 모바일 및 PC 알림 기능 제공. - 이 지표는 가격 변동, 스캘핑, 모멘텀 트레이딩 등 다른 거래 방식과 결합하면 유용합니다. - 지표에 정보 표시 기능이 있어, 지표가 연결된 외환 통화쌍의 현재 스프레드와 스왑을 표시합니다. - 계좌 잔액, 자본금, 증거금도 표시됩니다. - 차트의 어느 곳에서나 정보 표시를 찾을 수 있습니다. Click here to see high quality Trading Robots and Indicators!
Accumulation Basic
Thanh Quang Huynh
Accumulation/Distribution Technical Indicator is determined by the changes in price and volume. The volume acts as a weighting coefficient at the change of price – the higher the coefficient (the volume) is, the greater the contribution of the price change (for this period of time) will be in the value of the indicator. In fact, this indicator is a variant of the more commonly used indicator   On Balance Volume . They are both used to confirm price changes by means of measuring the respective vo
Scorpion Scalper Pro
Mohamed Amine Talbi
In the age of speed, everyone wants to gets what he/she wants quickly. Trading is all about gaining money, and scalping is a way of doing it in a short time. The "Scorpion Scalper Pro" has been named on the scorpion because of its speed. The indicator serves to provide signals for the M15 timeframe. It also sends Alerts (window alert, email alert, push notification alert) whenever a buy/sell signal occurs, and the alerts are customizable (they can be turned ON or OFF). Indicator inputs : - Buy
작성자의 메시지 저는 9년 이상 외환 시장에서 거래해 왔으며, 전업 트레이더 로 활동하고 있습니다. 오랜 트레이딩 경험을 통해 제가 강하게 느낀 점은, 트레이딩에서 가장 큰 과제는 전략 자체가 아니라 올바른 통화 페어를 선택하는 것 이라는 사실입니다. 아무리 완성도가 높은 전략이라도 잘못된 시장이나 통화 페어에 적용하면 그 효과는 크게 저하됩니다. 반대로, 적절한 통화 페어를 선택할 수 있다면 많은 전략은 자연스럽게 본래의 성과를 발휘합니다. 이러한 생각을 바탕으로 개발한 것이 Currency Strength Index – Advanced Version 입니다. 저의 경험상 통화의 강약은 추세 트레이딩의 기반 입니다. 완전한 일간 사이클( 1440분 ) 동안 시장의 관심이 가장 강한 통화와 가장 약한 통화에 집중될 경우, 이러한 강약의 편차는 단기간에 해소되지 않고 지속되는 경향이 있습니다. 많은 추세 전략이 효과를 발휘하는 이유는 진입 로직 때문만이 아니라, 이미 시장을 지배
Market Profile Osw MT4
William Oswaldo Mayorga Urduy
사용자 매뉴얼: Market Profile Osw Market Profile Osw는 특정 기간 동안의 거래량 및 가격 분포를 시각화할 수 있는 고급 경매 분석 도구입니다. 기존의 캔들 차트와 달리, 이 시스템은 가장 활발한 거래가 발생한 위치를 보여주어 실제 시장 참여를 기반으로 한 심리적 지지 및 저항 영역을 식별할 수 있게 해줍니다. 1. 매개변수 가이드 (입력 메뉴) 일반 설정 Show Market Profile: 차트에서 프로필 표시를 활성화 또는 비활성화합니다. Volume Type: 가격 변동 횟수(Tick) 또는 실제 거래량(특정 브로커 및 자산에서 사용 가능) 중 활동 측정 방법을 선택할 수 있습니다. Look Back Bars: 지표가 현재 프로필을 생성하기 위해 소급할 캔들 개수를 정의합니다. Profile Right Side: 프로필을 가격축 옆(오른쪽)에 그릴지 아니면 분석 기간의 시작점(왼쪽)에 그릴지 결정합니다. Seconds Refresh: 지표가 데
Master Volume profile
Israr Hussain Shah
Money Flow Profile MT5 HERE   Here   our more valuable tools SMC Trend Trading   ,  Easy SMC Trading  ,  Institutional SMC Architect Volume Analysis Tools  ,  Volume flow Profile  ,  Market volume profile  , FVG with Volume  , Liquidity Heatmap Profile  ,  Volume Spread Analysis This Master Edition is engineered for clarity and speed, featuring a unique Auto-Theme Sync system that instantly beautifies your chart layout upon loading. Key Features: True Money Flow Calculation: Goes beyond stand
A technical indicator that calculates its readings on trading volumes. In the form of a histogram, it shows the accumulation of the strength of the movement of the trading instrument. It has independent calculation systems for bullish and bearish directions. Works on any trading instruments and time frames. Can complement any trading system. The indicator does not redraw its values, the signals appear on the current candle. It is easy to use and does not load the chart, does not require addition
MR Volume POC Levels 4
Sergey Khramchenkov
5 (3)
The most important price level in any "Volume profile" is the "Point of Control" . This is the price level with the highest trading volume. It is primarily the level where large players initiate their positions, making it the accumulation/distribution level for the "Smart money" . The idea of the indicator arose after the "MR Volume Profile 4" indicator was made. When creating the "MR Volume Profile 4" indicator, we spent a lot of time comparing the volumes with those from the volume profile in
Check My Other Products Contact me to discover all my services  This indicator is very useful to have a better understanding of the current trend. With the integration of a trend color cloud it makes it easy to see the price trend immediately on the eye and this allows the trader to make more accurate assessments. I have been using this indicator for years and I must say that it greatly limits chart errors and trades against the trend
VWAP Band Fills with Anchored VWAP MT4는 TradingView의 VWAP를 MetaTrader 4로 가져옵니다. TradingView의 내장 "VWAP"를 사용하신다면 여기에서도 같은 입력값(Anchor Period, Source, Offset, Bands Calculation Mode, Bands Multiplier #1 to #3, Hide VWAP on 1D or Above), 같은 공식(Pine ta.vwap), 같은 색을 보실 수 있습니다. 여기에 더해, 수직선을 끌어다 놓은 곳에서 시작하는 앵커드 VWAP(Anchored VWAP)도 있습니다. 공식 각 앵커 기간 안에서 봉마다: VWAP = sum(source x 틱 거래량) / sum(틱 거래량) 편차 = sqrt( sum(틱 거래량 x source^2) / sum(틱 거래량) - VWAP^2 ) Band #n = VWAP +/- 편차 x 배수 #n (Percentage 모드: VWAP
FREE
VWAP Volume Price Customized Cycle FX-AIEA — Multi-Timeframe Anchored VWAP Indicator (Technical Features & Parameter Discussion) Overview This indicator extends the traditional VWAP (Volume Weighted Average Price) with multi-timeframe anchoring and customizable session reset mechanisms, aiming to provide a dynamic "fair value" reference area. The indicator constructs symmetric volatility boundaries via triple standard deviation channels (±1σ/±2σ/±3σ), which can serve as reference dynamic support
Titan Z-Score Pro v3.2 Sürüm Notları: Kurumsal UI/UX Yeniden Tasarımı: Performans kokpitleri ve MTF matrisleri ana harita köşelerine taşındı, böylece tertemiz, dağınıklıktan arındırılmış bir alt pencere görünümü sağlandı. Canlı Kazanma Oranı ve Geri Dönüş Kokpiti: Ortalama geri dönüş başarı oranının ve kazanılan ortalama piplerin gerçek zamanlı takibi eklendi. Çok Zaman Dilimi Z-Puan Matrisi: Ana tabloya doğrudan görsel olarak 5 zaman dilimli (M5'ten D1'e) bir durum ızgarası entegre edildi. Yeni
볼륨 프로파일 스나이퍼 11.1 은 포괄적 인 시장 분석 도구입니다 거래에 대한 전문적인 접근 방식 볼륨 프로파일 스나이퍼 11.1 은 시장 상황의 포괄적 인 평가를 기반으로 명확한 신호를 제공,하나의 지표에 15 개 이상의 키 필터를 결합합니다. 주요 특징 볼륨 불균형 분석-알고리즘은 각 촛불에서 구매자와 판매자의 점유율을 계산하여 당사자 중 한 사람의 우위를 나타냅니다(구성 가능한 임계 값은 50%에서 90%까지). 다단계 신호 필터링-표시기가 고려됩니다: 2015 년 11 월 1 일 과매수/과매도 영역을 제외한 캔들 패턴(핀 바,흡수,망치) 지원/저항 레벨(자동 감지) 주요 플레이어의 활동을 식별하는 볼륨 스파이크 고전적이고 증폭 된 발산 변동성 평가 트렌드 강도를 결정하기 위한 애드엑스 가격 조치(내부 및 외부 막대) 다중 기간 확인 시장 구조(높은 최고/낮은 최저) 세션 필터(아시아,런던,뉴욕 세션) 뉴스 배출으로부터 보호 유연한 구성 시스템-
하루 또는 세션마다 볼륨 프로파일을 그려 거래량이 어느 가격에서 발생했는지를 하루하루 보여 주며, 각 프로파일의 POC, 밸류 에어리어 고점과 밸류 에어리어 저점 , 그리고 시장이 아직 다시 찾아가지 않은 네이키드 POC 를 날짜와 가격과 함께 오른쪽 끝까지 표시합니다. 모든 타임프레임에서 일분봉으로 계산하므로 M5에서도 H4에서도 레벨이 같고, 끝난 날의 레벨은 움직이지 않습니다. 그리는 내용 일별 프로파일 , 또는 거래 세션별 프로파일을 기본값으로 최근 10개 그립니다 ("Profiles drawn on the chart"): 가격별 거래량은 캔들 뒤의 히스토그램으로, 밸류 에어리어는 불씨 색으로, 나머지는 차분한 회색으로 표시합니다. POC (포인트 오브 컨트롤, 거래량이 가장 많이 발생한 가격)는 실선으로, 밸류 에어리어 고점과 저점 은 점선으로 그립니다. 네이키드 POC : 끝난 날의 POC 중 이후 어느 봉도 터치하지 않은 것은 날짜와 가격과 함께 오른쪽 끝까지 계속 그려
FREE
Reverse side scalper is the manual trading system, that works on choppy(anti-trend) market. As a rule markets are on 80% choppy and only 20% is trend phase. System is based on custom step Moving and RSI and reverse pattern. System defines up movement, down movement, trend / choppy phases. Indicator plots Buy signal arrow when current direction is down and phase is trend, Sell signal arrow is plotted when currently is up movement and phase is trend. As a rule it allows to "catch" local maximum/mi
MR Volume Profile 4
Sergey Khramchenkov
The "MR Volume Profile 4" indicator is a charting tool that displays trading volume at different price levels rather than time intervals. A key concept in volume profile is the point of control (POC)—the price level with the highest volume traded during the session or time range. While tools like VWAP or OBV provide volume trends, the "MR Volume Profile 4" indicator offers granular detail about where the most market activity occurs at specific price levels. This makes it a more precise tool for
AurumEdge Trend Compass MT4
Anthony Nwabueze Onyenweaku
스윙 고점과 저점(HH, HL, LH, LL)에 라벨을 붙이고, 구조 돌파와 성격 전환을 표시하며, 상위 시간 프레임의 추세를 보여줍니다. 리페인트 없음. AurumEdge Trend Compass MT4는 시장 구조를 대신 읽어 주어, 시장이 고점과 저점을 높이고 있는지 낮추고 있는지 한눈에 볼 수 있게 합니다. 표시 내용 - 스윙 라벨: HH(더 높은 고점), HL(더 높은 저점), LH(더 낮은 고점), LL(더 낮은 저점) - BOS(구조 돌파): 가격이 추세 방향으로 직전 스윙을 넘어 마감하여 추세가 이어짐 - CHoCH(성격 전환): 가격이 추세와 반대로 스윙을 넘어 마감한 것으로, 추세가 바뀔 수 있다는 첫 신호 - 차트와 상위 시간 프레임(기본값 H4)의 구조를 보여주는 코너 패널. 둘 다 상승에 일치하면 초록, 둘 다 하락에 일치하면 빨강, 서로 다르면 금색. 리페인트 없음 스윙은 이를 확정하는 캔들이 마감된 뒤에만 라벨이 붙고, BOS / CHoCH는 돌파
Anchored VWAP with Alert
Trade The Volume Waves Single Member P.C.
5 (4)
What is the Volume Weighted Average Price (VWAP)? The volume weighted average price (VWAP) is a trading benchmark used by traders that gives the average price an instrument has traded at throughout the day, based on both volume and price.  It is important because it provides traders with insight into both the trend and value of the instrument. What is the Difference between VWAP and AVWAP? While VWAP is having as starting point the beggining of the day,week,month etc. in the AVWAP you can plac
The Smart Liquidation Clusters  is a custom technical indicator designed for the MetaTrader 4 (MT4) platform. It calculates and visualizes   estimated liquidation zones   based on price action and internal algorithms, displaying them as a dynamic heatmap on the chart. These zones are known by several names, sometimes referred to as liquidity pools, liquidity levels, leverage levels, liquidation heatmap levels, leverage heatmap zones, or leverage heatmap levels. These zones represent   potential
Malik Naveed Volume — Better Volume Multi Timeframe Malik Naveed Volume shows you what the volume is really doing. It reads each candle's volume and price range, splits it into buying vs selling pressure, and colours the bars so you can instantly see climax moves, absorption (churn), and low-volume exhaustion. It then draws support/resistance levels from those key bars and alerts you when price breaks and retests them — across six timeframes at once, on any symbol. Works on ANY symbol and ANY
FREE
Flat Reminder
Chi Sum Poon
Flat Reminder Overview Flat Reminder is a powerful technical analysis tool that identifies and highlights price consolidation zones on your chart. It detects when price action slows down and moves sideways, indicating potential reversal points, continuation setups, or key decision zones in the market. Key Features Consolidation Detection : Automatically identifies flat price zones where market momentum decreases Range Measurement : Calculates and displays the exact range of each consolidation in
FREE
ADX Shark Scalper
Maxwell Ndzoyiya
ADX Shark Scalper – The Ultimate Hybrid Indicator for Precision Scalping Dive into the markets with the ADX Shark Scalper , a powerful and versatile tool designed for traders who seek precision in every trade. This cutting-edge indicator seamlessly combines multiple advanced technical signals into one streamlined system, allowing you to spot good buy and sell opportunities with ease. At its core, the ADX Shark Scalper leverages the power of trend and momentum detection through the integration of
The brand new trading indicator using the box breakout strategy is presented by KING.Ai. This indicator with four-mode alerts is developed by KING.Ai ONLY. It is probably impossible that you could find a box breakout indicator like this one. It is very difficult for you to trade with the box breakout strategy as there is limited time for traders to monitor every currency. However, the box breakout strategy is very profitable. It is because when the price breaks the box, the trend will go further
Product Overview Multi Dimensional Bottom Finder is an advanced sub-window oscillator and multi-dimensional resonance indicator designed specifically for both   MT4 and MT5   platforms. Breaking through the limitations of traditional single KDJ or RSI indicators, it constructs a highly in-depth bottom-hunting system by integrating multi-period stochastic oscillator algorithms, CCI extreme value analysis, volume anomaly detection, and bias rate recovery models. This indicator keenly captures mom
Weis Wave Indicator
Dhabaleswar Prasad Jena
This indicator is based on the Weis wave principle of wave volume. Below are few features of the indicator It draws the wave on the chart while the accumulated volume per wave in a different window at the bottom of the chart You can configure the turning point move It displays the accumulated volume (in thousands, eg for 15000 volume it will show 15) at the end of each wave You can also configure to show number of candles in the wave along with the wave volume The indicator calculates the distin
Adjustable Consecutive Fractals  looks for 2 or more fractals in one direction and sends out a on screen alert, sound alert and push notification, for strong reversal points . Adjustable Consecutive Fractals, shows the fractals on chart along with a color changing text for buy and sell signals when one or more fractals appear on one side of price. Adjustable Consecutive Fractals is based Bill Williams Fractals . The standard Bill Williams fractals are set at a non adjustable 5 bars, BUT withe th
Time Bubble
Ahmed Mohamed
Time Bubble ***Specialized for GBPJPY 1H time frame*** (tested for two years with success rates about 82%) Time Circle's smart algorithm detects the price circles with time . give strong signals at the right time as result of combine the price and time. our team spent months to develop this indicator specially for GBPJPY ..with high success rates about 82% win trades over two years .tested from December 2016 to November 2018. *** in last two years total signals 1012 with 829 Wins and 183 Lo
CyberZingFx Volume Plus
Afsal Meerankutty
4.94 (17)
Advanced version of CyberZingFx Volume Indicator, the ultimate MT4 indicator for traders seeking highly accurate buy and sell reversal signals. With an additional strategy and price action dot signals that enhances its effectiveness, this indicator offers a superior trading experience for professionals and beginners alike. The CyberZingFx Volume Plus Advanced version combines the power of volume analysis and historical price data with an additional strategy, resulting in even more precise and re
이 제품의 구매자들이 또한 구매함
Trend SniperX MT4
Sarvarbek Abduvoxobov
5 (5)
Trend Sniper X 는 트레이더가 명확하고 정확하게 트렌드 방향과 잠재적 반전 지점을 포착할 수 있도록 돕는 MetaTrader 5 전용 멀티 타임프레임 추세 추종 지표입니다. MT5 버전 링크: https://www.mql5.com/en/market/product/181101 가격 안내: 현재 가격은 프로모션 할인가이며, 향후 업데이트 및 새 기능 출시 시 인상될 수 있습니다. Code2Profit 채널 멀티 타임프레임 분석으로 시장을 정복하세요! Trend Sniper X로 승률을 극대화하는 방법: 핵심 규칙 및 세션 팁 기술 사양 플랫폼 MetaTrader 5 지표 유형 멀티 타임프레임 추세 지표 작동 타임프레임 모든 차트 타임프레임 (상위 타임프레임 M1–MN1 독립 선택 가능) 주요 종목 외환(Forex), 골드(XAUUSD) 및 기타 CFD 추천 계좌 모든 계좌 유형 시각화 컬러 추세 캔들 (매수/매도/약세/변화) + 매수/매도 화살표 추가 모듈 세션 마켓 박스 (
Currency Strength Wizard
Oleg Rodin
4.85 (61)
통화 강도 마법사는 성공적인 거래를 위한 올인원 솔루션을 제공하는 매우 강력한 지표입니다. 표시기는 여러 시간 프레임의 모든 통화 데이터를 사용하여 이 또는 해당 외환 쌍의 힘을 계산합니다. 이 데이터는 특정 통화의 힘을 확인하는 데 사용할 수 있는 사용하기 쉬운 통화 지수 및 통화 전력선의 형태로 표시됩니다. 필요한 것은 거래하려는 차트에 표시기를 부착하는 것뿐입니다. 표시기는 거래하는 통화의 실제 강세를 보여줍니다. 지표는 또한 추세와 거래할 때 유리하게 사용할 수 있는 구매 및 판매 거래량 압력의 극한값을 보여줍니다. 지표는 또한 피보나치에 기반한 가능한 대상을 보여줍니다. 표시기는 PUSH 알림을 포함한 모든 유형의 알림을 제공합니다. 구매 후 연락주세요. 나는 당신과 거래 팁을 공유하고 당신에게 무료로 훌륭한 보너스 지표를 줄 것입니다! 나는 당신에게 행복하고 유익한 거래를 기원합니다!
Scalper Vault
Oleg Rodin
5 (40)
Scalper Vault는 당일 매매(intraday trading)에서 일관된 성과를 내고자 하는 트레이더를 위해 설계된, 강력하고 모든 기능을 갖춘 트레이딩 시스템입니다. 이 고정밀 지표는 외환(Forex) 및 바이너리 옵션 트레이더 모두에게 기관급 분석을 제공하는 독립적인 종합 트레이딩 시스템 역할을 합니다. 구매 후 저에게 연락해 주시면, 트레이딩 팁과 함께 특별한 보너스를 제공해 드립니다! Scalper Vault는 추측에 의존하거나 복잡한 수동 분석을 할 필요를 없애주며, 사용하기 쉬운 트레이딩 기법을 통해 오직 매매 실행에만 집중할 수 있도록 돕습니다. 정확한 추세 추종 신호: 핵심 알고리즘이 시장 구조를 분석하여, 지배적인 시장 추세 방향과 일치하는 고확률 신호만을 제공함으로써 잘못된 진입을 획기적으로 줄여줍니다. 정밀한 고점 및 저점 탐지: 시장의 움직임이 소진되는 지점을 스캔하여 잠재적인 반전 구간을 식별합니다. 간(Gann) 이론 기반의 매수/매도 구간: 수학적
현재 30% 할인 ! 초보자 또는 전문가 트레이더를 위한 최고의 솔루션! 이 대시보드 소프트웨어는 28개의 통화 쌍에서 작동합니다. 2가지 주요 지표(Advanced Currency Strength 28 및 Advanced Currency Impulse)를 기반으로 합니다. 전체 Forex 시장에 대한 훌륭한 개요를 제공합니다. 고급 통화 강도 값, 통화 이동 속도 및 모든(9) 시간대의 28 Forex 쌍에 대한 신호를 보여줍니다. 추세 및/또는 스캘핑 기회를 정확히 파악하기 위해 차트의 단일 지표를 사용하여 전체 시장을 볼 수 있을 때 거래가 어떻게 개선될지 상상해 보십시오! 잠재적인 거래를 식별하고 확인하면서 강력한 통화와 약한 통화를 더욱 쉽게 식별할 수 있도록 이 지표에 기능을 내장했습니다. 이 표시기는 통화의 강세 또는 약세가 증가 또는 감소하는지 여부와 모든 시간대에서 수행되는 방식을 그래픽으로 보여줍니다. 추가된 새로운 기능은 현재 시장 조건 변화에 적응하는
Trend Lines PRO
Roman Podpora
5 (2)
트렌드 라인즈 프로       이 지표는 시장이 실제로 어떤 방향으로 전환되는지 파악하는 데 도움이 됩니다. 실제 추세 반전 지점과 주요 시장 참여자들이 다시 진입하는 지점을 보여줍니다. 보시다시피       BOS 라인       복잡한 설정이나 불필요한 노이즈 없이 더 높은 시간대의 추세 변화와 주요 레벨을 확인할 수 있습니다. 신호는 차트에 다시 그려지지 않고 캔들이 마감된 후에도 계속 표시됩니다. VERSION MT 5   -   RFI LEVELS PRO   표시기   와 결합할 때 최대 잠재력을 발휘합니다. 지표가 보여주는 내용: 실제 변화       추세(BOS 라인) 한 번 신호가 나타나면 그 신호는 계속 유효합니다! 이는 신호를 발생시킨 후 변경될 수 있는 리페인팅 방식의 지표와 중요한 차이점입니다. 리페인팅 방식의 지표는 잠재적으로 자금 손실로 이어질 수 있습니다. 이제 더욱 높은 확률과 정확도로 시장에 진입할 수 있습니다. 또한 화살표가 나타난 후 목표가(익절)
AW Prime Oscillator
AW Trading Software Limited
5 (1)
두 개의 오실레이터의 조합. 첫 번째 항목은 진입점을 표시하고 두 번째 항목은 현재 추세를 표시합니다. 표시기는 두 가지 모드의 화살표로 오실레이터 신호를 표시할 수 있습니다. 모든 빠른 오실레이터 신호 또는 현재 추세 방향의 신호만 표시할 수 있습니다. 다중 시간대 패널과 세 가지 유형의 신호 알림이 있습니다. 이익: 일일 및 스캘핑 거래에 적합 추세 필터링 간단하고 민감한 설정 다중 시간대 패널 Advisor에 통합하는 데 적합합니다. 모든 기호 및 기간에서 작동합니다. 세 가지 유형의 알림 MT5 version ->  HERE  / Problem solving ->  HERE 지표 전략 표시기는 두 개의 서로 다른 오실레이터로 구성됩니다. 느린 추세선(두꺼움) - 지표의 고수준이 위에서 아래로 교차하면 하락세 지표이고, 낮은 수평 수준(지표의 낮은 수준)이 아래에서 위로 교차하면 하락 추세 지표입니다. 상승 경향. 또한, 하단 영역에서 느린 선을 발견하면 현재 추세가 하락세임을
SR Liquidity
Oleg Rodin
5 (2)
SR Liquidity 는 시장 유동성이 집중되고 가격이 가장 강력하게 반응하는 숨겨진 구간을 포착하도록 설계된 트레이딩 지표입니다. 이러한 특수 유동성 구간은 강력한 지지 및 저항선 역할을 하며, 시장 반전 가능성이 가장 높은 지점을 명확하게 보여주는 지도가 되어 줍니다. SR Liquidity는 일반적인 지지 및 저항선을 단순히 그리는 대신, 실제 가격 움직임을 분석하여 매수 및 매도 압력이 집중되는 구간을 포착합니다. 이러한 구간은 실질적인 시장의 흐름을 주도하는 유동성 풀(liquidity pools)에 해당합니다. 이 지표는 해당 구간을 차트에 직접 시각화하여, 가격 반응이 실제로 나타나기 전에 이를 미리 예측할 수 있도록 돕습니다. 즉, 가격 추세가 전환될 가능성을 사전에 파악하게 해주는 것입니다. 결과적으로 이 지표는 가공되지 않은 가격 움직임(price action)을 시장의 핵심 가격대, 다시 말해 추세 전환점이 될 수 있는 지점들을 보여주는 명확하고 실용적인 로드맵
PRO Renko System
Oleg Rodin
5 (31)
PRO Renko System 은 RENKO 차트 거래를 위해 특별히 고안된 매우 정확한 거래 시스템입니다. 이것은 다양한 거래 상품에 적용될 수있는 보편적 인 시스템입니다. 체계는 효과적으로 당신에게 정확한 반전 신호에 접근을 주는 소위 시장 소음을 중화합니다. 이 표시기는 사용하기가 매우 쉽고 신호 생성을 담당하는 매개 변수가 하나만 있습니다. 당신은 쉽게 당신의 선택의 어떤 무역 계기에 공구를 적응시킬 수 있고 renko 막대기의 크기. 나는 항상 당신이 내 소프트웨어로 수익성있게 거래 할 수 있도록 추가 지원을 제공 할 준비가되어 있습니다! 나는 당신에게 행복하고 수익성있는 거래를 기원합니다! 구매 후 저에게 연락하십시오! 내 렌코 차트 생성기를 보내드립니다. 또한 내 개인 권장 사항 및 시스템의 다른 모듈을 무료로 공유 할 것입니다!
PZ Turning Points MT4
PZ TRADING SLU
1 (1)
Identify key turning points with reliable fractal analysis This indicator examines the price structure of fractals of different periods to determine possible reversal points in the market, providing timing to positional traders that already have a fundamental or technical valuation model. Unlike its younger brother, Reversal Fractals , this indicator won't miss reversals because of the period selected, and will find reversal fractals on a zig-zag fashion, ignoring those reversals which do not
M1 Sniper
Oleg Rodin
4.97 (30)
M1 SNIPER 는 사용하기 쉬운 거래 지표 시스템입니다. M1 시간대에 맞춰 설계된 화살표 지표입니다. 이 지표는 M1 시간대 스캘핑을 위한 단독 시스템으로 사용할 수 있으며, 기존 거래 시스템의 일부로도 사용할 수 있습니다. 이 거래 시스템은 M1 시간대 거래용으로 특별히 설계되었지만, 다른 시간대에도 사용할 수 있습니다. 원래는 XAUUSD와 BTCUSD 거래를 위해 이 방법을 설계했지만, 다른 시장 거래에도 유용하다는 것을 알게 되었습니다. 이 지표의 신호는 추세 방향과 반대로 거래될 수 있습니다. 저는 지표의 신호를 활용하여 양방향으로 거래할 수 있도록 돕는 특별한 거래 기법을 알려드립니다. 이 방법은 특별한 동적 지지선과 저항선 가격 영역을 활용하는 것을 기반으로 합니다. 구매하시면 M1 SNIPER 화살표 지표를 바로 다운로드하실 수 있습니다. 또한, 아래 스크린샷에 표시된 Apollo Dynamic SR 지표는 M1 SNIPER 도구를 사용하는 모든 사용자에게 무료로
RFI levels PRO
Roman Podpora
5 (1)
이 지표는 추세 반전 지점과 가격 반등 영역을 정확하게 보여줍니다.       주요 투자자들   . 새로운 트렌드가 형성되는 곳을 파악하고 최대한 정확하게 의사결정을 내리며 모든 거래를 완벽하게 통제합니다. TREND LINES PRO   지표와 함께 사용할 때 최대의 잠재력을 발휘합니다.  VERSION MT5 지표가 보여주는 내용: 새로운 추세의 시작 시 활성화되는 반전 구조 및 반전 수준. 최소한의 위험 대비 수익률을 갖는 이익 실현   (TAKE PROFIT)   및   손절매(STOP LOSS)   레벨 표시       RR 1:2   . 지능형 손실 감소 로직이 적용된 손절매 기능. 지정된 지표에서 두 가지 추세 유형에 대한 반전 패턴을 표시합니다. 지표: 트렌드를 따라   트렌드 라인 프로   (글로벌 트렌드 변화) 트렌드 프로   (빠른 트렌드 변화) 간단하고 효과적입니다       스캐너       실시간 추세 (신규). 다중 시간 프레임 도구 필터링. 표시하다  
Neo Wave PRO
Nikolay Raykov
5 (1)
Price & Time Market Structure Indicator A professional market structure tool that analyzes waves through both price and time — not price alone. Main Description NeoWave PRO is a professional market structure indicator for MetaTrader 4 designed for traders who want to move beyond traditional one-dimensional wave tools such as ZigZag, swing indicators, and basic high/low systems. Most wave indicators analyze only one thing: Price. But a real market wave is not only a price movement. A true wave de
Non repaint MT4
Yan Zhen Du
5 (1)
This is a professional chart indicator designed for traders focused on stability and clear price action. It helps filter market noise and provides clear visual entry and exit zones for your trading decisions. Core Features: Strictly Non-Repainting: The system is built with strict non-repaint logic. What you see on the chart is the true historical performance. Confirmed Signals: Signals are triggered and confirmed only after the candle closes . Once a trading arrow appears on a closed candle, it
Gann Time Clusters
Martin Eshleman
2.5 (2)
Gann Time Clusters Indicator This indicator is based on W. D. Gann's Square of 9 method for the time axis. It uses past market reversal points and applies the mathematical formula for Gann's Square of 9 and then makes projections into the future. A date/time where future projections line up is called a 'time cluster'. These time clusters are drawn as vertical lines on the right side of the chart where the market has not advanced to yet. A time cluster will result in a market reversal point (ex.
Route Lines Prices
Vitalyi Belyh
3 (1)
Route Lines Prices - 은 가격 방향을 찾는 데 사용되는 지표입니다. 간단한 인터페이스에는 가격 움직임 및 미래 방향 계산을 위한 다양한 알고리즘이 포함되어 있습니다. 이러한 알고리즘에는 사용된 시간대에 따른 변동성 계산 및 가격 평활화 기능이 있습니다. 이 지표는 " Calculating price values " 값을 변경하는 단일 매개변수를 제공합니다. 기본값인 1은 균형 잡힌 자동 계산을 제공하며, 별도의 설정 없이 바로 사용할 수 있습니다. 2에서 500 사이의 값을 수동으로 변경하여 자신만의 거래 시스템에 맞게 지표를 맞춤 설정할 수 있습니다. 이 지표는 M1부터 H4까지의 시간대에서 사용을 권장합니다. 모든 거래 상품에 적용 가능합니다. 신호 화살표는 캔들 종가에 생성되며, 과거 차트에는 다시 그려지지 않습니다. 메인 차트에 동일한 화살표가 표시됩니다. 다양한 유형의 알림을 사용할 수 있으며, 내장된 라인 궤적 카운터는 종가를 기반으로 작동합니다. 이는
CRT Candle Range Theory HTF MT4 - Ultimate CRT Indicator: 고급 ICT 개념 및 Malaysian SnR 트레이딩 시스템 가장 진보된 Candle Range Theory 지표로 마켓 메이커의 발자취를 마스터하십시오. Ultimate CRT Indicator를 사용하여 Smart Money Concepts(SMC)의 진정한 힘을 발휘하고 기관처럼 정확하게 거래하십시오. 진지한 트레이더를 위해 독점적으로 제작된 이 지표는 ICT Concepts(Inner Circle Trader)의 핵심 기둥인 매우 효과적인 Candle Range Theory(CRT)를 자동화하고 Malaysian Support and Resistance(SnR) 진입 방법과 FVG(Imbalance) 영역의 치명적인 정밀도로 이를 강화합니다. MT4 또는 MT5에서 Forex, Crypto 또는 지수를 거래하든 이 알고리즘은 시장 소음을 제거하고 가짜 돌파(fakeout)
Advanced Supply Demand
Bernhard Schweigert
4.91 (302)
현재 30% 할인! 초보자나 전문 트레이더를 위한 최고의 솔루션! 이 보조지표는 우리가 다수의 독창적 기능과 새로운 공식을 통합한 독특하고 고품질이며 저렴한 거래 도구입니다. 이 업데이트를 통해 이중 시간대를 표시할 수 있습니다. 더 높은 TF를 표시할 수 있을 뿐만 아니라 차트 TF와 더 높은 TF 모두를 표시할 수 있습니다: 중첩 영역 표시. 모든 Supply Demand 트레이더들이 좋아할 것입니다. :) 중요한 정보 공개 Advanced Supply Demand의 잠재력을 극대화하려면 다음을 방문하십시오. https://www.mql5.com/ko/blogs/post/720245   진입 또는 목표의 명확한 트리거 포인트를 정확히 찾아냄으로 해서 거래가 어떻게 개선될지 상상해 보십시오. 새로운 알고리즘을 기반으로 매수자와 매도자 간의 잠재적인 불균형을 훨씬 더 쉽게 분간할 수 있습니다. 왜냐하면 가장 강한 공급영역과 가장 강한 수요 영역과 과거에 어떻게 진행 되었는지를(이전
Imbalance Pro
Ivan Stefanov
5 (4)
이 인디케이터는 선택한 기간 동안 상승과 하락 사이의 불균형을 측정하고 두 지점 사이의 직선을 표시합니다. 상승세가 하락세보다 거래량이 많으면 선이 녹색으로 바뀝니다.  하락세가 더 많으면 빨간색으로 표시됩니다. 이 선은 거래량의 백분율 차이도 표시합니다. 표시기는 별도의 창에 동일한 데이터를 표시합니다. 분할된 볼륨도 볼 수 있습니다. 표시기에는 두 가지 모드가 있습니다. 이를 위해 왼쪽 상단에 버튼이 있습니다,  - 누르지 않으면 시장의 임의의 지점과 현재 가격 사이의 불균형을 측정합니다.  - 버튼을 누르면 선택한 시장의 두 지점 사이의 잔액을 측정할 수 있습니다. 이 인디케이터는 선택한 기간 동안 상승과 하락 사이의 불균형을 측정하고 두 지점 사이의 직선을 표시합니다. 상승세가 하락세보다 거래량이 많으면 선이 녹색으로 바뀝니다.  하락세가 더 많으면 빨간색으로 표시됩니다. 이 선은 거래량의 백분율 차이도 표시합니다. 표시기는 별도의 창에 동일한 데이터를 표
Advanced Currency IMPULSE with ALERT
Bernhard Schweigert
4.9 (491)
현재 40% 할인!! 초보자 또는 전문가 트레이더를 위한 최고의 솔루션! 이 지표는 우리가 독점 기능과 비밀 공식을 통합했기 때문에 독특하고 고품질이며 저렴한 거래 도구입니다. 단 하나의 차트로 28개 통화 쌍 모두에 대한 경고를 제공합니다. 새로운 추세 또는 스캘핑 기회의 정확한 트리거 포인트를 정확히 찾아낼 수 있기 때문에 거래가 어떻게 개선될지 상상해 보십시오! 새로운 기본 알고리즘을 기반으로 구축되어 잠재적인 거래를 훨씬 더 쉽게 식별하고 확인할 수 있습니다. 이는 통화의 강세 또는 약세가 가속되는지 여부를 그래픽으로 표시하고 가속 속도를 측정하기 때문입니다. 자동차의 속도계처럼 생각하면 됩니다. 가속화할 때 Forex 시장에서 동일한 일이 분명히 더 빠르게 발생합니다. 즉, 반대 방향으로 가속화되는 통화를 페어링하면 잠재적으로 수익성 있는 거래를 식별한 것입니다. 통화 모멘텀의 수직선과 화살표가 거래를 안내합니다! 역동적인 Market Fibonacci 23 레벨은
Super Signal – Skyblade Edition 전문가용 노리페인트 / 노래그 트렌드 신호 시스템, 뛰어난 승률 제공 | MT4 / MT5용 1분, 5분, 15분과 같은 낮은 타임프레임에서 가장 좋은 성능을 보입니다. 핵심 기능: Super Signal – Skyblade Edition은 추세 매매를 위해 설계된 스마트 신호 시스템입니다. 이 시스템은 다중 필터 로직을 활용하여, 명확한 방향성과 실질적인 모멘텀이 수반된 고품질 추세만을 감지합니다. 이 시스템은 고점 또는 저점을 예측하지 않으며 , 다음 세 가지 조건이 모두 충족될 때만 신호를 발생시킵니다: 명확한 추세 방향 강화되는 모멘텀 건전한 변동성 구조 또한, 시장 세션 기반의 유동성 분석을 통해 신호의 신뢰성과 타이밍을 더욱 향상시킵니다. 신호 특성: 모든 화살표 신호는 100% 리페인트 없음 / 지연 없음 신호가 한 번 발생하면 고정되며, 깜빡이거나 사라지지 않음 차트 상의 시각적 화살표, 정보 패널, 팝업 알
Liquidity Scalper System
Stanislav Konin
5 (2)
Liquidity Scalper System: 인디케이터 형식의 유동성 기반 트레이딩 시스템입니다. 대부분의 인디케이터는 화살표만 보여주고, 손절을 어디에 둘지, 목표가 어디인지, 신호를 믿어도 되는지는 트레이더가 스스로 판단해야 합니다. Liquidity Scalper System은 거래의 전체 주기를 다룹니다. 유동성 풀을 찾고, 돌파 시 신호를 주며, Entry, Stop Loss와 세 개의 목표를 즉시 계산하고, 패널에 통계와 새로운 데이터에 대한 검증 결과를 표시합니다. 설정은 시스템이 스스로 선택하고 매일 업데이트합니다. 작동 방식 1. 시스템이 유동성 풀을 찾습니다. 시장 참여자들의 스톱 주문이 쌓여 있는 레벨입니다. 2. 가격이 풀을 돌파하고 그 돌파가 움직임의 강도(필요 시 거래량)로 확인되면 차트에 BUY 또는 SELL 화살표가 나타납니다. 3. Entry, Stop Loss, TP1, TP2, TP3 레벨이 영역 채우기와 함께 즉시 그려집니다. 4. 오른쪽에 유
Gann Made Easy
Oleg Rodin
4.84 (174)
Gann Made Easy 는 mr.의 이론을 사용하여 최고의 거래 원칙을 기반으로 하는 전문적이고 사용하기 쉬운 Forex 거래 시스템입니다. W.D. 간. 이 표시기는 Stop Loss 및 Take Profit Levels를 포함하여 정확한 BUY 및 SELL 신호를 제공합니다. PUSH 알림을 사용하여 이동 중에도 거래할 수 있습니다. 구매 후 거래 방법 안내 및 유용한 추가 지표를 무료로 받으시려면 저에게 연락주세요! 아마도 Gann 거래 방법에 대해 이미 여러 번 들었을 것입니다. 일반적으로 Gann의 이론은 초보자 거래자뿐만 아니라 이미 거래 경험이 있는 사람들에게도 매우 복잡한 것입니다. Gann의 거래 방식은 이론적으로 적용하기 쉽지 않기 때문입니다. 나는 그 지식을 연마하고 Forex 지표에 최고의 원칙을 적용하기 위해 몇 년을 보냈습니다. 표시기는 적용하기가 매우 쉽습니다. 차트에 첨부하고 간단한 거래 권장 사항을 따르기만 하면 됩니다. 지표는 지속적으로 시장 분석
Tokyo mt4 Indicator
Vasiliy Strukov
5 (9)
Tokyo Indicator는 추세 방향, 잠재적 거래 신호 및 시장 상황을 명확하고 시각적으로 보여줍니다. 색상으로 구분된 계단식 추세선은 강세 구간(파란색)과 약세 구간(자홍색)을 명확히 구별해 줍니다. 추세가 전환될 때 나타나는 방향성 화살표는 잠재적인 매수 및 매도 기회를 강조하여 보여줍니다. 통합 대시보드는 현재 신호, 시장 성향(bias), 모멘텀, 변동성, 신호 품질 등의 정보를 한눈에 파악할 수 있도록 구성되어 있습니다. 이를 통해 트레이더는 별도의 패널을 오갈 필요 없이 가격 움직임(price action)과 지표의 데이터를 동시에 분석할 수 있습니다. 깔끔한 차트 화면과 간결한 시장 개요를 제공하는 Tokyo Indicator는 체계적인 추세 분석과 거래 결정을 지원합니다. 모든 시간대와 다양한 자산(특히 금)에서 활용할 수 있습니다. 추세 방향, 잠재적 거래 신호 및 시장 상황을 명확하고 시각적으로 보여줍니다. 색상으로 구분된 계단식 추세선은 강세 구간(파란색)
Elliott Live 는 MetaTrader 5용 인디케이터로, 과거 차트와 현재 봉 모두에서 엘리엇 파동을 자동으로 표시합니다. 완성된 파동은 실선으로, 형성 중인 파동은 점선과 물음표 라벨(예: "3?")로 그려지며, 피보나치 목표 구간과 무효화 레벨도 함께 표시됩니다. MT5-version:  https://www.mql5.com/en/market/product/200604 작동 방식 먼저 스윙(ZigZag)을 만듭니다. 가격이 극값에서 ATR × 배수 이상 되돌림하면 반전으로 인식합니다. 마지막 점은 현재의 극값으로, 아직 확정되지 않았으며 움직일 수 있습니다. 이 스윙 위에서 엘리엇 규칙에 따라 충격파 1-2-3-4-5를 찾습니다. 2파는 1파의 시작점을 넘지 않고, 3파는 가장 짧은 파동이 되지 않으며, 4파는 1파의 영역에 들어가지 않습니다. 충격파 다음에는 조정파 A-B-C를, 그다음에는 다음 충격파를 찾습니다. 최근 스윙이 패턴의 일부(예: 1-2)만 이루고 있으
Gold Channel XAUUSD
Paulo Rocha
5 (4)
Gold Channel is a volatility-based indicator, developed with a specific timing algorithm for the XAUUSD pair, which consists of finding possible corrections in the market. This indicator shows two outer lines, an inner line (retracement line) and an arrow sign, where the theory of the channel is to help identify overbought and oversold conditions in the market. The market price will generally fall between the boundaries of the channel. If prices touch or move outside the channel it is a tradi
이 지표는 8개 주요 통화(USD, EUR, GBP, AUD, NZD, CAD, CHF, JPY)의 상대적 강세를 보여줍니다. 힘 값은 0~100 범위에서 정규화됩니다. 60 이상의 값은 강함을 의미합니다. 40 미만의 수치는 약점을 나타냅니다. 기본 원리 USD,EUR,GBP,AUD,NZD,CAD,CHF,JPY의 8개 통화가 주어지고 각 통화 쌍을 결합하여 총 28개 통화 쌍이 생성되며 역알고리즘을 사용하여 8개 통화의 강도를 추출합니다. 이 28쌍 중에서 EURUSD,GBPUSD,AUDUSD,NZDUSD, USDCAD,USDCHF,USDJPY,EURGBP, EURAUD,EURNZD,EURCAD,EURCHF, EURJPY,GBPAUD,GBPNZD,GBPCAD, GBPCHF,GBPJPY,AUDNZD,AUDCAD, AUDCHF,AUDJPY,NZDCAD,NZDCHF, NZDJPY,CADCHF,CADJPY,CHFJPY 주요 용도 강도 값이 60 이상이면 강함을 의미하고, 40 미만은 약
Liked the logic of this tool? Explore the full ecosystem of professional indicators and utilities created by a trader for traders: All products by the author on MQL5 Market: https://www.mql5.com/en/users/musa1994/seller Details and trading philosophy: https://developer-mql4-mql5.netlify.app/ Professional Delta Volume MTF v2.0 is a professional indicator for MetaTrader 4 that shows the difference between buy and sell volume (Delta Volume) and Cumulative Delta. Version 2.0 introduces f
Sniper Flip Zones
Leandro Bernardez Camero
5 (2)
Sniper Flip Zones – 정밀한 매수/매도 신호 시스템 Sniper Flip Zones는 추세장이나 횡보장에서 모멘텀이 급격히 전환되는 순간을 포착하여 매우 정밀한 매수 및 매도 신호를 생성하도록 설계했습니다. XAUUSD의 M1/M5에서 특히 잘 작동하며, 설정 가능한 매개변수를 통해 어떤 통화쌍이나 시간대에서도 사용할 수 있습니다. 최신 정보를 받아보시려면 채널을 구독하세요: https://www.mql5.com/en/channels/forexnewadvisor 핵심 로직은 다음 요소들을 결합합니다: – 스토캐스틱 지표의 극단 영역(10/90)에서의 반전 – 선택 가능한 %K와 %D의 교차 신호 – 단기 및 장기 이동 평균을 활용한 동적 추세 인식 – 같은 방향의 연속 신호를 피하기 위한 교차 신호 논리 신호가 생성되는 방식: – 과매수/과매도 탈출: 빠른 스토캐스틱이 극단 구간을 벗어날 때 단기적인 반전을 감지합니다. – 교차 필터: 보다 강력한 확인을 위
Italo Volume Indicator
Italo Santana Gomes
4.92 (79)
BUY INDICATOR AND GET EA FOR FREE AS A BONUS + SOME OTHER GIFTS! ITALO VOLUME INDICATOR  is the best volume indicator ever created, and why is that? The Indicator works on all time-frames and assets, indicator built after 7 years of experience on forex and many other markets. You know many volume indicators around the internet are not complete, does not help, and it's difficult to trade, but the Italo Volume Indicator is different , the Italo Volume Indicator shows the wave volume, when market
SIO Oscillator: 자기 최적화 세미분산 불균형 오실레이터 지표를 구매하시면 이를 기반으로 한 전문가 어드바이저(EA)를 무료로 받으실 수 있습니다. 대부분의 오실레이터는 모든 가격 움직임을 똑같이 취급합니다. SIO는 상승 압력과 하락 압력을 분리하여 둘 사이의 불균형을 측정하고, 매수자와 매도자 중 어느 쪽이 실제로 시장을 주도하고 있는지 보여줍니다. 불균형이 극단에 도달하면 SIO는 진입가, 손절(Stop Loss), 익절(Take Profit) 수준이 포함된 명확한 신호를 표시합니다. SIO의 차별점은 고정된 설정에 의존하지 않는다는 것입니다. 내장된 자기 최적화 엔진이 현재 종목과 시간 프레임에 맞는 파라미터를 지속적으로 탐색하고, 사용하기 전에 검증합니다. 두 가지 신호 모드 평균 회귀(Mean Reversion): 불균형의 극단에서 거래하며 균형으로의 복귀를 노립니다. 추세 추종(Trend Following): 지속적이고 우세한 불균형의 방향으로 거래합니다. 자
제작자의 제품 더 보기
Az OrderGun
Jose Antonio Valle Magana
AZ_OrderGun MT4 - Professional 1-Click Trading Panel AZ_OrderGun is the all-in-one panel to execute and manage your trades without wasting time setting up SL/TP. KEY FEATURES: 1. 4 INSTANT ENTRIES: Buy SLL - Buy with SL on Low of previous candle Sell SLH - Sell with SL on High of previous candle Buy SLO / Sell SLO - SL on Open of previous candle > Fully configurable % Risk 2. ADVANCED VISUAL MANAGEMENT: Draggable lines for Pending and Market orders Auto calculation of Lot Size, $ Ri
Az Order Manager
Jose Antonio Valle Magana
Az Order Manager - Free Visual Hook Edition V1.2 The most visual order management panel, now available for free to try. This is the free version of Az Order Manager Diamond 9.41 (Best Seller). What is this tool? A professional panel to manage orders with visual lines. You can draw entry, stop loss and take profit lines, move them on the chart and see lot size, risk in $ and reward in real time before executing. WHAT YOU CAN DO IN THIS FREE VERSION (100% Working): Visual Lines - Click Pen
FREE
Az OrderGunF
Jose Antonio Valle Magana
<b>AZ_OrderGun FREE - 1-Click Trading Panel (Free Version)</b> The powerful free version of AZ_OrderGun to test the execution speed. <b> WHAT'S INCLUDED IN FREE?</b> 4 Instant Entries: Buy SLL / Sell SLH / Buy SLO / Sell SLO Automatic Lot Size calculation by % Risk Full Features: Close All, BE All, Close %, Close Pending 100% Visual and draggable panel <b> LIMITED FEATURES IN FREE:</b> Advanced management features Pend. Send, Mkt. Send, Close Winners and Close Losers are only avai
FREE
AZ Smart Levels and Zones
Jose Antonio Valle Magana
AZ Smart Levels and Zones는 MetaTrader 4 차트에 세 가지 기본 SMC(시장 구조) 도구인 구조 돌파, 페어 밸류 갭(Fair Value Gap), 오더 블록(Order Block)을 직접 그려 줍니다. 표시 내용 시장 구조(BOS / CHoCH) • 확정된 캔들에서 스윙 고점과 저점을 감지합니다(스윙 길이는 조정 가능). • Break of Structure(BOS): 현재 추세 방향으로 캔들이 마지막 스윙을 넘어 종가를 형성할 때. 실선으로 표시됩니다. • Change of Character(CHoCH): 현재 추세와 반대 방향으로 캔들이 마지막 스윙을 넘어 종가를 형성할 때. 점선으로 표시됩니다. • 각 선에는 라벨이 붙고 방향에 따라 색이 지정됩니다. 가장 최근의 돌파들이 표시됩니다. 페어 밸류 갭(FVG) • 세 개의 캔들로 이루어진 상승 및 하락 갭을 감지합니다. • 각 갭은 오른쪽으로 연장된 채워진 박스로 그려지며, 범위의 50% 지점
AZ Scale Fix and Zoom Panel adds a compact control panel to your MT4 chart so you can lock the price scale, zoom the price axis and position the chart exactly where you need it, all with one click. Reading the candles next to the current price, or placing an order with precision, often means zooming far into the price axis. MT4 does this through several chart settings that are slow to reach and awkward to use. This panel puts them in one place. WHAT THE PANEL DOES Scale fix / Unfix scale Loc
AZ OrderGun Pro
Jose Antonio Valle Magana
AZ_OrderGun - Professional Order Management Panel AZ_OrderGun is a lightweight and fast trade management tool designed for manual traders who need full control over their trades directly from the chart. MAIN FEATURES One-Click Trading: Buy SLL, Sell SLH, Buy SLO, Sell SLO with predefined Stop Loss Visual SL/TP Management: Drag and drop Stop Loss and Take Profit lines directly on the chart Smart Risk Calculation: Automatic lot size calculation based on % risk and SL distance Risk/Reward Ratio:
필터:
리뷰 없음
리뷰 답변