WallStreet Crypto Indicator
- 지표
-
Lachezar Krastev
 We are an experienced team of professional Forex Traders and Developers with more than 15 years trading experience, 12 years in developing automated trading systems.
 - 버전: 1.1
- 활성화: 10
FOREX MEGA SALE! 65% OFF!
Buy WallStreet Crypto Indicator with a huge –65% discount!
Promo Price: $97
(Regular Price: $297 — You Save $200!)
Act now before this deal ends!
How the Indicator Works & How to Use It
Top Features
- Complete Execution Station: Combines entry signals, dynamic stop-loss levels, and dual take-profit targets on a single screen.
- On-Chart Interactive Dashboard: Drag-and-drop info panel displaying real-time Spread, ATR, R:R calculation, and Bar Close Timer.
- Visual Trend Shading: Customizable background shading between price and trend levels gives immediate visual context to market bias.
- Confirmed Bar Alerts: Configurable pop-up and mobile push notifications that only fire after a candle closes, eliminating signal repainting.
- Multi-Asset & Multi-Timeframe: Built to handle the heavy market noise of BTC, ETH, and volatile Forex/Gold pairs across M1 up to Daily timeframes.
There is a MT5 version too! Click here to check the MT5 version!
Recommendations
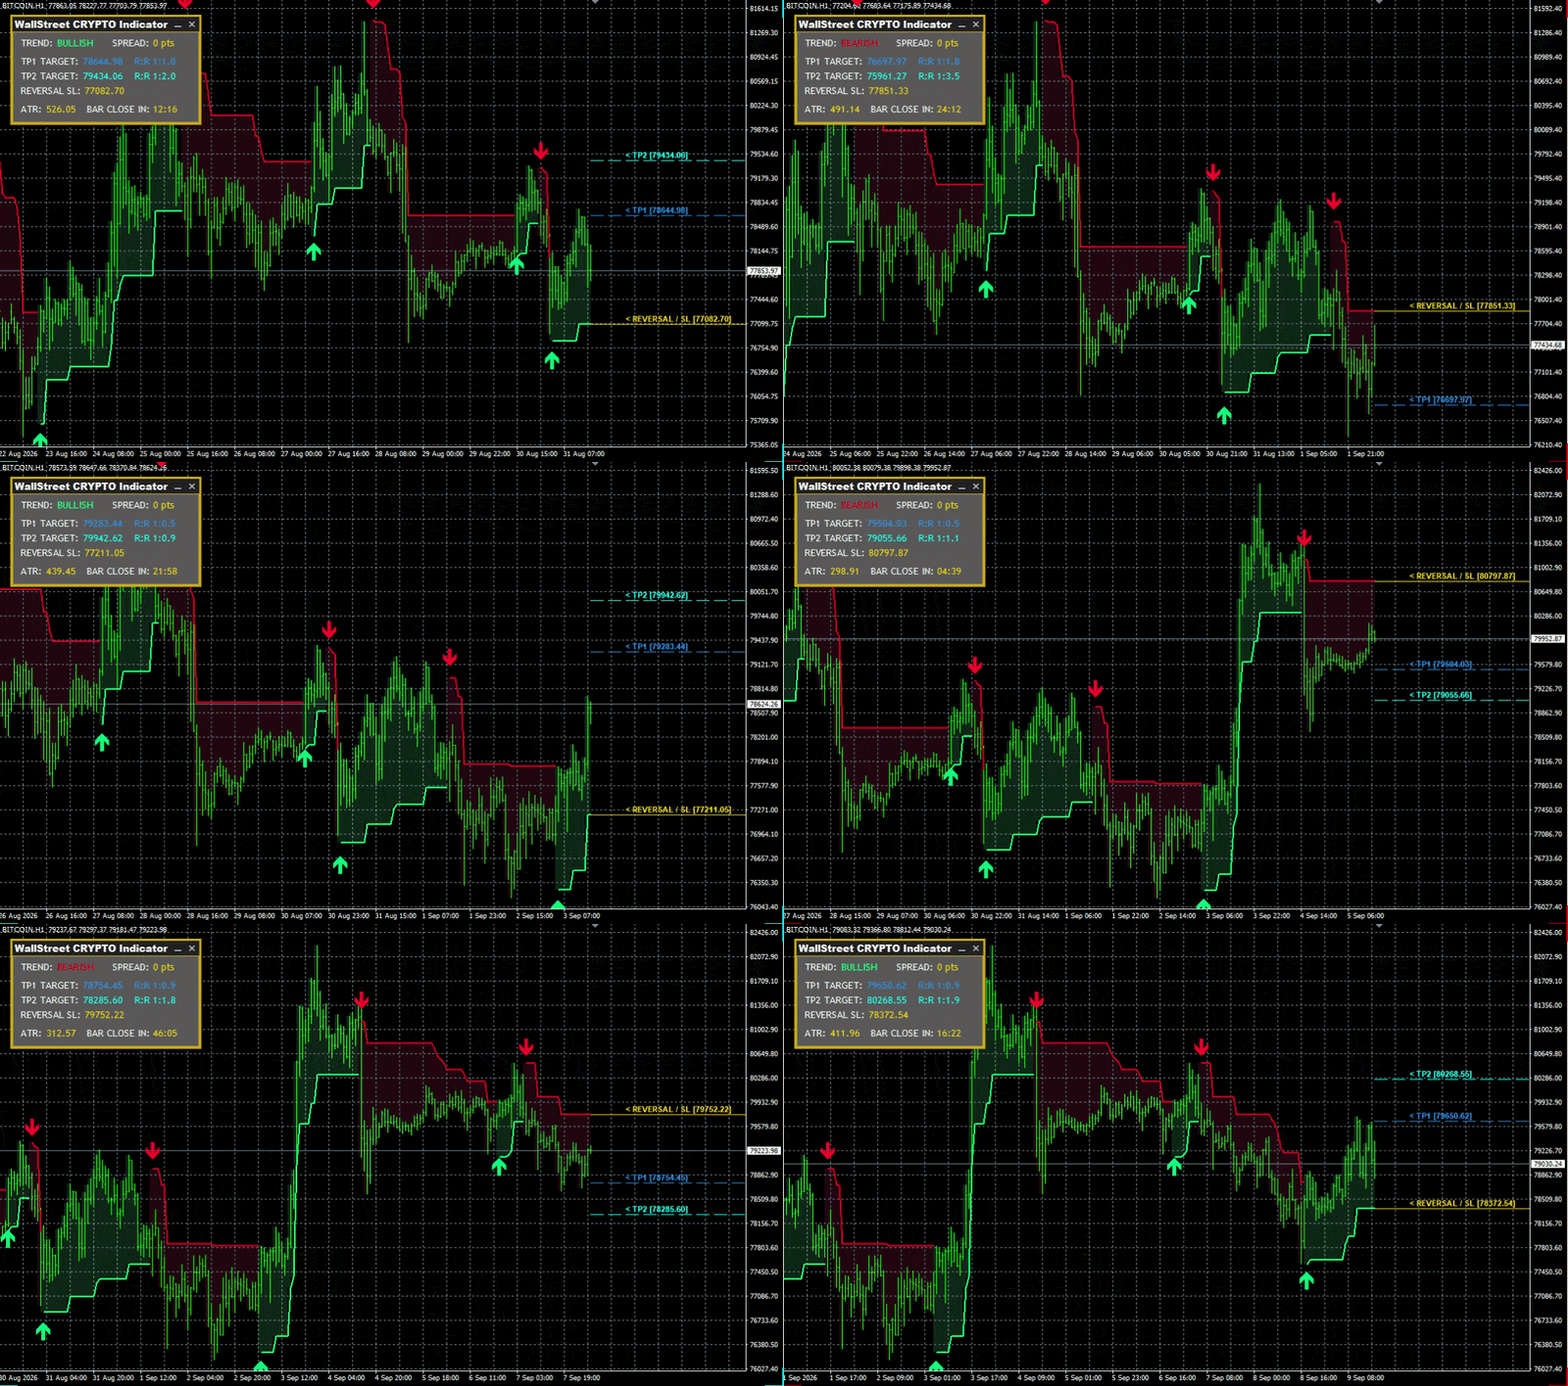
Recommended time frames: from M15 till H4. On M15 most of the signals will be scalping signals. On H1 and H4 trending signals!
Avoid choppy markets! You need to be able to recognize a choppy market and try to ignore it. A choppy market is a market that is highly volatile, but results in no overall price movement, in either direction. These price spikes and sharp rebounds from the range borders can generate a series of poor signals.
WallStreet CRYPTO Indicator signals are at their most reliable, when following the market in trend, or a wide swing mode. Avoid trading in periods of low liquidity. In these periods, the market is generally in a narrow choppy range.
Chart Elements
Below you can find all the elements the WallStreet Crypto Indicator shows on the chart:
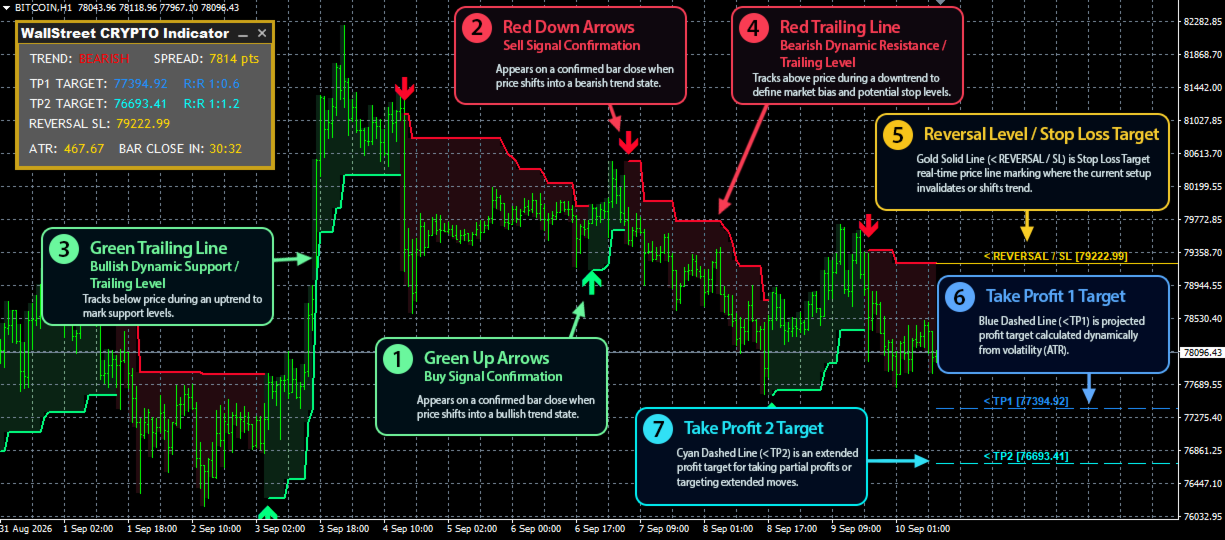
- Red Down Arrows: Sell Signal Confirmation — Appears on a confirmed bar close when price shifts into a bearish trend state.
- Green Up Arrows: Buy Signal Confirmation — Appears on a confirmed bar close when price shifts into a bullish trend state.
- Red Trailing Line: Bearish Dynamic Resistance / Trailing Level — Tracks above price during a downtrend to define market bias and potential stop levels.
- Green Trailing Line: Bullish Dynamic Support / Trailing Level — Tracks below price during an uptrend to mark support levels.
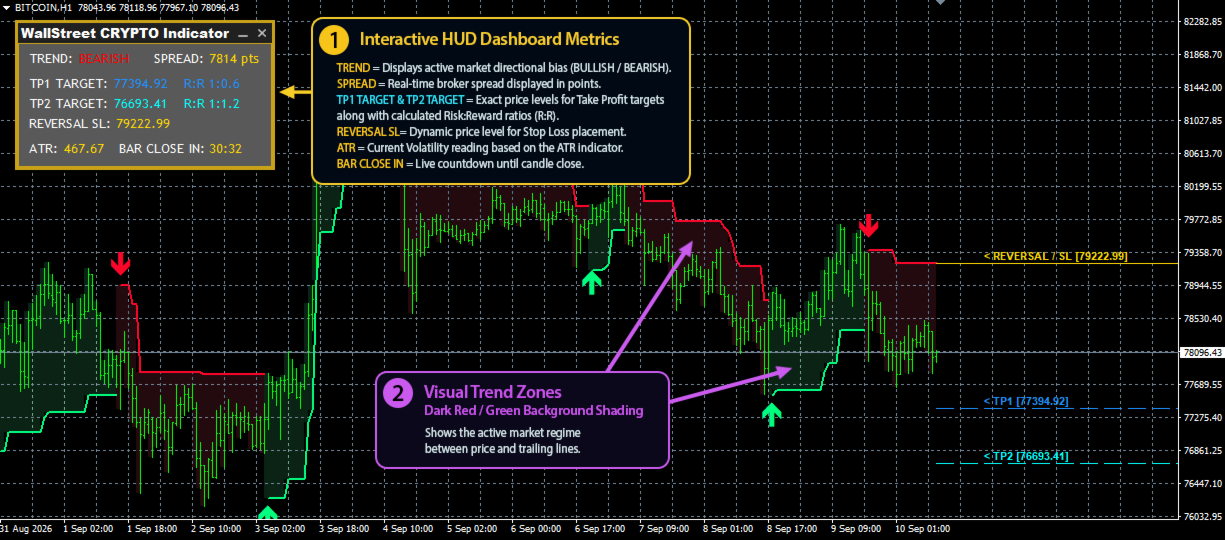
- Dark Red / Green Background Shading: Visual Trend Zones — Gives immediate visual context of the active market regime between price and trailing lines.
- Gold Solid Line (< REVERSAL / SL): Reversal Level / Stop Loss Target — Real-time price line marking where the current setup invalidates or shifts trend.
- Blue Dashed Line (< TP1): Take Profit 1 Target — Projected profit target calculated dynamically from volatility (ATR).
- Cyan Dashed Line (< TP2): Take Profit 2 Target — Extended profit target for taking partial profits or targeting extended moves.
Below, among the images, you will find a photo with a detailed description of all the elements the indicator displays on the chart. Be sure to look at this image to get a clear idea of exactly what is shown and what it looks like. All the elements are easy to recognize and understand. We are confident that you will grasp everything at a glance.
Interactive HUD Dashboard Metrics
- TREND: Displays active market directional bias (BULLISH / BEARISH).
- SPREAD: Real-time broker spread displayed in points.
- TP1 TARGET & TP2 TARGET: Exact price levels for Take Profit targets along with calculated Risk:Reward ratios (R:R).
- REVERSAL SL: Dynamic price level for Stop Loss placement.
- ATR: Current Volatility reading based on the indicator's ATR calculation period.
- BAR CLOSE IN: Live countdown timer showing remaining time before the current candle closes.
Input Parameters Guide
- Show_TargetLevels: Toggles the display of live TP1, TP2, and Reversal/SL target lines on the chart.
- TP1_ATR_Multiplier: Sets Take Profit 1 distance relative to current market volatility (ATR).
- TP2_ATR_Multiplier: Sets Take Profit 2 distance relative to current market volatility (ATR).
- Show_BackgroundShading: Enables colored background fill between price and the dynamic trend line.
- Bullish_ShadingColor: Custom background shade color during active bullish trends.
- Bearish_ShadingColor: Custom background shade color during active bearish trends.
- Show_Dashboard: Shows or hides the interactive on-chart info panel.
- Dashboard_X_Initial: Sets the initial horizontal (X) pixel coordinate of the dashboard.
- Dashboard_Y_Initial: Sets the initial vertical (Y) pixel coordinate of the dashboard.
- Show_Arrows: Displays Buy/Sell signal arrows on confirmed trend flips.
- Alerts: Enables native terminal pop-up alerts on bar completion.
- Send_Push_Notifications: Sends instant mobile push notifications to your MetaTrader phone app.
- Prefix: Text prefix used for naming chart objects to prevent conflicts with other tools.
- Volatility_Period: Calculation period for volatility measurements used by target projections.
- Smooth_Factor: Applies moving average smoothing to entry filters (`0` = deactivated/raw price).
- Max_Width_Pips: Limits the maximum allowable distance for the dynamic trend line.
- Min_Follow_Pips: Minimum pip distance the trend line must maintain relative to price action.
- TrendLine_Level: Controls overall sensitivity of the trend detection.
- Max_Bars: Limits historical calculation depth to optimize terminal execution speed.
For more info about WallStreet Crypto Indicator click here!
If you like my product, please write a review! I will be very grateful!
You can check out my other products in my profile!
If you want to be notified of my new products, please add me as a friend! I regularly publish new forex robots!