Abiroid PVSRA Scanner MT4
- 지표
-
Abir Pathak
 I create MT4 and MT5 indicators. They are mainly arrows and scanner indicators and also some essential utilities.
I'm hoping they will make your trading easier and make you profitable.
You can join my Telegram channel to keep track of all products I post. - 버전: 1.12
- 업데이트됨: 20 6월 2026
- 활성화: 20
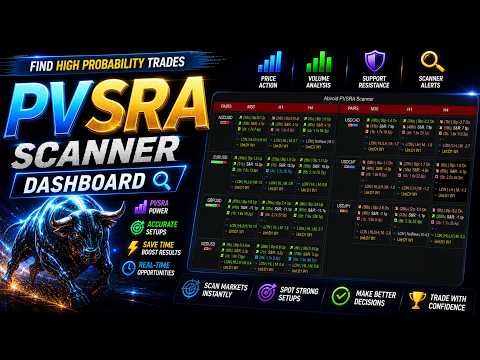
What Is It?
This PVSRA Screener is for real-time market analysis.
so instead of manually checking charts one by one, you get a live command center that tells you the market phase, volume intent, trend state, and nearest price structure all in one glance.
Features at a Glance
- Multi-pair, multi-timeframe scanner dashboard... monitors everything at once
- PVA (Price Volume Analysis)... detects Climax and Rising volume candles in real time
- The Dragon EMA... configurable trend anchor (default 50 EMA of Typical price, HLC/3)
- 200 EMA trend filter... separates bull regime from bear regime for each pair
- 89 EMA Momentum Slope... confirms natural momentum is present before signaling
- Round number proximity (Whole .00, Half .50, Quarter .25/.75 levels)
- Stop Hunt detection... identifies MM traps at key S&R levels
- Squat pattern... spots high-volume absorption bars with narrow range
- Run Exhaustion... warns when price is overextended from the Dragon
- Accumulation and Distribution phase identification
- Wave check (Higher Lows for longs / Lower Highs for shorts)
- Session filter... highlights active trading hours with different colors
- Untested Daily and Weekly price magnets... tracks whether key highs and lows have been visited
- M1 Cross-TF Volume gate... optional confirmation that lower timeframe volume aligns
- Color-coded action priority... from neutral gray to bright lime green for the highest probability setups
- Configurable alerts for every setup type independently
- Two scanner modes: Trend Mode and Retracement Mode
- Fully customizable colors, EMA periods, volume thresholds, and proximity settings