RoachMasterMind

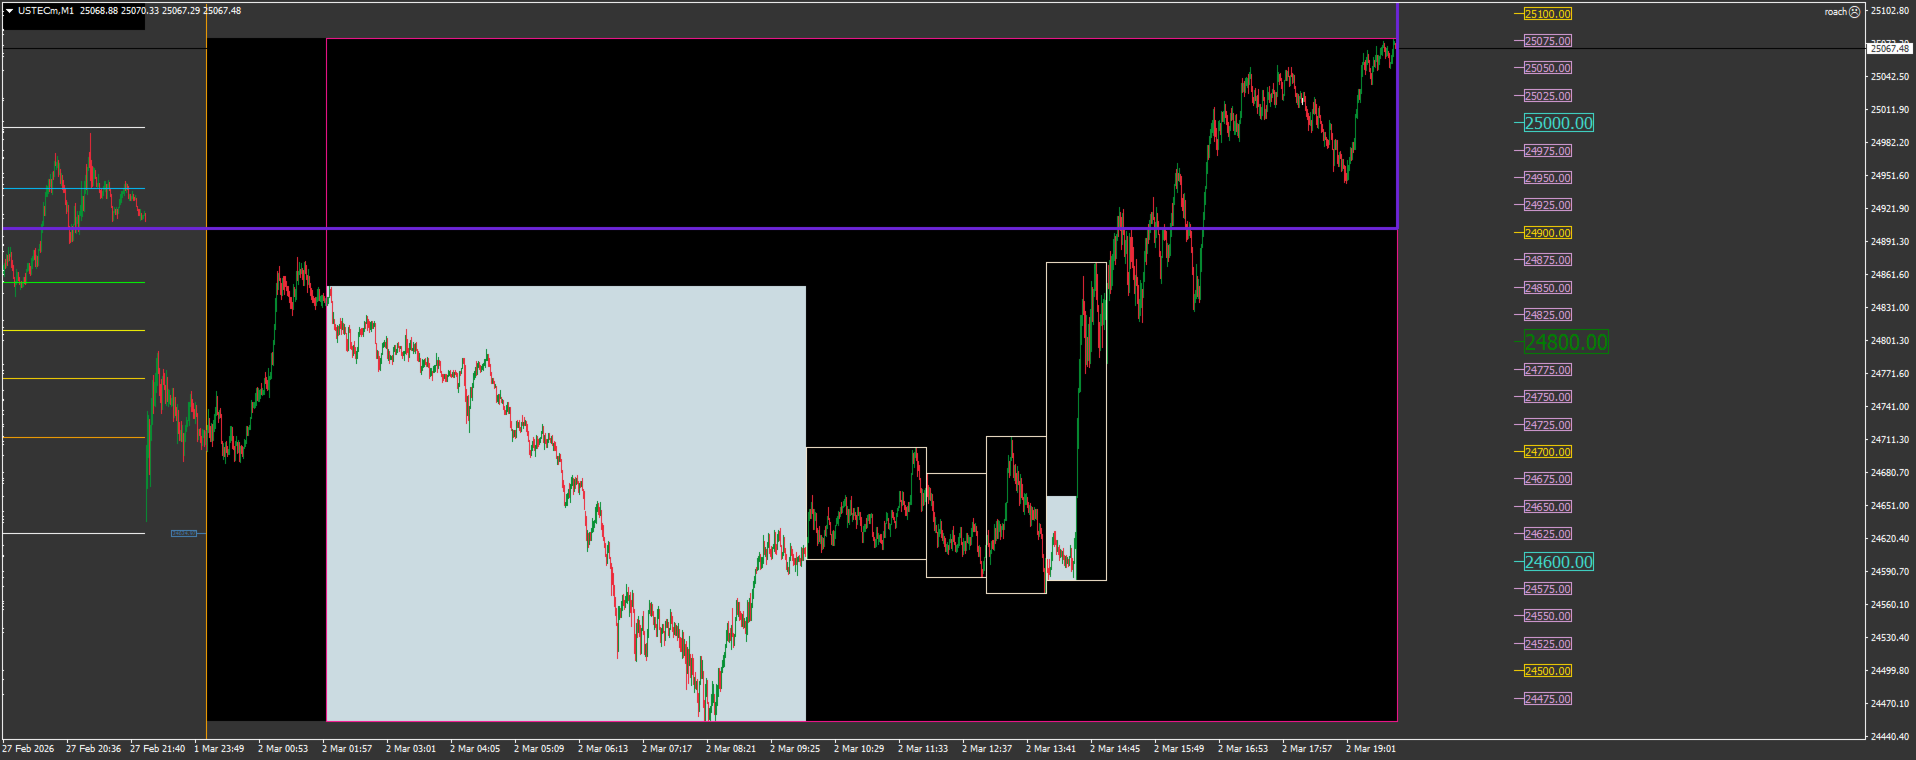
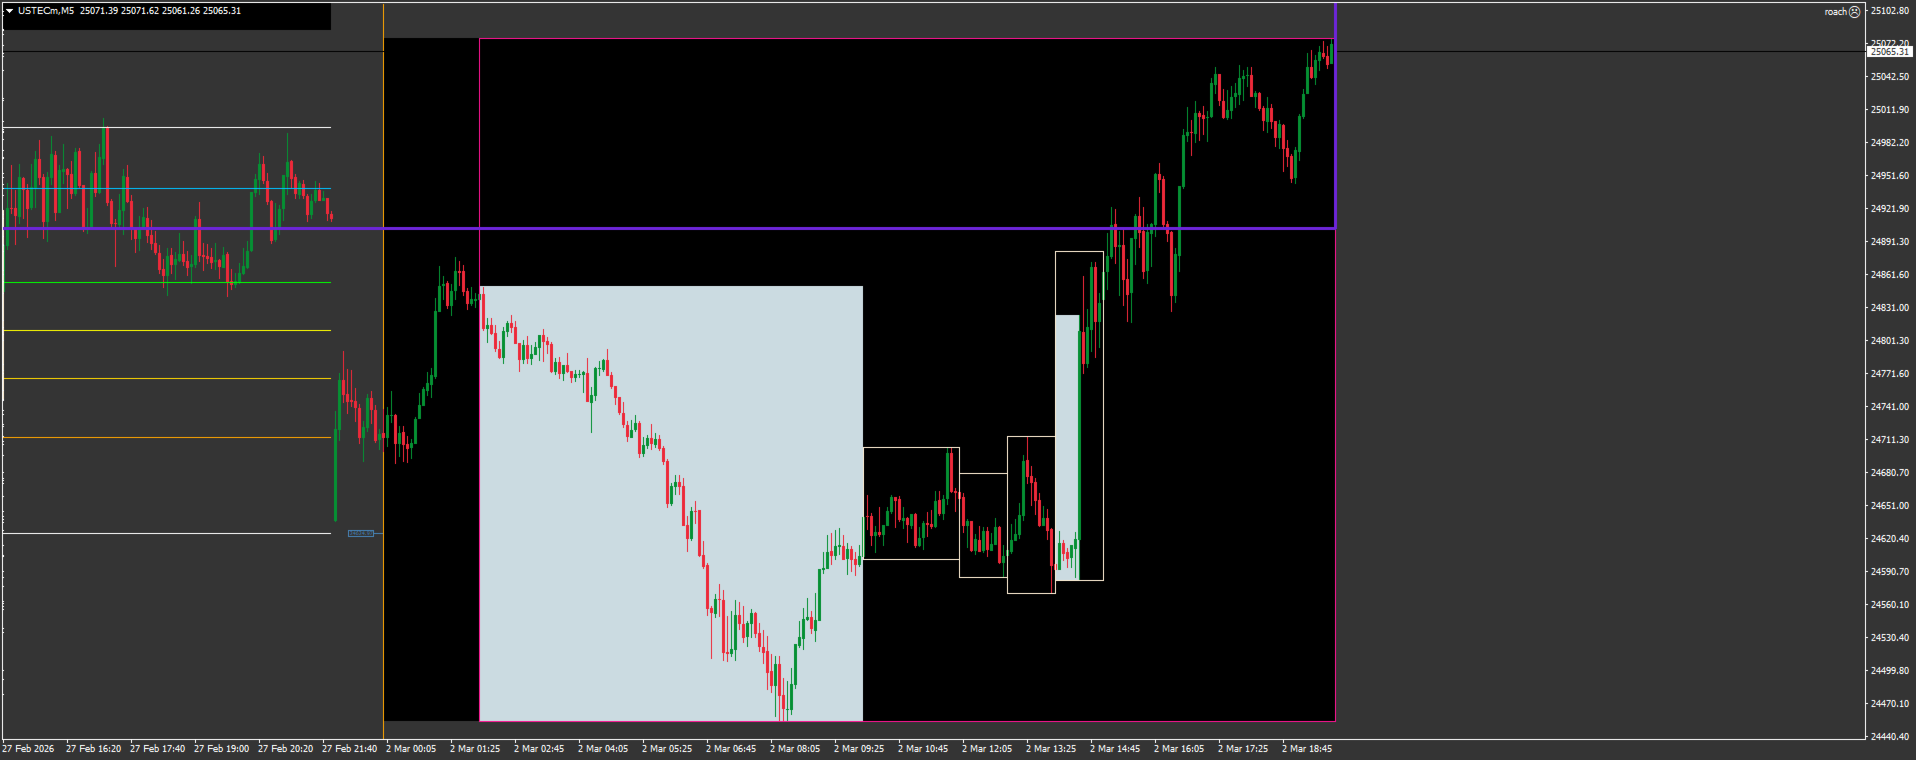
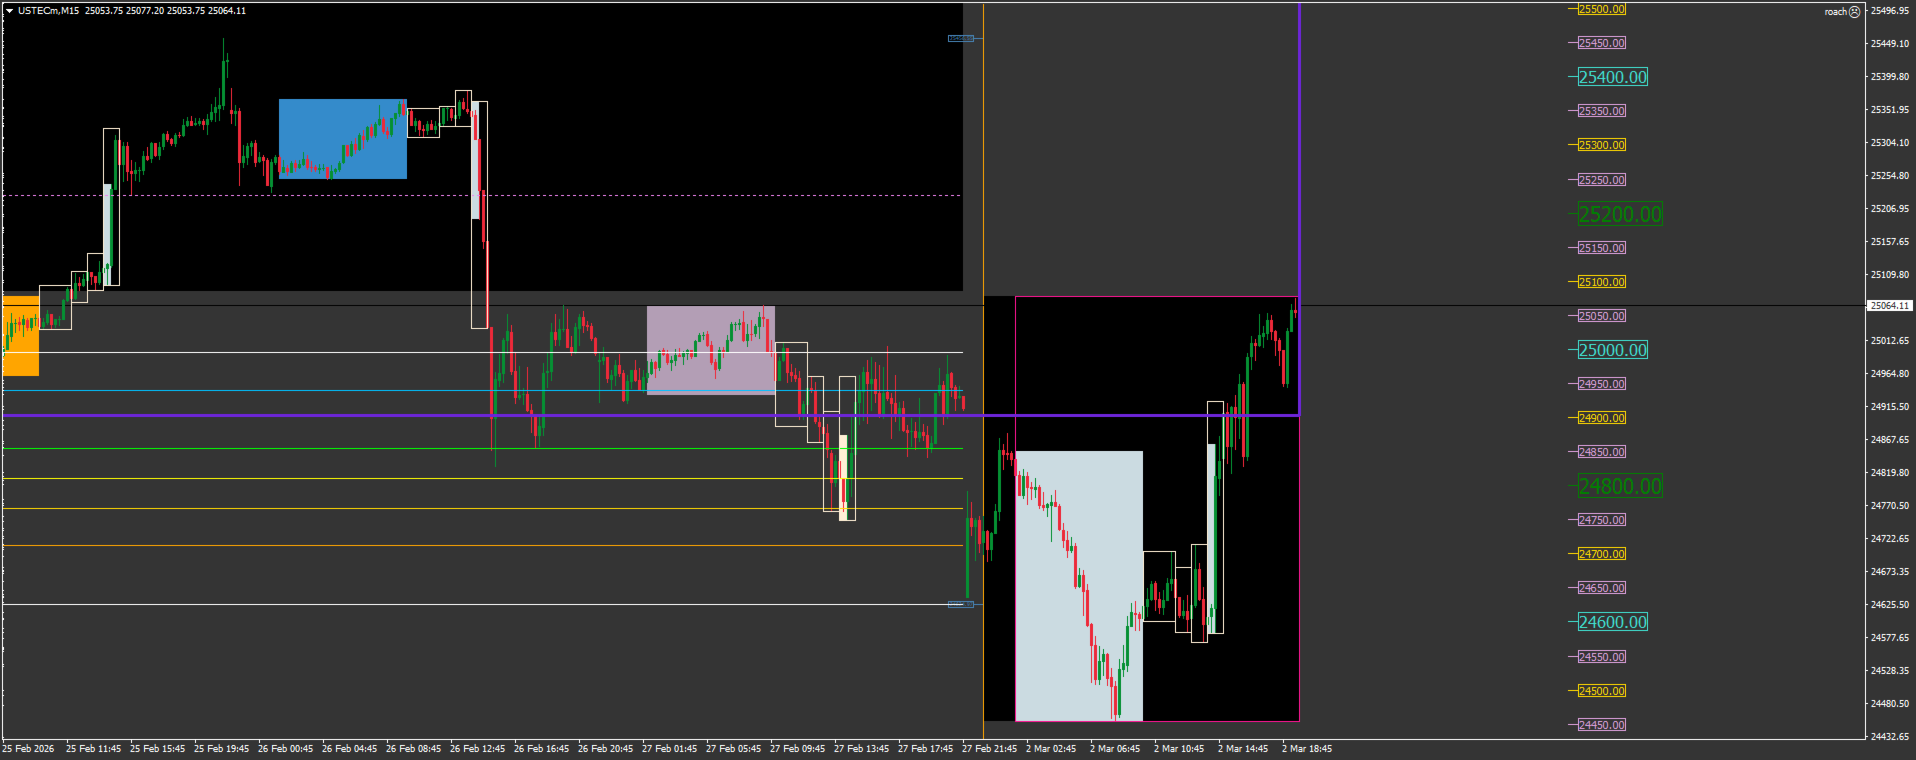
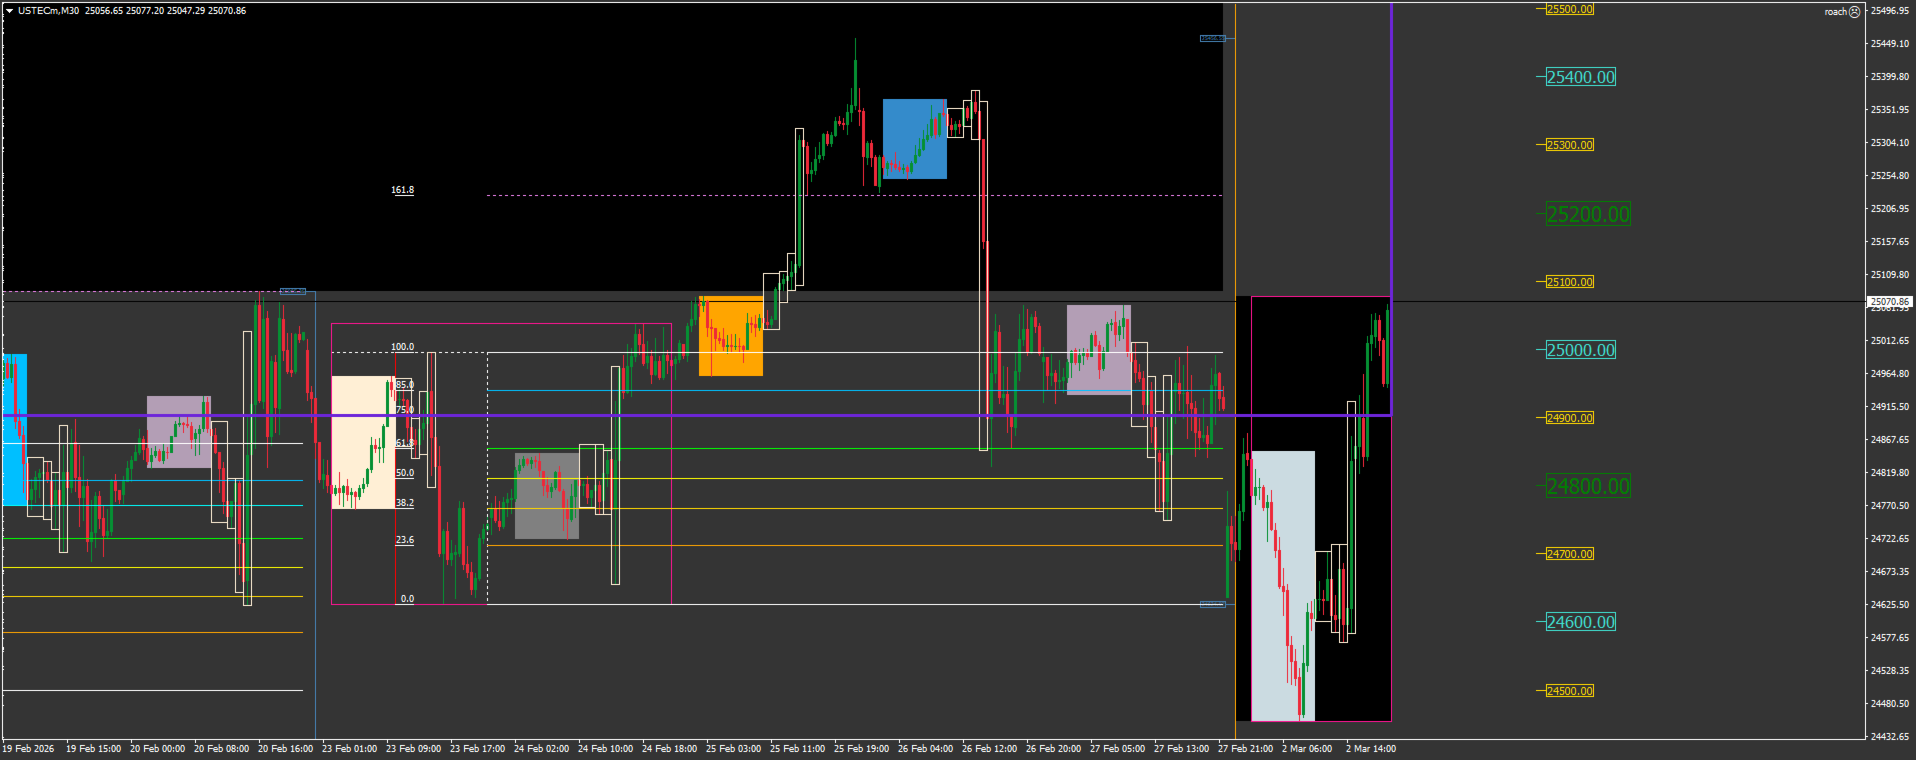
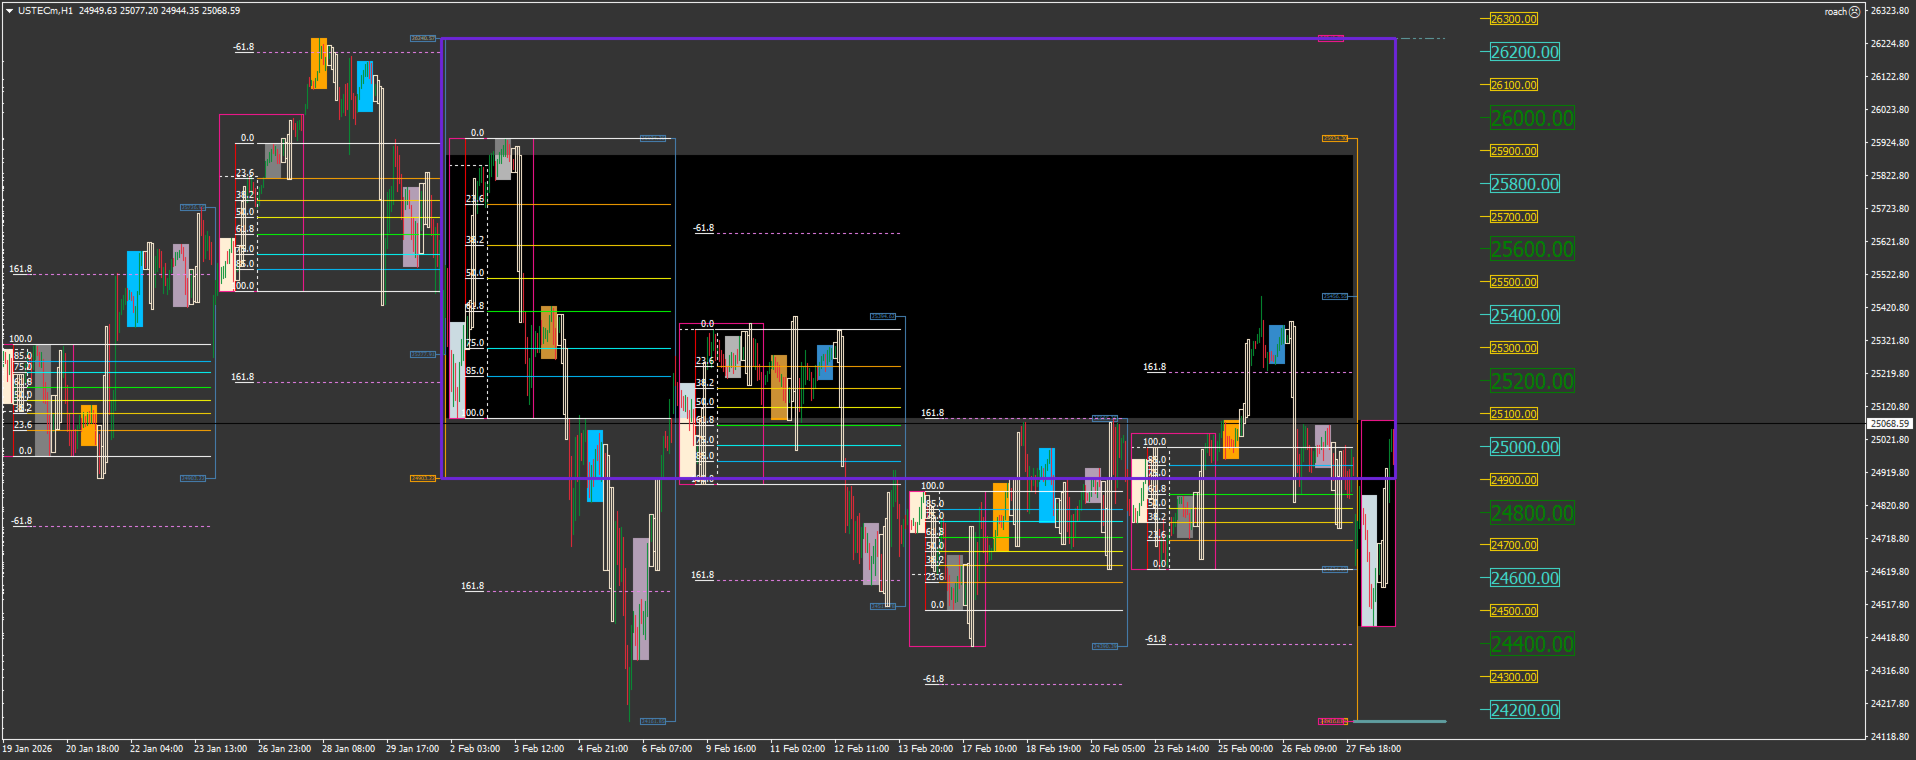
This Utility seeks to establish points of interest in a given trading week, by visually plotting the areas on a given chart.

Some of the features include:

  • Opening range of the week(Monday)
  • Initial balance of the week(Monday + Tuesday)
  • Daily abiter definitions(opening range for each day[Monday through Friday] - first 8 hours)
  • Fibonacci retracement(representing the weeks area of interest, by calculating the retracement levels for the given week)
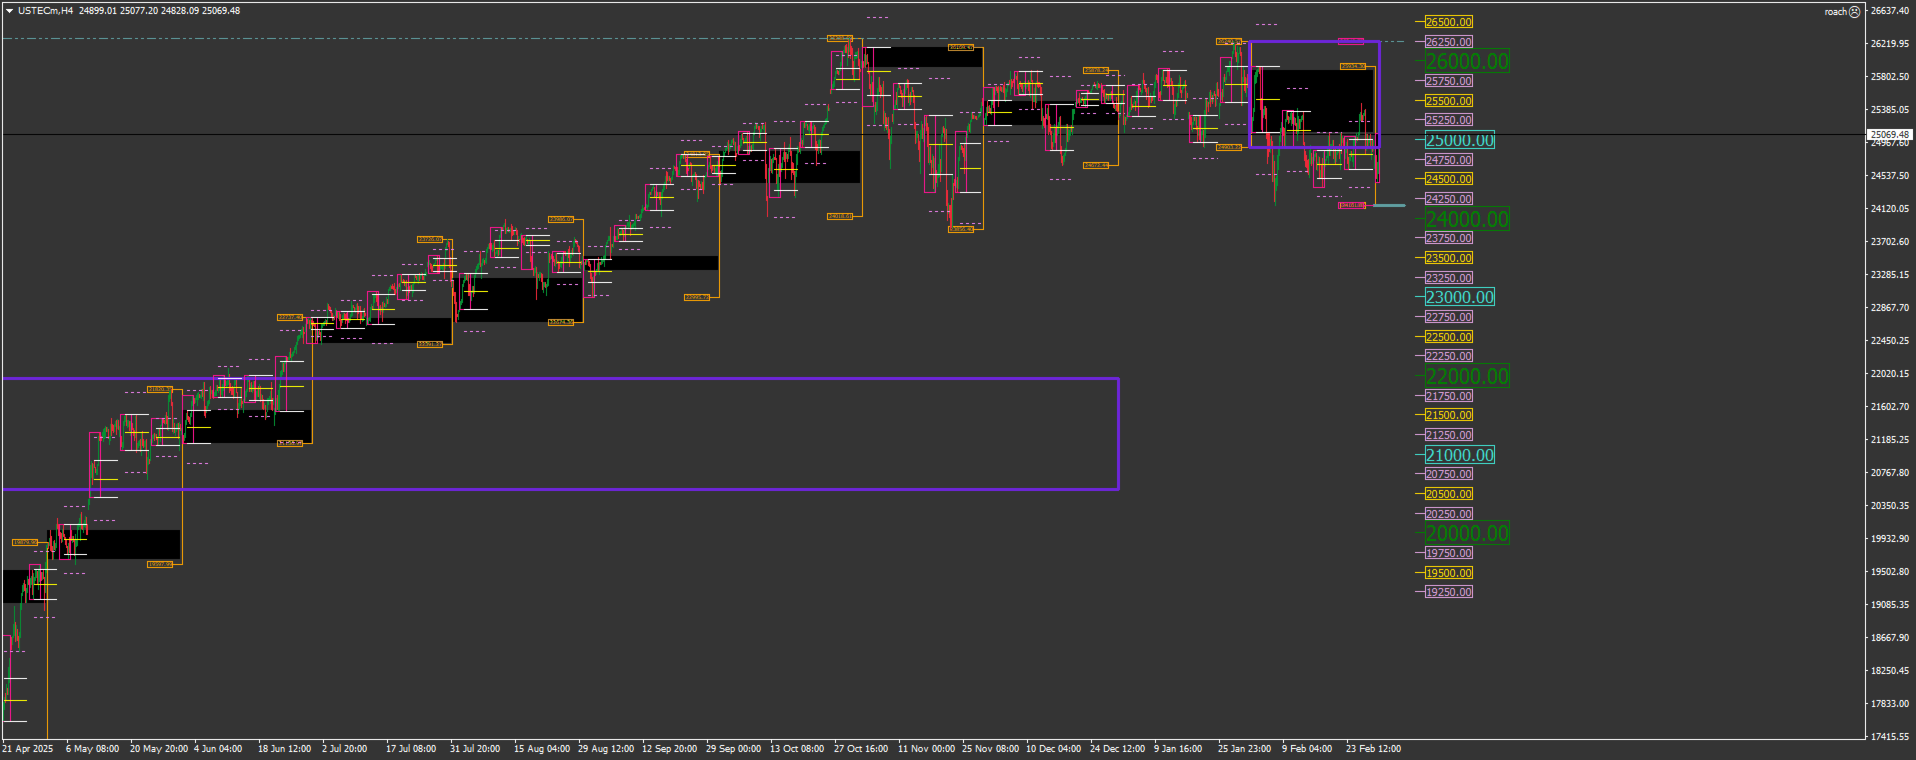
  • Page lines(which define the weekly page, an area in which price is most likely to trade within for the rest of the week, starting after the Tuesday abiter has formed)
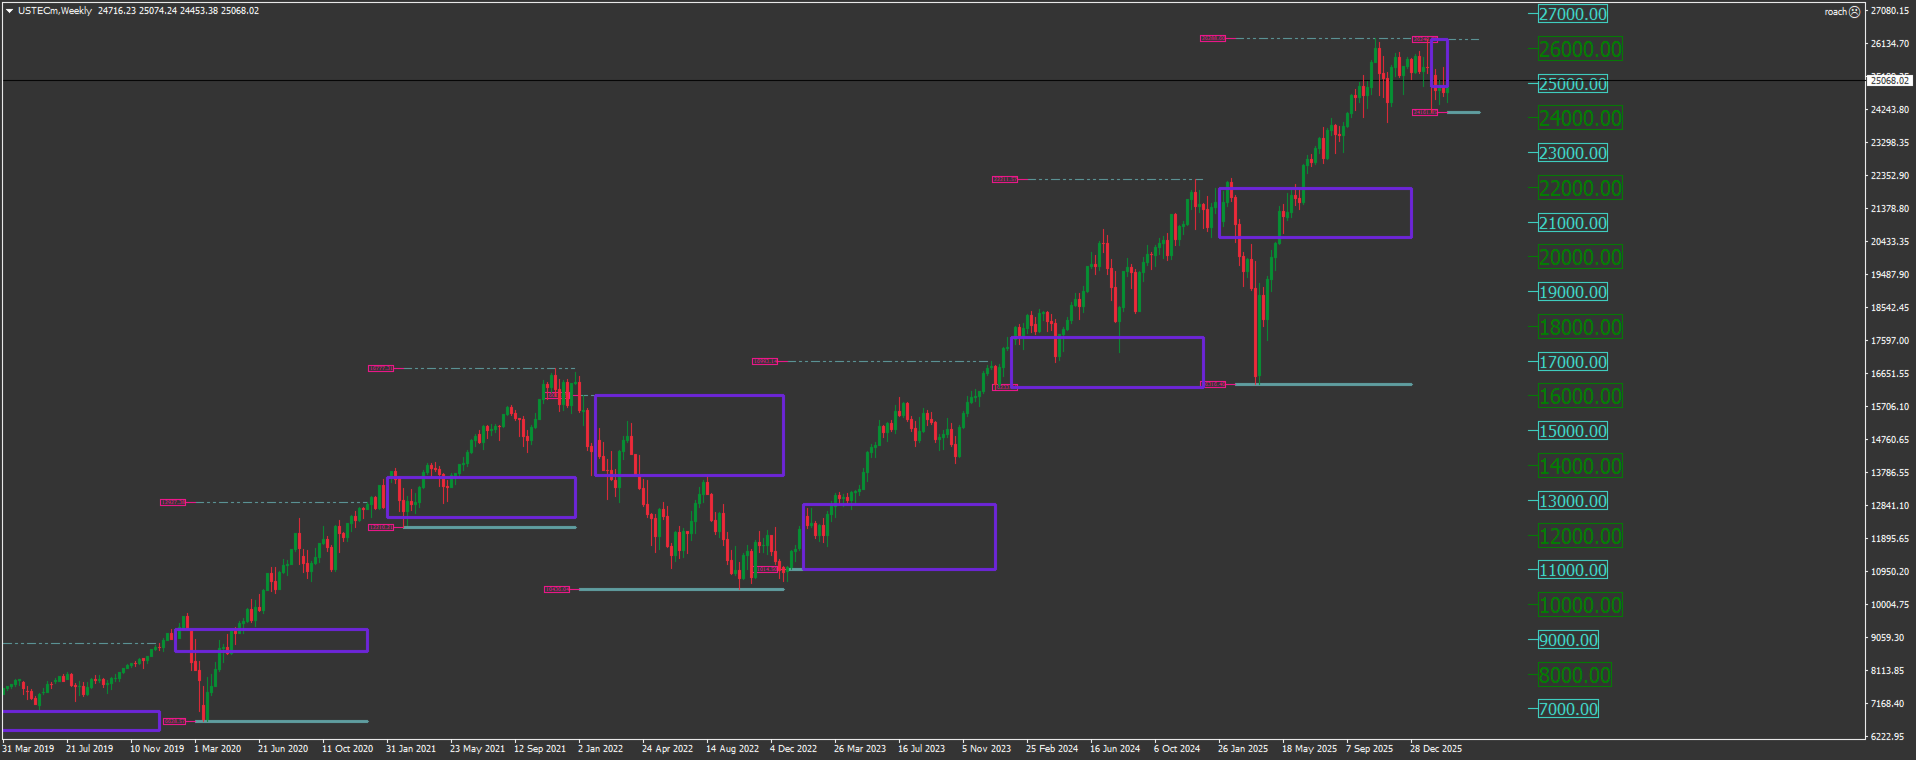
  • Ruler (a round numbers ruler allowing the trader to target algorithmic price levels)
  • Daily price action indicator (Breakout/pullback/trend)
  • Previous week and monthly, highs and lows
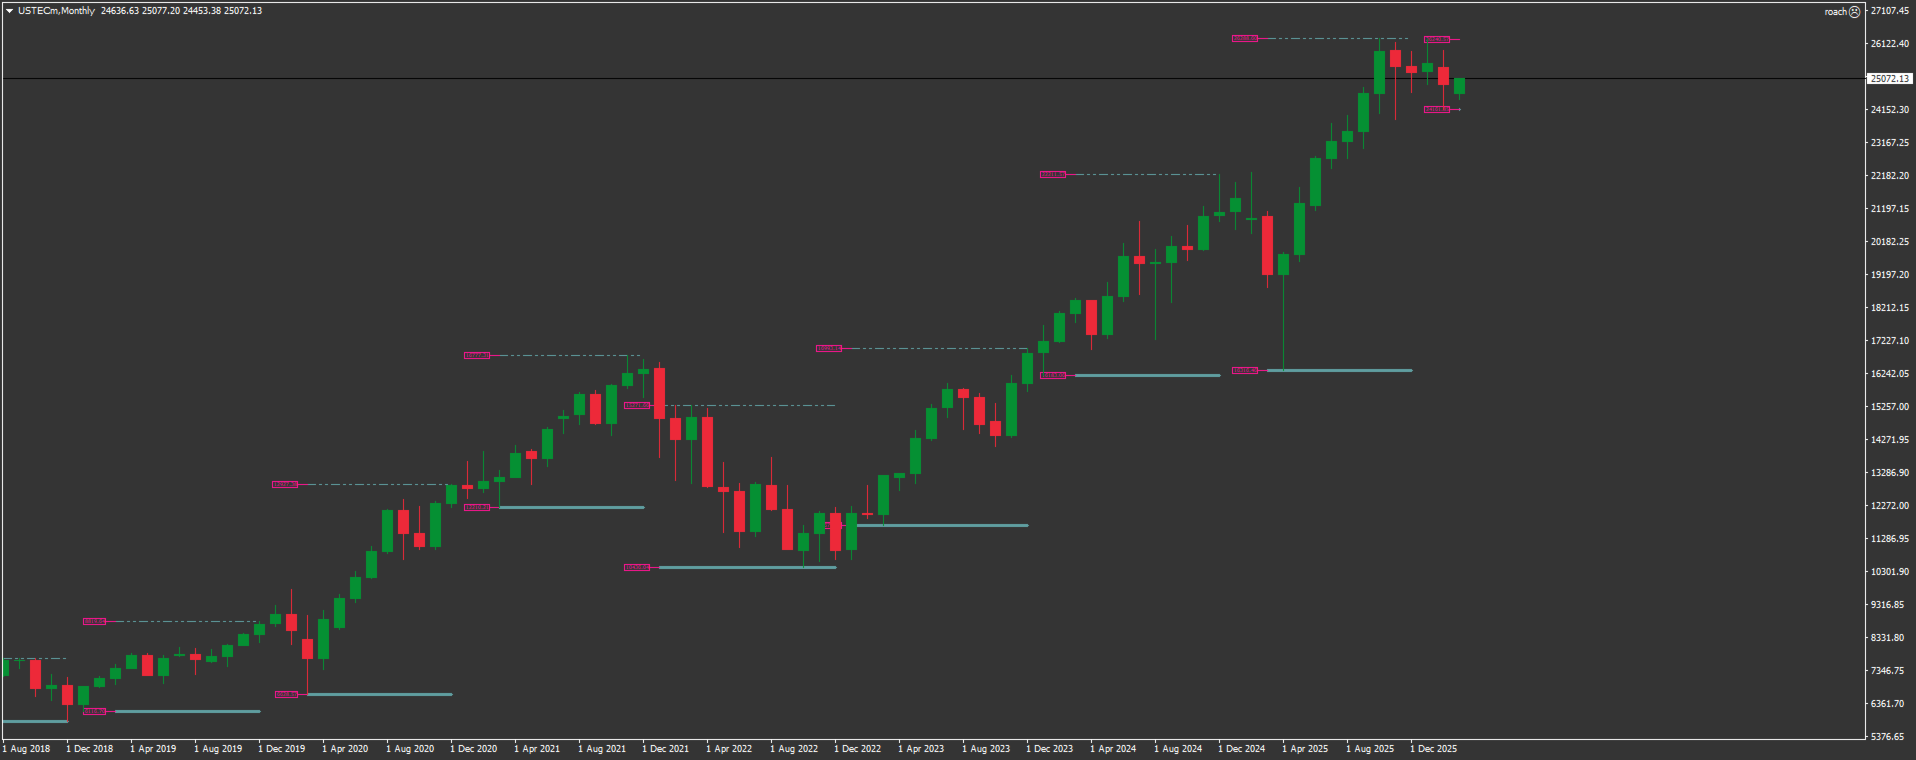
  • Yearly highs and lows
  • First day of the month(High and Low)
  • Fisrt monthy of the year(High and low)

Thes visuals enable the trader to formulate a robust trading plan based on areas of interest for the week. The idea is to start looking for opportunities once the weekly page has been established,

this happens once the EA has formed the Tuesday abiter. allowing the trader to trade anytime from 10H00 SAST provided price reaches the desired point of interest on the page lines.

This advisor is recommended to be used along with concepts of range expansions, where the algorithm seeks to expand the weekly range.


Enjoy!!!

추천 제품
Cosmic Nebula
Pieter Gerhardus Van Zyl
Cosmic Nebula is an advanced MT4 momentum and trend-state oscillator that transforms classical ADX directional flow into a multi-state market structure model. By combining directional pressure, triple-EMA (TEMA) smoothing, and weighted signal comparison, it visualizes market conditions as distinct “cosmic phases,” allowing traders to instantly recognize trend strength, transitions, and exhaustion. The indicator runs in a separate window and plots four color-coded histogram states around a zero e
SMC Venom Model BPR 지표는 Smart Money(SMC) 개념 내에서 일하는 트레이더를 위한 전문 도구입니다. 가격 차트에서 두 가지 주요 패턴을 자동으로 식별합니다. FVG (공정 가치 갭)는 3개의 캔들의 조합으로, 첫 번째와 세 번째 캔들 사이에 갭이 있습니다. 이는 볼륨 지원이 없는 레벨 사이에 구역을 형성하여 종종 가격 수정으로 이어집니다. BPR (균형 가격 범위)은 두 개의 FVG 패턴의 조합으로, "브리지"를 형성합니다. 이는 가격이 낮은 볼륨 활동으로 움직일 때 브레이크아웃과 레벨로의 복귀 구역으로, 캔들 사이에 갭을 생성합니다. 이러한 패턴은 거래자가 차트에서 거래량과 가격 역학을 분석하여 주요 지지/저항 수준, 돌파 구역 및 진입 지점을 식별하는 데 도움이 되며, 여기서 대형 시장 참여자와 일반 참여자 간의 상호 작용이 발생합니다. 이 지표는 사각형과 화살표 형태로 패턴을 시각화하며 유연한 경고 설정도 지원합니다. 주요 특징: 패턴 표시 모드:
VR Cub
Vladimir Pastushak
VR Cub 은 고품질 진입점을 얻는 지표입니다. 이 지표는 수학적 계산을 용이하게 하고 포지션 진입점 검색을 단순화하기 위해 개발되었습니다. 지표가 작성된 거래 전략은 수년 동안 그 효율성을 입증해 왔습니다. 거래 전략의 단순성은 초보 거래자라도 성공적으로 거래할 수 있다는 큰 장점입니다. VR Cub은 포지션 개시 지점과 이익 실현 및 손절매 목표 수준을 계산하여 효율성과 사용 편의성을 크게 높입니다. 간단한 거래 규칙을 이해하려면 아래 전략을 사용한 거래 스크린샷을 살펴보세요. 설정, 세트 파일, 데모 버전, 지침, 문제 해결 등은 다음에서 얻을 수 있습니다. [블로그] 다음에서 리뷰를 읽거나 작성할 수 있습니다. [링크] 버전 [MetaTrader 5] 진입점 계산 규칙 포지션 개설 진입점을 계산하려면 VR Cub 도구를 마지막 최고점에서 마지막 최저점까지 늘려야 합니다. 첫 번째 지점이 두 번째 지점보다 빠른 경우, 거래자는 막대가 중간선 위에서 마감될 때까지 기다립니다
Auto Fibo Pro m
DMITRII GRIDASOV
"Auto FIBO Pro" Crypto_Forex 지표 - 거래에 유용한 보조 도구입니다! - 지표는 자동으로 Fibo 수준과 로컬 추세선(빨간색)을 계산하여 차트에 배치합니다. - Fibonacci 수준은 가격이 반전될 수 있는 주요 영역을 나타냅니다. - 가장 중요한 수준은 23.6%, 38.2%, 50%, 61.8%입니다. - 역전 스캘핑이나 존 그리드 거래에 사용할 수 있습니다. - Auto FIBO Pro 지표를 사용하여 현재 시스템을 개선할 수 있는 기회도 많습니다. - Info Spread Swap Display가 있습니다. 현재 Spread와 Swap이 부착된 외환 쌍을 표시합니다. - 디스플레이에는 계정 잔액, 자본 및 마진도 표시됩니다. - 차트의 어느 모서리에서나 Info Spread Swap Display를 찾을 수 있습니다. 0 - 왼쪽 상단 모서리, 1 - 오른쪽 상단, 2 - 왼쪽 하단, 3 - 오른쪽 하단. 여기를 클릭하여 고품질 트레이딩 로봇과
캔들의 종가를 예측하는 지표입니다. 지표는 주로 D1 차트에서 사용하기 위한 것이. 이 지표는 전통적인 외환 거래와 바이너리 옵션 거래 모두에 적합합니다. 지표는 독립형 거래 시스템으로 사용하거나 기존 거래 시스템에 추가로 사용할 수 있습니다. 이 표시기는 현재 양초를 분석하여 양초 본체 내부의 특정 강도 요인과 이전 양초의 매개변수를 계산합니다. 따라서 지표는 시장 움직임의 추가 방향과 현재 양초의 종가를 예측합니다. 이 방법 덕분에 지표는 단기 및 중장기 거래 모두에 적합합니다. 지표를 사용하면 시장 상황을 분석하는 동안 지표가 생성할 잠재적 신호의 수를 설정할 수 있습니다. 표시기 설정에는 이를 위한 특별한 매개변수가 있습니다. 또한 인디케이터는 새로운 신호에 대해 차트의 메시지 형태, 이메일 및 PUSH 알림 형태로 알릴 수 있습니다. 구매 후 저에게 꼭 써주세요! 나는 당신에게 지표와 거래에 대한 나의 추천을 줄 것입니다! 또한 보너스를 받으세요!
Noize Absorption Index MT4
Ekaterina Saltykova
5 (1)
Noize Absorption Index - is the manual trading system that measures the difference of pressure between bears forces and bulls forces. Green line - is a noize free index that showing curent situation. Zero value of index shows totally choppy/flat market.Values above zero level shows how powerfull bullish wave is and values below zero measures bearish forces.Up arrow appears on bearish market when it's ready to reverse, dn arrow appears on weak bullish market, as a result of reverse expectation. S
Super Reversal Pattern
Parfait Mujinga Ndalika
Super Reversal Pattern Indicator Unlock the power of advanced pattern recognition with our Super Reversal Pattern Indicator. Designed for traders seeking precision and reliability, this indicator identifies one of the most effective reversal patterns in technical analysis, offering a significant edge in your trading strategy. Key Features: Non-Repainting Accuracy: Enjoy the confidence of non-repainting technology. Once a Super Reversal Pattern is detected, it remains static, providing consiste
"Impulses and Corrections 4" is created to help traders navigate the market situation. The indicator shows multi-time frame upward and downward "Impulses" of price movements. These impulses are the basis for determining the "Base" , which is composed of zones of corrections of price movements, as well as "Potential" zones for possible scenarios of price movement. Up and down impulses are determined based on a modified formula of Bill Williams' "Fractals" indicator. The last impulse is always "U
TWO PAIRS SQUARE HEDGE METER INDICATOR Try this brilliant 2 pairs square indicator It draws a square wave of the relation between your two inputs symbols when square wave indicates -1 then it is very great opportunity to SELL pair1 and BUY Pair2 when square wave indicates +1 then it is very great opportunity to BUY pair1 and SELL Pair2 the inputs are : 2 pairs of symbols         then index value : i use 20 for M30 charts ( you can try other values : 40/50 for M15 , : 30 for M30 , : 10 for H1 ,
Trendiness Index
Libertas LLC
5 (3)
"The trend is your friend" is one of the best known sayings in investing, because capturing large trendy price movements can be extremely profitable. However, trading with the trend is often easier said than done, because many indicators are based on price reversals not trends. These aren't very effective at identifying trendy periods, or predicting whether trends will continue. We developed the Trendiness Index to help address this problem by indicating the strength and direction of price trend
Awesome Oscillator by Bill Williams with the ability to fine-tune and replace the averaging algorithms of the indicator, which significantly expands the possibilities of using this oscillator in algorithmic trading and brings it closer in its properties to such an indicator as the MACD. To reduce price noise, the final indicator is processed with an additional Smooth averaging. The indicator has the ability to give alerts, send mail messages and push signals when the direction of movement of th
Trend Ray
Andriy Sydoruk
The indicator shows the potential trend direction by cyclical-wave dependence. Thus, all the rays of the intersection will be optimal rays, in the direction of which the price is expected to move, taking into account the indicator period. Rays can be used as a direction for potential market movement. But we must not forget that the approach must be comprehensive, the indicator signals require additional information to enter the market.
우리의 Basic Support and Resistance 표시기는 기술 분석을 향상시키는 데 필요한 솔루션입니다.이 표시기는 차트/ MT5 버전 특징 피보나치 수준의 통합 : 지원 및 저항 수준과 함께 피보나치 수준을 표시하는 옵션과 함께, 우리의 지표는 시장 행동과 가능한 역전 영역에 대한 더 깊은 통찰력을 제공합니다. 성능 최적화 : 각 막대의 개구부에서만 확장 라인을 업데이트하는 옵션을 사용하여, 우리의 지표는 지원 및 저항 수준의 정확도를 희생하지 않고 최적의 성능을 보장합니다. 입력 주요 설정 Timeframe:  이 입력을 통해 차트에 더 높은 기간의 지지선과 저항선을 표시하도록 선택할 수 있습니다. Support/Resistance Strength [Number of Bars]:  이 입력을 사용하면 지지대와 저항의 강도를 결정할 수 있습니다.숫자가 높을수록지지/저항이 더 강해집니다. Price mode: 이 매개 변수를 사용하면 지원 및 저항 수준을 계산하는
Phase Analytics Pro: Advanced Cyclic Market Analyzer Phase Analytics Pro is a sophisticated technical tool designed for traders who prioritize mathematical precision over lag-heavy traditional indicators. Based on the principles of digital signal processing, this indicator decomposes price action into phase and quadrature components to identify the dominant market cycle. How it works: The algorithm calculates the instantaneous phase of the market, allowing it to distinguish between trending and
Crypto_Forex 지표 "Morning Star pattern" for MT4. - 지표 "Morning Star pattern"은 가격 액션 거래에 매우 강력한 지표입니다. 다시 칠할 필요 없고 지연도 없습니다. - 지표는 차트에서 강세 Morning Star 패턴을 감지합니다. 차트에 파란색 화살표 신호가 있습니다(그림 참조). - PC, 모바일 및 이메일 알림이 있습니다. - 또한 형제인 약세 "Evening Star pattern" 지표도 사용할 수 있습니다(아래 링크를 따라가세요). - 지표 "Morning Star pattern"은 지지/저항 수준과 결합하기에 매우 좋습니다. 여기를 클릭하여 고품질 트레이딩 로봇과 지표를 확인하세요! 이것은 이 MQL5 웹사이트에서만 제공되는 오리지널 제품입니다.
PZ Harmonacci Patterns
PZ TRADING SLU
3.17 (6)
Trade smarter, not harder: Empower your trading with Harmonacci Patterns This is arguably the most complete harmonic price formation auto-recognition indicator you can find for the MetaTrader Platform. It detects 19 different patterns, takes fibonacci projections as seriously as you do, displays the Potential Reversal Zone (PRZ) and finds suitable stop-loss and take-profit levels. [ Installation Guide | Update Guide | Troubleshooting | FAQ | All Products   | Get Help ] It detects 19 differen
Professional Opening Range Breakout (ORB) indicator designed for precision session trading with automatic time handling, breakout alerts, and advanced target levels. This indicator automatically identifies the Opening Range for any configurable session, plots the High, Low, and Midpoint levels, and extends them across the trading day. Built-in breakout detection and alerts, range measurements, and extension targets provide traders with clear structure and actionable levels. Ideal for traders usi
Happy Scalping Indicator
Leandro Bernardez Camero
이 지표는 공격적인 스캘핑 과 바이너리 옵션에서 빠른 진입 을 위해 설계되었습니다 , 각 캔들 마다 신호를 생성하여 언제든지 무엇이 일어나고 있는지 정확히 알 수 있습니다. Happy Scalping 채널에 가입하세요: MQL5 재작성 없음 : 현재 캔들의 신호는 실시간 으로 생성됩니다. 이는 캔들이 아직 형성 중일 때 가격이 이전 캔들의 종가에 비해 상승하거나 하락하는지에 따라 신호가 변경될 수 있음을 의미합니다. 그러나 캔들이 닫히면 , 신호의 색상은 완전히 고정됩니다 . 변경되지 않으며, 사라지지 않고, 이동하지 않습니다. 보이는 그대로 남습니다. 왜 이렇게 설계되었나요? 많은 스캘퍼들은 특히 가격의 돌파나 급격한 움직임 이 있을 때 즉시 신호를 받는 것을 선호합니다. 이를 통해 그런 빠른 피프스를 바로잡을 수 있습니다. 반면, 일부 트레이더는 닫힌 캔들로 확인을 기다리는 것 을 선호하며, 이 지표는 그들도 완벽하게 사용할 수 있습니다. 두 가지 접근 방식 모두 유효합니
Candlestick Pattern Scanner is a multi-timeframe and multi-symbol dashboard and alert system that checks all timeframes and currency pairs for different candlestick patterns that are formed in them. Scanner is integrated with support and resistance zones so you can check the candlestick patterns in the most important areas of the chart to find breakout and reversal patterns in the price chart. Download demo version   (works on M30,D1,W1 timeframes and 20 symbols of Market Watch window) Read the
Trade with Gann on your side!! MASTER CIRCLE 360 CIRCLE CHART, originally created by Gann admitted that this is “The Mother of all charts”. It is one of the last studies that this great trader left for us. The numeric tab le is apparently quite simple like all the tables and is based on square numbers, the SQUARE OF 12 and is by evolution, one of the most important square numbers. Here we can find CYCLE, PRICE AND TIME thanks to angles and grades, to show past and future support and resistance.
We present you the indicator "Candle closing counter", which will become your indispensable assistant in the world of trading. That’s why knowing when the candle will close can help: If you like to trade using candle patterns, you will know when the candle will be closed. This indicator will allow you to check if a known pattern has formed and if there is a possibility of trading. The indicator will help you to prepare for market opening and market closure. You can set a timer to create a pre
Vizzion
Joel Protusada
Vizzion is a fully automated scalping Expert Advisor that can be run successfully using GBPJPY currency pair at H1 timeframe. Very Important This Expert Advisor can not run with any EAs in the same account. As part of the money management plan, it calculates and monitors the Margin Level % and assumes that all open trades are created by it. If you want an Expert Advisor that trades in a daily basis, this EA is not for you because using this requires a patience to wait for a few days or weeks on
The indicator displays the data of the Stochastic oscillator from a higher timeframe on the chart. The main and signal lines are displayed in a separate window. The stepped response is not smoothed. The indicator is useful for practicing "manual" forex trading strategies, which use the data from several screens with different timeframes of a single symbol. The indicator uses the settings that are identical to the standard ones, and a drop-down list for selecting the timeframe. Indicator Paramet
ProEngulfing
Ashkan Hazegh Nikrou
4.5 (2)
ProEngulfing 소개 - MT4용 전문 Engulf 패턴 인디케이터 정밀도의 힘을 발휘하세요. ProEngulfing은 외환 시장에서 자격이 있는 Engulf 패턴을 식별하고 강조하기 위해 설계된 첨단 인디케이터로, MetaTrader 4용으로 개발되었습니다. ProEngulfing은 Engulf 패턴을 정확하게 식별하고 강조하기 위한 철저한 접근 방식을 제공하여 거래 결정에 대한 가장 신뢰할 수 있는 신호만을 제공합니다. ProEngulfing이 작동하는 방식: ProEngulfing은 Engulf 패턴을 분석하기 위해 정교한 알고리즘을 사용하여 패턴 인식 이상의 기능을 제공하여 이러한 패턴이 실제로 자격이 있는지 확인합니다. 다음은 그 작동 방식입니다. 자격 기준: 이 인디케이터는 몸통의 백분율을 전체 양초 크기와 비교하고 그림자의 백분율을 양초 크기와 비교합니다. 이 세심한 평가를 통해 고확률 Engulf 패턴만이 주목받도록 보장됩니다. 연속성 확인: ProEngulf
For sure, this indicator has become very popular amongst traders. Through coding this indicator will give you the most accurate levels possible for your trading analysis. We have also added in the ability for you to receive alerts when the price breaks above or below a Support or Resistance lines! HOW TO USE The red rectangles represent your resistance/supply zone. The green rectangles represent your support/demand zone.  BONUS FEATURES We coded this indicator with the ability to switch between
Meta Sniper
Samir Tabarcia
Requirements Optimized to work with   EURUSD-EURCHF-USDJPY, AUDUSD-CADJPY-AUDNZD, CHFJPY-NZDJPY-NZDUSD For timeframe 4H. *(Minimum recommended deposit is $300 for each Pair) for initial lot set to 0.10, My favorite Pair are (CHFJPY-NZDJPY-EURUSD-AUDNZD-USDJPY) Warning it will be SALE only 5 Copys at 60$ Then it will be update up to 200$  You can use it the way it is, For new Set Files will be add on (Comments) ECN broker with low spread is recommended to get better results. Setup is very e
Matrixs
Andriy Sydoruk
Matrix is a Forex arrow indicator. Displays signals simply and clearly! The arrows show the direction of the transaction, and are colored accordingly, which can be seen in the screenshots. As you can see, trading with such an indicator is easy. I waited for an arrow to appear in the desired direction - I opened a deal. An arrow formed in the opposite direction - closed the deal. The indicator also displays the lines with the help of which the arrow signals are formed, taking into account the int
URGENCY “Limited launch pricing” “Price increases after version 2.0” Currencies Gold Momentum Flow Dashboard  — See Market Strength Instantly A powerful all-in-one dashboard that shows real-time momentum across multiple timeframes (M5–D1) for forex and gold. Multi-timeframe ROC analysis Built-in trade signals (alignment & momentum shifts) Currency strength meter Heatmap for instant trend recognition Alerts + one-click pair switching Stop switching charts — see the entire market in
ChangePeriod MT4
Kazuya Yamaoka
You can change the time period of the chart at the touch of a button. You can also change multiple charts at the touch of a button. You can also change multiple charts at the touch of a button, saving you the trouble of changing time periods. We are live-streaming the actual operation of the system. https://www.youtube.com/@ganesha_forex We do not guarantee your investment results. Investments should be made at your own risk. We sharll not be liable for any disadvantage or damage caused by th
RSI Speed mp
DMITRII GRIDASOV
MT4용 Crypto_Forex 지표 "RSI SPEED" - 훌륭한 예측 도구, 재도색 불필요 - 이 지표는 물리학 방정식을 기반으로 계산됩니다. RSI SPEED는 RSI 자체의 1차 미분값입니다. - RSI SPEED는 주요 추세 방향으로 스캘핑 진입에 유용합니다. - HTF MA(그림 참조)와 같은 적절한 추세 지표와 함께 사용하세요. - RSI SPEED 지표는 RSI 자체의 방향이 얼마나 빨리 변하는지를 보여주며, 매우 민감합니다. - 모멘텀 거래 전략에는 RSI SPEED 지표 사용을 권장합니다. RSI SPEED 지표 값이 0보다 작으면 가격 모멘텀이 하락하고, 0보다 크면 가격 모멘텀이 상승합니다. - 모바일 및 PC 알림 기능이 내장되어 있습니다. 여기를 클릭하여 고품질 트레이딩 로봇과 지표를 확인하세요! 본 제품은 MQL5 웹사이트에서만 제공되는 정품입니다.
이 제품의 구매자들이 또한 구매함
The product will copy all telegram signal to MT4   ( which you are member  ) , also it can work as remote copier.  Easy to set up, copy order instant, can work with almost signal formats, image signal, s upport to translate other language to English Work with all type of channel or group, even channel have "Restrict Saving Content", work with  multi channel, multi MT5 Work as remote copier: with signal have ticket number, it will copy exactly via ticket number. Support to backtest signal. How to
Custom Alerts AIO: 다중 시장을 동시에 모니터링 – 설정 없이 즉시 사용 가능 개요 Custom Alerts AIO 는 복잡한 설정 없이 즉시 사용할 수 있는 통합 시장 모니터링 도구입니다. FX Power, FX Volume, FX Dynamic, FX Levels, IX Power 등 필요한 모든 지표가 내장되어 있어 별도의 설치나 구성 없이 알림 기능을 바로 사용할 수 있습니다. 차트 그래픽 없이 작동하며, Forex, 금속, 지수, 암호화폐 등 주요 자산군을 모두 지원합니다. 주식(Symbols)은 별도로 입력하여 추가할 수 있으나, MetaTrader에서는 일반적으로 제한적으로만 사용됩니다. 1. 왜 Custom Alerts AIO를 선택해야 하나요? 추가 라이선스가 필요 없습니다 • 모든 Stein Investments 지표가 내장되어 있어 별도 구매가 필요 없습니다. • 즉시 알림 기능을 시작할 수 있어 빠르고 간편합니다. 모든 시장을 하나의 도구로
ManHedger MT4
Peter Mueller
5 (2)
THIS EA IS A SEMI-AUTO EA, IT NEEDS USER INPUT. Manual & Test Version Please TEST this product before   BUYING  and watch my video about it. Contact me for user support or bug reports, or if you want the MT5 version! MT5 Version I do not guarantee any profits or financial success using this EA. With this Expert Advisor, you can: Implement your own   Zone Recovery   strategy to capitalize on trending markets. Create   Grid   trading strategies, to profit from ranging markets. Place orders easil
The product will copy all  Discord  signal   to MT4   ( which you are member  ) , also it can work as remote copier.  Easy to set up. Work with almost signal formats, support to translate other language to English Work with multi channel, multi MT4. Work with Image signal. Copy order instant, auto detect symbol. Work as remote copier: with signal have ticket number, it will copy exactly via ticket number. How to setup and guide: Let read all details about setup and download Discord To MetaTrader
Crystal Trade Manager PRO – MT4 고급 리스크 및 트레이드 관리 시스템 무료 버전: https://www.mql5.com/en/market/product/150632 개요 Crystal Trade Manager PRO(CTM)는 MetaTrader 4를 위한 전문급 거래 실행 및 리스크 관리 유틸리티입니다. 엄격한 실행, 견고한 자본 보호, 그리고 똑똑한 자동화를 필요로 하는 트레이더를 위해 설계되었습니다. 본 시스템은 계좌 리스크를 관리하고, 자본(EQ)을 보호하며, 일일 제한을 적용하고, SL/TP를 자동으로 설정하며, 전문급 기능을 갖춘 초고속 원클릭 트레이딩 패널을 제공합니다. Prop Firm 챌린지, 데이트레이딩, 스캘핑, 포트폴리오 매니저에게 최적화되어 있습니다. MT5 버전도 제공됩니다. 주요 기능 1. 고급 리스크 및 드로우다운 보호 기능 하루 드로우다운을 1%~70% 범위에서 설정 가능 설정한 한도를 초과할 경우 모든 포지션 즉시 종료 조건
Unlimited Trade Copier Pro is a tool to copy trade remotely to multiple MT4, MT5 and cTrader accounts at different computers/locations over internet. This is an ideal solution for you if you are a signal provider and want to copy your trades to other receivers globally on your own rules. One provider can copy trades to multiple receivers and one receiver can get trade from multiple providers as well. The provider can even set the subscription expiry for each receiver, so that receiver will not b
--------------Welcome to use [MQL5 Signal Analyze Master]------------------  Function: Draw order tracks of MQL5 MT4 and MT5 signal on MT4 chart. [Using guide] 1.Use it as Experts. 2.Download history record from MQL5 signal(MT4 signal or MT5 signal).  3.Paste history record file below "MQL4/Files/" 4.Load [Signal Analyze Master] on the symbol chart what you want to analyze. 5.Paste the history record file name to parameter 'FileName' 6.Select  SignalType  match the history you download on MT4
EasyInsight AIO MT4
Alain Verleyen
4 (2)
EASY Insight AIO – 스마트하고 손쉬운 트레이딩을 위한 올인원 솔루션 개요 외환, 금, 암호화폐, 지수, 심지어 주식까지 — 전 시장을 몇 초 만에, 수동 차트 확인이나 복잡한 설치, 인디케이터 설정 없이 스캔할 수 있다고 상상해 보세요. EASY Insight AIO 는 AI 기반 트레이딩을 위한 궁극의 플러그 앤 플레이(Plug & Play) 데이터 내보내기 도구입니다. 단 하나의 깔끔한 CSV 파일로 전체 시장 스냅샷을 제공하며, ChatGPT, Claude, Gemini, Perplexity 등 다양한 AI 플랫폼에서 즉시 분석할 수 있습니다. 창 전환, 복잡함, 차트 오버레이는 더 이상 필요 없습니다. 자동으로 내보내지는 순수하고 구조화된 데이터 인사이트만으로, 반복적인 차트 감시 대신 데이터 기반의 스마트한 의사결정에 집중할 수 있습니다. 왜 EASY Insight AIO인가요? 진정한 올인원 • 별도의 설정, 인디케이터 설치, 차트 오버레이가 필요 없습
Strategy Builder offers an incredible amount of functionality. It combines a trade panel with configurable automation (covert indicators into an EA), real-time statistics (profit & draw down) plus automatic optimization of SL, TP/exit, trading hours, indicator inputs. Multiple indicators can be combined into an single alert/trade signal and can include custom indicators, even if just have ex4 file or purchased from Market. The system is easily configured via a CONFIG button and associated pop-up
Live Forex Signals 사이트 신호에 거래를 위해 설계   https://live-forex-signals.com/en   그리고  https://foresignal.com/en   . Live Forex Signals for MetaTrader 5  https://www.mql5.com/ru/market/product/81448 매개 변수 사용자 이름 및 암호는 사이트에 가입 한 경우 live-forex-signals.com/foresignal.com 구독이 없으면 필드를 비워 둡니다; 댓글 개설 된 거래에 대한 댓글 위험 위험 거래에 대한 예금의 백분율로,위험=0 인 경우,다음 값 많이 사용됩니다 거래에 대한 많은 고정 볼륨 사이트에서 이익을 가져 가라 웹 사이트에서 정지 손실을 사용 빈도신호업데이트고문의 사이트 방문 빈도 분 최대 스프레드무역에 허용되는 최대 스프레드를 거래합니다.스프레드가 더 높으면 보류 중인 주문 세트가 취소됩니다 사용트레일링 사용 후행 정지
The FFx Hidden Manager panel will help you to manage easily your orders directly on the chart. Below all features described: TP, SL and TrailingStop are hidden Each order has its own lines on chart Drag & Drop any line to change the TP/SL as per your need Option to move automatically the SL line at breakeven when TP #1 is reached Option to choose the TP/SL type (by pips or price) Option to choose the TrailingStop type (by pips, MA, Fractals, PSAR or ATR) Define which order(s) you want to manage
FFx Risk Calculator panel will help you to calculate very easily your trades size, SL or the risk directly on the chart. All features are described below: Option to select which parameter to calculate: Risk, Stop Loss or Lot Size The panel will show if the lot size is allowed according to the current account free margin Button to maximize/minimize the panel Drag and Drop the panel anywhere on the chart How to use it? Select the parameter you want to be calculated. It will be based on the 2 other
News Trader Pro
Vu Trung Kien
4.38 (16)
News Trader Pro is a unique robot that allows you to trade the news by your predefined strategy. It loads every piece of news from several popular Forex websites. You can choose any news and preset the strategy to trade it, and then News Trader Pro will trade that news by selected strategy automatically when the news comes. News release gives opportunity to have pips since the price usually has big move at that time. Now, with this tool, trading news becomes easier, more flexible and more exciti
FFx Watcher PRO
Eric Venturi-Bloxs
The FFx Watcher PRO is a dashboard displaying on a single chart the current direction of up to 15 standard indicators and up to 9 timeframes. It has 2 different modes: 1. Watcher mode: Multi Indicators User is able to select up to 15 indicators to be displayed User is able to select up to 9 timeframes to be displayed 2. Watcher mode: Multi Pairs User is able to select any number of pairs/symbols User is able to select up to 9 timeframes to be displayed This mode uses one of the standard indicat
Transaction Repeater Full
Alexandr Bryzgalov
5 (4)
Copies transactions between MT4 terminals. Possibilities: quick copy start minimum processor load direct and reverse (reverse) copying. copying Take Profit and Stop Loss levels copying deferred and their changes copy transactions one to many copy trades many to one local copy only Attention: The product is designed for copying trades only within a single computer or VPS with access to the desktop. The product will not work on the built-in Virtual Hosting of the terminal. We will help you set up
The product combines a manual trade panel with the ability to perform actions automatically in a highly configurable way. Actions include capturing indicator values and then based on those values raising alerts, open/close or partially close trades, scale-in, setting up pending orders, adjusting stop loss, take profit and more. On-chart controls can be configured, such as tick boxes and buttons, so can be fully interactive. The EA also handles money management, news events, hidden stop loss, tak
Elliott Wave Counter는 Elliott 파동의 빠르고 사용자 친화적인 수동 마크업을 위한 패널입니다. 색상과 마크 수준을 선택할 수 있습니다. 도구에서 만든 마지막 마크업과 전체 마크업을 제거하는 기능도 있습니다. 한 번의 클릭으로 마크업이 이루어집니다. 5번 클릭 - 5개의 웨이브가 있습니다! Elliott Wave Counter는 Elliott 파동의 초보자와 전문 분석가 모두에게 훌륭한 도구가 될 것입니다. Elliott Wave Counter 설치 및 입력 가이드 당신이 얻고 싶다면       EA 추가 URL(   http://autofxhub.com   ) MT5 터미널에 대한   알림   (스크린샷 참조). MT4 버전   https://www.mql5.com/en/market/product/14016 MT5 버전   https://www.mql5.com/en/market/product/15081 일반 입력: 웨이브 유형 버튼:   이 버튼을 사용하면 차트
If you wish to draw Support and Resistance lines, view: daily market opening, classical pivot levels, Fibonacci pivot levels, trend lines, Fibonacci levels, the remaining time to candle closing, and current spread. If you seek to place your orders with the exact lot that meets your desired stop loss risk. If you wish to do all this and more with just one click, then this is the perfect tool to use. This tool will allow you to feel more relaxed when deciding to open orders, as well as predicting
Unlimited Binary Options Copier Remote is a powerful tool to copy binary options trades remotely between multiple accounts at different locations over internet. This is an ideal solution for signal provider, who want to share his binary options trades with the others globally on his own rules. One provider can copy trades to unlimited receivers and one receiver can get trade from unlimited providers as well. The provider can set the subscription expiry for each receiver, so that receiver will no
This is an Expert Adviser use for manual trading as a background EA or combine with external EA to open orders. Loss Recovery Trading is one of your options to handle the lose positions instead of using stop loss by setting a zone recovery area and target to exit the turn rounds sequence. How It Work? If the market goes against your first positions direction at the specific of losing points, the EA will open an opposite direction position with calculated larger lot size and also keep the first
Professional and highly customizable utility for automated trading. It can become an indispensable to any trader regardless of the skills. It will help to save the time that would be required for daily routine activities and it will allow to develop custom strategies. The utility can also work manually opened orders and orders opened by any other EAs. This can be applied to attempt to recover the losing trades or even save the trader form losing the deposit. The utility allows to automate the tr
Telegram Publisher Agent는   거래자가 Telegram 채널 및 그룹에 실시간으로 신호를 보낼 수 있는 추가 기능입니다. 사용자 정의 가능한 메시지, 차트 스크린샷 및 기타 기능을 통해 이 도구는 트레이더가 트레이딩 통찰력과 전략을 팔로워와 공유할 수 있도록 도와줍니다. 이 도구는 또한 밝고 어두운 테마 스위치가 있는 아름다운 디자인을 특징으로 하여 사용자에게 미적 및 기능적인 거래 경험을 제공합니다. Telegram 게시자 에이전트는 모든 거래를 채널 및 그룹의 신호로 게시하도록 설계되었습니다. 거래를 제공하기만 하면 Telegram 게시자 에이전트가 버튼 클릭 한 번으로 거래 채널이나 그룹에 거래 신호를 보내는 모든 어려운 작업을 수행합니다. 텔레그램 게시자 에이전트       설치 및 입력 가이드 EA 추가 URL ( http://autofxhub.com ) MT4/MT5 터미널(스크린샷 참조) 에 대한 알림을 받으려면 . MT4 버전   https://ww
如果产品有任何问题或者您需要在此产品上添加功能,请联系我 Contact/message me if you encounter any issue using the product or need extra feature to add on the base version. There is Demo version of this panel Dashboard Babon Scalping System Demo in my product list, please try it out to get familiar with all functionalities for free, LINK . This system basically utilizes TDI, Heiken Ashi Trend, Price Trend on H1 time-frame and TMA on H1&H4 time-frame to generate the trend (big picture). Then the system will zoom in to genera
Pairs Trade
Oleg Pechenezhskiy
The Pairs Trade indicator is a utility for semi-automatic pair trading. It allows combining the charts of two arbitrary instruments, even if the schedules of their trading sessions are different. It displays a spread chart in the form of a histogram with an overlaying moving average. It calculates the swap that will be charged for the synthetic position (in the deposit currency). It is possible to set a level for automatic opening of a synthetic position on the spread chart (analogous to the 'se
Corporate Report
Pavel Verveyko
5 (1)
The script displays info about the share's corporate reports and dividends. The data is downloaded from   investing.com : Report date Profit per share (EPS) Revenue Market capitalization Amount of dividends Date of payment of dividends Dividend income The product cannot be tested in the tester (since it is not possible to receive data from the Internet). Before launching:  Add 2   URL   https://ru.investing.com/earnings-calendar/Service/getCalendarFilteredData  and   https://ru.investing.com/di
This Stacker EA will: Automatically set Stop loss on a new order Automatically set Take profit on a new order Stack (or open up to 4 additional orders at the same time) when a new order is placed, the SL/TP can be preset individually for each order. Provides a transparent replacement for the standard 1-click trading buttons in MetaTrader 4 (1 click still works and SL/TP will automatically be set as well as Stacking). Automatically calculate lot order size according to preset risk management perc
This small tool takes over the manually opened positions and treats them according to the predefined settings with the dynamic stop loss and Money Management, which predicts which position size should be used for the trade. The program dynamically tracks the stop loss as soon as the position comes into the plus. Possible commissions and swaps are taken into calculation. It should only be installed on one chart window per symbol. Settings LotRiskPercent = 25 - Percentage of the item size. Calcul
Currencies Cleaner panel will give you an overview of all the most traded market's currencies in a single click. First of all the panel will refresh all your charts, opening them four times in all timeframes needed. 1 - CURRENCIES It uses a complex algorithm to study the movement of 17 different indicators. It means that the algorithm not only "reads" the actual value of an indicator, but also creates a probability of success using the position of this value on the indicator and the last moveme
Buy or rent it and request a copy of the Antimartingale EA for free  Trendline based utility, you design your trendlines or horizontal lines, the EA opens trades for you Possibility to trade on break and/or bounce events Indipendent break and bounce settings Configurable market, stop and limit orders T1T2 Logic to lock profits and minimize losses Trailing Stop Loss Max Spread check Notifies you when your trendlines are crossed No strange trendline name or syntax, you decide the color of tr
FXFledgling Exit Tool is a complete risk management tool that analyzes both the open trades and the direction of the pair of open trades. As long as the suggested entry and lotsizing management presented here is followed strictly, you will have a high chance (but no guarantee) of surviving the trade. What It Does It is used as an exit tool. It helps the trader to manage any manual trade that he transacted. It does the following: Trail Stop Dynamic Stop Loss - a calculated stop-loss that changes
제작자의 제품 더 보기
Market Viewer
Matimu Romeo Ngoveni
Market Viewer This utility seeks to assist the trader in identifying potential areas of interest on the price chart. Different components integral to decision making have been automated, allowing the user to engage with perfectly calculated levels. Some components include the weeks initial balance, session Min and Max areas and a round number indicator altogether forming templates providing confidence to the trader. Have a look at the screenshots for a sneak peak into the components. The utility
FREE
Perspect
Matimu Romeo Ngoveni
Perspect EA This version of the EA focusses on indicating points of interest on the chart, features include : Sessions (Asia/Gap/London/Gap/NewYork/Gap) Previous Daily/Weekly/Monthly highs and  lows  Previous Daily/Weekly/Monthly open and close price Round numbers (Ruler) Opening range Initial balance Multi time frame (Yearly view, monthly opening range) Customizable chart templates for low light users   The indicator will assist in advanced technical analysis, providing the user with desired
FREE
DecisionTree
Matimu Romeo Ngoveni
This product has been developed to complement various proven range expansion strategies, with features like the Fibonacci retracement and session/range definition along round numbers indicator. All coming together to provide a clear visual of areas which can potential present the trader with a position or even a quick scalping of price action. Download the full version, and check it out for yourself!!!
FREE
필터:
리뷰 없음
리뷰 답변