Universal Harmonic Indicator
- 지표
- 버전: 1.0
- 활성화: 5

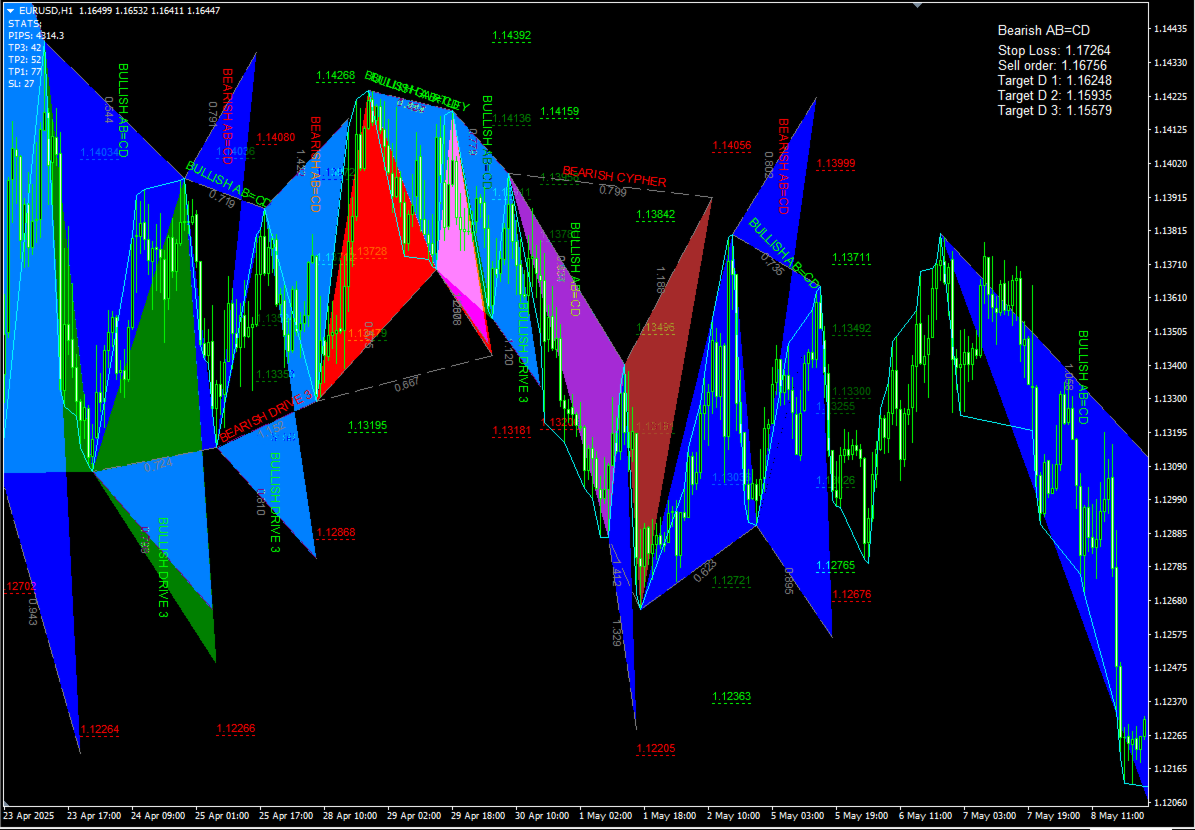
Harmonic based indicator.
Recognizes several patterns: ABCD, 3 Drives, Gartley, Butterfly, Bat, Atlternative Bat, Deep Bat, Crab, Deep Crab, Cypher and Shark.
Able to set SL and three levels of TP based on Fibonacci Levels.
Three types of alerts are available: PopUp, Email and Push.
Trade advices on chart and stats also printed for visual estimation.
All patterns are formed by not repainting ZigZiag. Parameters for it are classic: InpDepth, InpDeviation,InpBackstep.
MinComplete means the level of the pattern to keep it active (in percents).
Any questions please put in comments.