Magician Of Custom Index chart window
- 지표
-
BaiChun Li
 Strict Developing, strict testing, the attitude is serious, the price is reasonable!
Familiar with MQL4 and MQL5, familiar with the development of EA, index and script!
With more than 5 years of experience, a lot of code to the Chinese users!
skype:mangoLee@hotmail.com - 버전: 2.0
- 업데이트됨: 18 5월 2019
- 활성화: 5
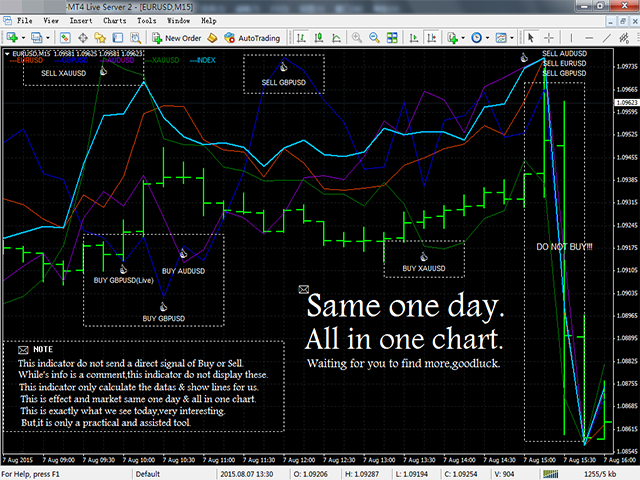
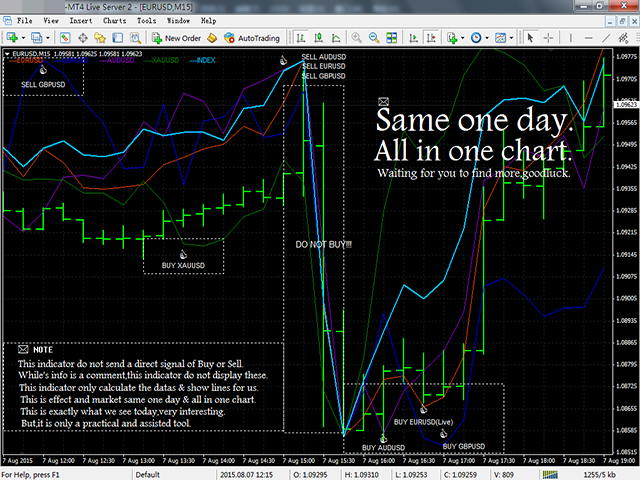
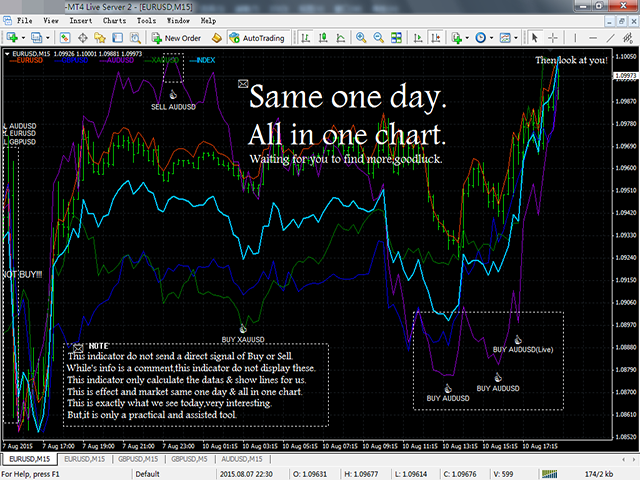
Charles Henry Dow felt that if the industrial average and the railroad average both moved in the same direction, it meant that a meaningful economic shift was occurring.
In brief, this indicator bases on the Dow's theory. It can create an index of market symbols, almost anythings index. For example: Index of the Euro, Index of the Great Britain Pound, Index of the Japanese Yen, Index of the Swiss Franc, Index of the Gold, Index of the New Zealand Dollar, Index of the Australian Dollar, Index of the Canadian Dollar.
Mr.Dow did not believe that his ideas should be used as the only forecaster of market ups and downs. He thought they should be only one tool of many that investors used to make business decisions.
The important, this indicator is not only to create an index. It can find symbols for deviation too. Then, I believe you know how to do.
Indicator parameters
This indicator has 5 lines so it has 5 group lines property, from 0 to 4, the last one is "INDEX":
- Indicator0_symbol - The 1st group line used symbol.
- Indicator0_color - The 1st group line used color.
- Indicator0_style - The 1st group line used style.
- Indicator0_width - The 1st group line used width.
- Indicator1_symbol - The 2nd group line used symbol.
- Indicator1_color - The 2nd group line used color.
- Indicator1_style - The 2nd group line used style.
- Indicator1_width - The 2nd group line used width.
- Indicator2_symbol - The 3th group line used symbol.
- Indicator2_color - The 3th group line used color.
- Indicator2_style - The 3th group line used style.
- Indicator2_width - The 3th group line used width.
- Indicator3_symbol - The 4th group line used symbol.
- Indicator3_color - The 4th group line used color.
- Indicator3_style - The 4th group line used style.
- Indicator3_width - The 4th group line used width.
- Indicator4_color - The 5th group line used color.
- Indicator4_style - The 5th group line used style.
- Indicator4_width - The 5th group line used width.
(The 5th group line no set name, it is a index.)
- Info_fontsize - Displayed information's font size in indicator.
- Info_corner - Displayed information's position.