MetaTrader 5용 Expert Advisor 및 지표 - 126

NEXA Trend Swing Pro v3 한국어 사용 설명서 (최종 버전) EMA 트렌드 + RSI + 모멘텀 + 볼륨 필터 + 멀티 스코어 시스템 기반 스윙 트레이딩 EA 1. EA 개요 NEXA Trend Swing Pro v3는 GOLD(XAUUSD)를 대상으로 H1 추세 + M30 트리거 조합을 사용하는
트렌드 추종형 스윙 알고리즘입니다. 이 전략은 단순한 EMA 크로스 전략이 아니라,
추세 강도 · RSI 구조 · 모멘텀 방향 · 거래량 변화 · 시장 레짐(Trend/Range/Spike)
까지 반영하는 5중 필터 기반 정교한 알고리즘 구조 를 갖고 있습니다. 본 버전은 **7년 장기 데이터 최적화(2018~2024)**를 통해
가장 안정적인 조합으로 파라미터가 세팅되어 있습니다. 2. 전략 구조 (전략 흐름) ① H1 EMA 트렌드 필터 EMA Fast(24) > EMA Slow(130) → 상승 추세 → BUY만 허용 EMA Fast < EMA S
이치모쿠 다층 트렌드 오실레이터 프로 (Ichimoku Multi-Layer Trend Oscillator Pro) 이치모쿠 다층 트렌드 오실레이터 프로는 이치모쿠(Ichimoku) 계산을 네 가지 강력한 오실레이터 레이어로 변환하는 고급 추세 읽기 및 진입/청산 시스템입니다. 이 레이어들은 추세 강도, 모멘텀, 그리고 가장 안전한 진입/청산 지점을 명확하게 시각적으로 보여줍니다. 이 지표는 또한 완벽한 거래 결정 세트를 형성하기 위해 선택적 RSI , MACD , EMA , 및 ATR 확인을 포함합니다. 고유한 다층 오실레이터 구조 이 시스템은 가격 움직임의 다른 측면을 나타내는 네 가지 이치모쿠 기반 오실레이터 레이어 를 생성합니다: 1️⃣ 첫 번째 레이어 – 가격과 구름의 거리: 종가와 이치모쿠 구름 사이의 거리를 측정합니다 (주요 추세 방향에 따라 최소 또는 최대). 진행 중인 추세의 강도를 식별하는 데 도움이 됩니다. 2️⃣ 두 번째 레이어 – 지연 스팬 vs 구름:
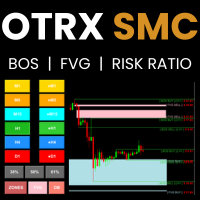
Unlock the power of Smart Money Concepts (SMC) with precision and financial clarity. OTRX SMC is not just a technical indicator; it is a complete professional trading system designed for traders who follow institutional footprints. Unlike standard indicators that clutter your chart with noise, OTRX SMC focuses on the three pillars of Price Action: Structure (BOS) , Flow (FVG) , and Origin (OB) . The unique advantage of OTRX SMC is its Real-Time Risk Calculator . For every mapped structure or zon

QUANTUM DCA HEDGE PRO AI-Powered Multi-Layer DCA + Hedge Architecture for Professional Traders OVERVIEW Quantum DCA Hedge Pro is a next-generation trading system engineered for long-term, stable, risk-controlled growth . Powered by:
Double MA Trend Engine
Adaptive ATR DCA System
Controlled Hedge Logic
Equity Trailing Architecture
Smart Compounding Engine
Remote Command System A high-precision architecture built for traders who demand consistency, discipline, and durab

GOLD Stone EA — The Ultimate Trend-Following Strategy for Gold
DISCOUNT - Don't Miss Out! Original Price: $800 → Now: $150
LINE Signal Coming Soon!
Stunning Results: 12x Return in 2 Years Initial Deposit: $10,000 Final Balance: $122,532 Net Profit: $112,532 (+1,125%) Test Period: January 2024 – December 2025 (Approx. 2 Years)
Outstanding Performance Metrics Metric Result Rating Profit Factor 19.48 Exceptional (1.5+ is considered good) Sharpe Ratio 2.41 Excellent (1.0

USDJPY Trend EA ProTrading (Optimized for USDJPY) JPY Trend EA ProTrading is a professional USDJPY trend continuation Expert Advisor for MetaTrader 5 and MetaTrader 4 , designed to capture clean breakout-driven moves during established bullish conditions. This EA focuses on high-probability trend continuation setups with structured risk and a rules-based execution process. It is optimized for USDJPY on H1 and built for traders who want a disciplined, automated approach with clear settings and pr
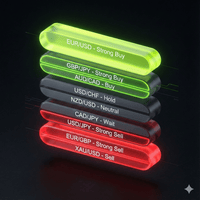
Market Watch Sentiment Scanner Pro (MT5) Overview The Market Watch Sentiment Scanner Pro is a high-performance dashboard utility for MetaTrader 5 designed to eliminate the noise of manual charting. It instantly scans every symbol in your "Market Watch" window, processes them through a complex algorithm of 10 different technical indicators , and creates a visual "Heat Map" of Buy/Sell signals directly on your chart. Instead of flipping through 50 charts one by one, this tool gives you a com
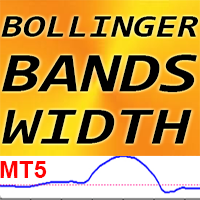
MT5용 Crypto_Forex 지표 "볼린저 밴드 폭", 리페인트 불필요
-BB 폭 지표는 표준 볼린저 밴드 지표와 함께 사용하도록 설계되었습니다. -이 거래 도구는 볼린저 밴드 지표를 사용하는 모든 트레이더에게 필수적입니다. 두 지표를 함께 사용하면 브레이크아웃 거래에 매우 효율적이기 때문입니다. -BB 폭 지표는 볼린저 밴드 간의 거리(스팬)를 보여줍니다.
BB 폭 사용 방법(그림 예시 참조): 1) 최근 6개월 동안 BB 폭의 최저값을 찾아 이 값에 25%를 더하여 브레이크아웃 레벨을 구합니다. 2) BB 폭 지표에 브레이크아웃 레벨을 추가합니다. 또한 볼린저 밴드 지표를 차트에 추가합니다. 3) 볼린저 밴드 지표 경계선 사이에 가격이 평평하게 고정되고 BB 폭 값이 브레이크아웃 레벨 아래에 있을 때까지 기다립니다. 4) 볼린저 밴드 지표 경계선을 돌파할 때까지 기다립니다(캔들이 밴드 밖에서 마감되어야 함). BB 폭을 확인합니다. 돌파 레벨 위에 있어야 합니다. 5)
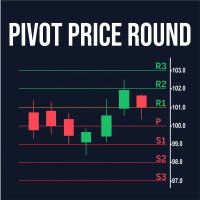
Pivot Round Price는 고전적인 Pivot Points(Classic Pivots) 공식을 기반으로 한 인디케이터로, 지지선, 저항선 및 중앙 피벗의 원래 계산을 그대로 유지하며 사용되는 표준 수학의 어떤 부분도 변경하지 않습니다. 이 인디케이터의 차이점이자 가장 큰 장점은 레벨이 자동으로 반올림된 가격으로 조정되어 소수 자릿수가 많은 자산에서도 시각화가 더욱 쉬워지고 실제 차트에서 레벨이 훨씬 더 의미 있게 보인다는 점입니다. 가격이 반올림되면 레벨이 더 이상 소수 값에 “묻히지” 않으며, 시장이 반응하거나 통합되는 지점에서 일반적인 심리적으로 중요한 영역과 일치하게 됩니다. 이 인디케이터에는 사용자의 스타일에 맞게 정확하게 조정할 수 있는 다양한 시각적 컨트롤이 포함되어 있습니다: LinesBehindCandles 모든 라인을 캔들 뒤에 그릴 수 있어, 차트를 깔끔하게 유지하고 가격 움직임을 방해하지 않습니다. RoundToNearestLevel 가장 가까운 가격으로

The product Indicator is " FORCEPART-i ". The Determining Factor Is The Breadth Of The Dynamics Of Net Trade. Purpose : An auxiliary market analysis Tool that indicates reversal jumps in trends in banking policy and trend direction selection. Input Parameters: " DRAWs "="128" - the number of the last bars of the indicator "FORCEPART-i(Line\KNOT)"; " SECTOR_spread_price "="0.03" - The price range of the restriction of freedom of trade on the spread; " FRAME_EPIZODE_bars "="60" - The parameter of

This Order Risk Control Panel is designed with the core concept of "Simple, Efficient and Accurate Risk Control". Tailor-made for all types of traders, whether they are beginners or experienced professionals, it allows for quick mastery and realization of refined risk management in every trade. The panel deeply integrates risk control logic into the entire order placement process, fundamentally addressing the pain points of "cumbersome risk control settings and delayed operations" in traditiona

MSX Plug & Play Scalper – XAUUSD (M5) MSX Plug & Play Scalper is a professional automated trading system built specifically for XAUUSD scalping on the M5 to H1 timeframe .
The EA combines a clean EMA trend engine with ATR-based money management and multiple protection layers, with no martingale, no grid, no averaging and no DLLs . The goal is steady, controlled growth with limited drawdown , suitable for: Prop-firm challenges & funded accounts Copy trading / master accounts Partner Program fo

Iron Silk - 거래의 미래
설정에 대한 추가 세부정보 : (링크) 구매 후 실시간 신호 링크를 위해 저희에게 문의하세요. 충성도 보너스 — 구매 후 메시지를 보내주시면 선물 EA 를 받을 수 있습니다. 저희 MQL5 채널 에 참여해 주세요 (우선 텔레그램 으로 문의하세요): (링크)
제공된 설정으로 역테스트가 더 잘 작동합니다. 파일을 위해 저에게 연락하세요. 가격은 1000 부터 시작합니다. 지금까지 1 트레이더만 접근 가능합니다. 5 라이센스가 발급되면 가격이 1516 로 인상됩니다. ****** 데모 사용을 위한 시험 버전 파일 을 원하시면 알려주세요. ******
위험 관리: 강력한 내장 손절매 및 이익실현 기능으로 거래가 항상 보호됩니다 (자세한 내용은 저에게 문의하세요). 간단한 설정: One-Chart EA - Iron Silk는 하나의 차트 에서만 실행되어야 합니다 ( XAGUSD ) M30 모든 심볼에서 자동으로 거래합니다. 전략:

Session Momentum Dashboard – 미래형 트레이딩 분석 아시아/런던/뉴욕 3대 세션을 분석하고, Kill Zone 감지, 아시아 레인지 돌파, 모멘텀 점수를 실시간으로 제공하는 전문 트레이딩 대시보드. Session Momentum Dashboard ICT / Smart Money 트레이더를 위한 올인원 시장 세션 모니터링 도구. 주요 기능: 3대 주요 세션 분석 아시아, 런던, 뉴욕 세션의 실시간 상태 표시. Kill Zone 감지 런던 Kill Zone (07:00–09:00) 뉴욕 Kill Zone (12:00–14:00)
자동 알림 지원. 아시아 레인지 브레이크아웃 아시아 레인지 그래픽 표시 상방/하방 돌파 감지 모멘텀 스코어링 세션별 RSI 기반 진행 바 거래량 분석 거래량 대비 평균 비율 분류: LOW / NORMAL / HIGH 트레이딩 신호 다음 요소가 결합될 때 강력한 신호 생성:
Kill Zone + Breakout + Momentum 런던/뉴욕

Alligator Runner EA – Smart XAUUSD Expert Advisor Alligator Runner EA is a fully automated trading robot designed specifically for XAUUSD (Gold) on the MetaTrader 5 platform. It combines trend-based logic with level trading mechanics, powered by the Alligator indicator, to detect precise entries and exits in the market. Key Features : Trend-following strategy with level re-entries ️ Built-in Stop Loss , Take Profit , and dynamic trailing Designed exclusively for XAUUSD – no optimiza

This EA is based on the calculation of two candles. This EA can be used either as a Martingale EA or an Averaging EA. You can limit the number of orders that will be opened. This EA uses a trailing stop function, allowing you to lock in your profits to the maximum.
Quick Setup in 4 Steps: 1. Launch RZK on your chosen symbol: XAUUSD with the recommended timeframe: M15 . 2. Pick your trading instruments (examples: XAUUSD) and set your Setting. 3. Enable the trailing stop function, allowi

Market Intelligence Hub
contattatemi per ricevere template da usare conAI Descrizione generale
Market Intelligence Hub è un indicatore professionale di analisi multi-asset progettato per MetaTrader 5.
Trasforma la complessità dei mercati globali in una visione operativa chiara e sintetica, utile sia per trader discrezionali che per analisti quantitativi.
Monitora oltre 25 strumenti suddivisi in cinque categorie chiave (USD, EUR, Risk Assets, Safe Haven, Volatility) e fornisce un quadro completo
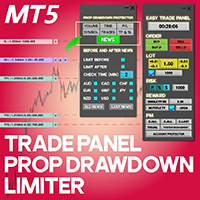
Trade Panel Prop Firm Drawdown Limiter Pro for MetaTrader 5 The Trade Panel Prop Firm Drawdown Limiter Pro for MetaTrader 5 is a professional-grade solution designed specifically for prop-firm traders. This tool gives Forex traders precise control over risk and position sizing, helping them protect capital and maintain consistent performance. Engineered with a modular, multi-symbol Expert Advisor structure , the system streamlines order management—making it fast and intuitive to configure stop l

NeuralGold XAU-AI is an institutional‑style, fully automated gold trading system built specifically for XAUUSD on MetaTrader 5. It focuses on combining strict risk control with adaptive signal generation so it can trade gold’s volatility without relying on extreme leverage or martingale tricks. Core trading logic (high level) NeuralGold continuously reads a basket of technical inputs on each new bar and on tick updates: volatility (ATR), short/medium EMAs, RSI, ADX and DI for trend strength and

SRT Levels Pro Indicator — Support, Resistance & Trend Levels (Visual Trade Ideas & Alerts)
Brief description SRT Levels Pro is a powerful on-chart indicator that reads user-drawn Support, Resistance, Channels and Trend lines/zones and turns them into actionable trade ideas (Breakout, Bounce, Retest). It scores level strength, provides entry/stop/target suggestions (ATR or dynamic stops), and shows a compact dashboard and on-chart visual trade ideas. Alerts include pop-ups, email, push

Overview Mirror Signals Service EA (Text only) is a powerful monitoring Expert Advisor that automatically sends real-time Telegram notifications for all important trade events on your MetaTrader 5 account.
It is engineered specifically for signal providers , trade-copier operators , auditors , educators , and professional trading services that require immediate, detailed, and reliable reporting. Everything from entries, exits, SL/TP changes, comment changes, trailing sto
King Dual Force is a fully automated hedge trading system designed for consistent performance in all market conditions.
It combines dynamic lot scaling, reverse balancing, and smart entry logic to maximize profit potential while maintaining strict risk control. Unlike ordinary hedge bots, King Dual Force is built to flow with the market trends.
Once a strong trend is detected, it "rides the wave" and travels with it, aiming to capture extended moves for maximum profit. Key Features: Dual hedge
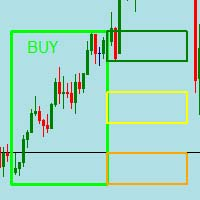
This is a simple indicator that indicates possible buy or sell trades. Apply indicator to chart and wait for retest to zones, apply with your risk management and own trend analysis and you can be profitable. This work best on the 5 minute timeframe. Apply to chart, you will then be able to change, switch times when blocks must appear on and off. You can fully customize the indicator at the input setting so make sure to take a look, you can adjust it to your preference.
when block closes ( bu
AVWAP Machine Gun – 전문가 고문 설명 AVWAP Machine Gun 은 Anchored VWAP 분석의 정밀도를 이동평균 트렌드 필터, MFI 확인, ATR 기반 변동성 관리와 결합하여 고확률 다중 진입 거래 엔진을 제공합니다.
이 EA 는 모멘텀이 기관 수준 신호와 일치할 때 한 캔들에서 여러 거래를 열어 강력한 움직임에 스케일링하고자 하는 트레이더를 위해 설계되었습니다. Anchored VWAP 엔진
EA 는 방향 편향과 동적 지지/저항 구역을 위해 맞춤 Anchored VWAP 지표를 사용합니다.
지표는 완전히 통합되어 있지만 시각적 참고용으로 다운로드 가능(무료):
다운로드 링크 주요 기능 다중 진입 모드: 강력한 신호 발생 시 캔들당 여러 거래 열기. AVWAP 기반 추세 및 반전 감지. 이동평균을 통한 추세 필터링. 볼륨 가중 MFI 확인. ATR 기반 동적 SL/TP. 포지션 방향 완전 제어. 정밀 리스크 관리. Magic Number 분리. Kill

Range Bolt EA is a sophisticated MT5 Expert Advisor that stands out by automating precise, high-probability range breakout trades with advanced customization and risk management features. It detects consolidation periods on custom timeframes and executes pending orders to capture explosive market moves, providing consistent day trading performance without manual input. Its visual tools and flexible strategy options make it uniquely user-friendly and adaptable across various forex pairs and sessi

️ 중요한 백테스팅 공지 이 EA(전문가 어드바이저)의 고도로 발전된 멀티 통화, 멀티 인디케이터, 멀티 타임프레임 아키텍처로 인해: 백테스팅에 추가 시간이 소요될 수 있습니다. 시스템이 여러 통화 페어와 타임프레임을 동시에 처리하기 때문입니다 백테스팅 시작 전 초기 데이터 다운로드 및 동기화가 필요합니다. - 이는 정상적인 동작입니다 설정된 모든 심볼과 타임프레임의 과거 데이터를 로드할 충분한 시간을 허용해 주십시오. 전략 테스터는 초기화 중 "데이터를 기다리는 중..."을 표시합니다. - 이 프로세스를 중단하지 마십시오 복잡한 시스템은 인내를 필요로 합니다. - 기다린 시간은 얻게 될 포괄적인 분석만큼 가치 있습니다 이것은 제한이 아니라, EA의 정교한 다차원 분석 기능을 반영하는 것입니다. TrendFlow PRO - 전문가용 멀티 에셋 트레이딩 시스템- 정교한 기술이 규율 있는 트레이딩 방법론을 만나는 곳 TrendFlow PRO 는 기관급 기술과 전문 트레이딩 규율의
ADX Wilder (Average Directional Movement Index by Welles Wilder) enhanced with fully customizable pop-up and push notifications. Get instant alerts directly on your platform and mobile device when: +DI crosses above –DI → Potential bullish trend start –DI crosses above +DI → Potential bearish trend start ADX crosses above your chosen strong-trend level (default 25) → Confirmation of strong trending market Features: 100% identical to the original MetaQuotes ADX Wilder calculation Clean, visible

EA Neuron Gold — M30 XAUUSD 전용 신경 지능 트레이딩 시스템 Neuron Gold는 XAUUSD를 M30 타임프레임에서 거래하기 위해 특별히 설계된 고급 자동매매 시스템(EA)입니다.
두 개의 독립적인 자동 전략을 탑재하고 있으며, 단독 또는 동시에 작동할 수 있습니다. 또한 차트에 직접 통합된 완전한 수동 거래 패널도 포함되어 있습니다. Neuron Gold의 자동 매매 전략 1. 깃발 패턴(Flag Pattern) 전략 클래식 추세 지속 패턴(불 플래그·베어 플래그)을 자동으로 감지합니다.
EA는 다음을 분석합니다: 기울어진 박스권(조정 구간) 플래그의 방향 돌파 지점 추세 지속 구간 패턴이 완전히 형성되고 확정된 경우에만 매매가 실행되므로 진입 정확도가 크게 향상됩니다. 2. 지지·저항(S/R) 돌파 및 확인 전략 EA는 주요 S/R 구역을 추적하며 다음을 감지합니다: 실제 돌파 되돌림/풀백 돌파 확인 최적의 진입 지점 이를 통해 가짜 돌파를 피하고 극도로
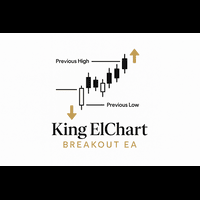
King ElChart Breakout EA is a professional breakout trading system designed for traders who want a precise, reliable, and fully automated approach to market breakouts.
The EA executes trades based on two powerful mechanisms: 1. Daily Breakout – using the previous day’s high and low with customizable offset. 2. Session Breakout – for Asian, London, and New York sessions with dynamic session-high/low detection.
The system includes advanced risk-management tools: • Fixed or Auto Lot sizing based

SMART TRADE COPIER MT5 - LOCAL TRADE REPLICATOR Copy trades instantly between multiple MT5 accounts on the same computer or VPS. Fast, reliable local copying system. WHAT IT DOES Replicates all trading activity from one master account to unlimited slave accounts running on the same machine. Copies: Market orders (Buy/Sell) Pending orders (all types) TP/SL modifications Trade closures and deletions KEY FEATURES Smart Symbol Matching Handles different broker suffixes (.a, .z, .m, .ecn, etc.) Works

Dynamic Trend Fill Pro 는 두 개의 채널 시스템 간의 동적 관계를 통해 시장 구조를 시각적으로 보여주는 고급 트렌드 분석 지표입니다.
전통적인 이동평균은 횡보장에서 크게 지연되지만, 본 지표는 시장 노이즈(Noise) 와 실제 신호 모멘텀(Signal) 의 차이를 계산하여 스무딩 계수를 자동 조절합니다. 이를 통해 추세에서는 빠르게 반응하고, 횡보에서는 부드럽게 유지되어 현대 시장 변동성에 최적화되어 있습니다. 지표는 두 개의 채널 레이어 로 구성됩니다.
노란색 채움 영역 은 중·단기 트렌드의 확장/수축을 나타냅니다: 확장 → 시장 방향 명확 수축 → 모멘텀 약화, 횡보 또는 추세 전환 가능성 또한 빨간/파란 채움 영역 을 표시합니다: 가격이 노란 채널 위 → 빨간색 , 강한 상승 구조 가격이 아래 → 파란색 , 하락 모멘텀 또는 조정 이중 구조는 추세 방향, 강도 판단, 가짜 돌파 필터링에 효과적이며, 진입·추가·청산 판단을 개선합니다. Dynamic Trend

Professional Trend Capture System for XAUUSD Are you looking for a reliable strategy to trade Gold without dangerous gambling methods? Gold Trend Breakout EA ProTrading is engineered to capture high-probability volatility moves in XAUUSD, utilizing a sophisticated breakout logic combined with strict risk management. Unlike risky Grid or Martingale systems that blow accounts, this EA is designed for sustainability and growth , making it ideal for personal accounts and Prop Firm Challenges . W
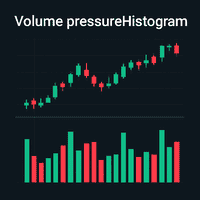
1. Overview The Volume Pressure Histogram (VPH) is a custom indicator for MetaTrader 5 (MT5) that measures buying and selling pressure based on tick or real volume. It highlights extreme buying/selling moments and provides a smoothed signal line for trend detection. 2. Indicator Components · Volume Pressure Histogram (Colored): o Green: Extreme buying pressure o Lime: Buying pressure o Red: Extreme selling pressure o Yellow: Selling pressure · Signal Li

MarketMarven EA — Intelligent Multi-Currency Price Action Trading
MarketMarven is a next-generation algorithmic trading system designed for traders who demand precision, discipline, and consistent performance. Powered by advanced price action analytics, institutional-grade risk management, and a high risk-to-reward model, MarketMarven adapts dynamically to real market conditions to capture high-quality entries across multiple forex pairs.
Core Features
True Price Action Engine
Mar
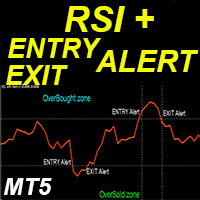
MT5용 Crypto_Forex 지표 "RSI 알림 기능" (리페인트 불필요)
- RSI는 트레이딩에서 가장 널리 사용되는 오실레이터 중 하나입니다. - PC 및 모바일 기기 모두에 내장된 알림 기능: 과매도/과매수 구간 진입 및 과매도/과매수 구간 청산 알림. - 알림 활성화를 위한 조정 가능한 트리거 레벨 제공. - 이 지표는 모멘텀 트레이딩 시스템에 매우 적합합니다. - 강력한 과매수 구간(70 이상)에서 매도 진입, 강력한 과매도 구간(30 미만)에서 매수 진입에 적합합니다. - RSI 자체는 다이버전스 감지에 매우 유용합니다. - 이 지표는 모든 시간대에서 사용할 수 있습니다. - 이 지표는 가격 변동 기법과도 결합하면 매우 유용합니다.
여기를 클릭하여 고품질 트레이딩 로봇과 지표를 확인하세요! 본 제품은 MQL5 웹사이트에서만 제공되는 정품입니다.
Previous Period Volume Profile [VAH/VAL/POC] — Professional Institutional-Level Reference Levels Previous Period Volume Profile gives traders instant visual access to the most important volume-based levels from the prior session: Point of Control (POC) , Value Area High (VAH) , and Value Area Low (VAL) .
These levels are widely used by professional traders to anticipate liquidity magnets, rotation zones, high-probability reversals, and continuation setups. Unlike full histogram packages that
XP Trade Manager
1. Overview XP Trade Manager is a professional visual trading panel designed for manual traders on MetaTrader 5. It simplifies execution and provides advanced risk management tools like bulk closures, hedging, and position reversal directly from the chart. 2. Interface & Controls A. Trade Entry Section LOT: Trade volume input. Use the arrows to adjust by the Lot Box Step . TP / SL: Take Profit and Stop Loss inputs (in Points). SELL / BUY: Instant execution buttons. COMMENT: Cu
1. Introduction This document explains how to use the CVD (Cumulative Volume Delta) + Delta Volume Histogram indicator. It covers setup, features, trading logic, and best practices. 2. What the Indicator Shows - Delta Histogram: Displays per‑bar delta (buy volume – sell volume) as green/red bars. - Helps identify market pressure, absorption, reversal signals, and trend strength. 3. How to Add Indicator in MT5 1. Open MT5. 2. Go to File → Open Data Folder. 3. Navigate to MQL5 → Indicators. 4. Pa
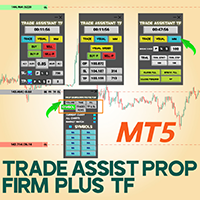
Trade Assist Prop Firm Plus TF Expert for MetaTrader 5 The Trade Assist Prop Firm Plus TF Expert for MetaTrader 5 is a precision-engineered trading solution designed to enhance discipline, risk control, and execution accuracy. Equipped with adaptive tools such as dynamic trailing stops, break-even automation, and multi-symbol handling, it helps traders manage their strategies intelligently while aligning with the strict requirements of proprietary trading firms. With seven configurable panels, t

Overview Mirror Signals EA is a powerful monitoring Expert Advisor that automatically sends real-time Telegram notifications for all important trade events on your MetaTrader 5 account.
It is engineered specifically for signal providers , trade-copier operators , auditors , educators , and professional trading services that require immediate, detailed, and reliable reporting. Everything from entries, exits, SL/TP changes, comment changes, trailing stop activations, pending order modifications

SLS Monolith Maximus SLS Monolith Maximus is a disciplined, grid-assisted trading system designed to focus on daily consistency rather than high-risk speculation. Unlike traditional grid systems that trade blindly, Monolith Maximus utilizes a custom AIS (Adaptive Interval Statistics) Extremum Engine to identify high-probability reversal zones based on historical price distribution. The core philosophy of this EA is "Hit and Run." It aims to secure a specific daily profit target and then ceases t

PURELY QUANT — A Modern Quantitative Trading System for Consistent Market Execution PURELY QUANT is an advanced algorithmic trading system engineered with a clean mathematical framework, structural price analysis, and dynamic equity-cycle management.
It is designed for traders who prefer a systematic, disciplined, and quant-oriented approach without relying on martingale, arbitrage, curve-fitting techniques, or unrealistic risk models. The system applies a multi-layer logical architecture combin

Imperial Flow — Automated Strategy for XAUUSD (M1) Intelligent Expert Advisor with Dynamic StopLoss and TakeProfit
Imperial Flow is a high-precision expert advisor designed specifically for trading XAUUSD on the M1 timeframe. The algorithm automatically determines optimal StopLoss and TakeProfit levels based on market volatility, trend strength, and local price structure. The system continuously adapts to real-time market conditions, minimizing risks and improving overall performance stability

Golden Trader AI — Professional Expert Advisor for Forex, Metals, Stock Indices, and Cryptocurrencies. Line Guide (Official Manual) https://www.mql5.com/en/blogs/post/766213 1) General Description Golden Trader AI is a professional multi-asset Expert Advisor for MetaTrader 5 , designed to trade Forex, metals, stock indices, and cryptocurrencies simultaneously from a single chart . The EA uses an independent analytical engine per instrument , meaning each symbol is evaluate

Trend Gold Safe Trading
This is SafeGold EA, tested under the hardest conditions with profitable and consistent results (please see the images). Using advanced strategies, SafeGold is capable of generating consistent profits across 8 risk levels, entering only when all strategies intersect. No Martingale or grid usage, with fixed or automatic money management. Easy installation and simplified use. The EA is delivered to you, configured for optimal operating conditions. Requirements and recommen
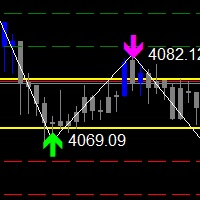
The Zigzag Price Arrow indicator is an enhanced version of the classic Zigzag indicator, combining the traditional zigzag pattern with advanced visual features. It not only identifies major market turning points but also provides clear trading signals through: • Directional arrows: Displays colored arrows (green for buy, magenta for sell) indicating potential trend directions.
• Price labels: Shows the exact price values at each pivot point directly on the chart.
• Improved visual c

Synthetic Pro Detector is built for traders who want real results and don’t have time to waste. Forget ordinary indicators: this tool was designed to detect powerful market moves on Deriv Synthetic Indexes, Metals (Gold, Silver), and Forex with surgical precision. Smart impulse detection, direct Buy/Sell signals, and automatic SL/TP levels — all calculated in seconds. This indicator works for you: it filters noise, reduces false signals, and delivers only opportunities with real profit potential
SignalDivil25 EA PRO v1.330 is a professional-grade Expert Advisor for MetaTrader 5 designed for M5 Forex and cryptocurrency trading, optimized for ZAR accounts with balances as low as ZAR20. It integrates Smart Money Concepts (SMC) to deliver precise entries with higher win rates. The EA features dynamic lot sizing with strict 0.8% risk management, adaptive to account size including micro-lot support for small balances. Key capabilities include hedging system & real-time dashboard SignalDivil

HUMBO: The Gold Trend Hunter Stop scalping pennies. Start catching the "Jumbo" moves. HUMBO is a specialized breakout expert advisor designed exclusively for XAUUSD (Gold) . It is built on a simple premise: Gold makes its biggest moves during the London Open. HUMBO captures these explosive movements while filtering out the noise that destroys other bots. The HUMBO Strategy HUMBO is not a grid, martingale, or dangerous averaging bot. It is a Sniper . Time-Based Logic: It monitors the
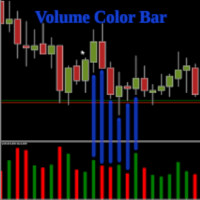
This indicator customizes the volume candles to match the color of the price candle. If it's a bullish candle, the volume candle will be green... And if it's a bearish candle, the volume candle will be red... Very useful for seeing the dominant trend at a glance... You can customize the color of the volume candles, their thickness, style, and even the timeframes you want them displayed on... It's like the default MT5 Volume indicator, but this one has the option to customize colors and styles...

VPS
IP:49.235.52.239 ACC:Taolishen
PASS:Qq2356692354 For traders, EA is an extremely powerful tool and a loyal executor. Moreover, it can generate stable profits through trading logic and strategic thinking. But the prerequisite is that you need to have an excellent EA Taolishen's core functions: 1 single currency transaction 2 Multi currency Hedge Transactions 3 Real time market trading 4 pending transactions 5 Trading Frequency Switching Switching between 6 different ways of adding warehouses

Multi-Indicator MT5 Expert Advisor Designed for Trend, Reversal & Momentum Alignment
TRDR Bot-1 is a versatile Expert Advisor developed by TRADEWYZE, engineered for traders who want a robust, rules-driven system that blends trend-following, reversal detection, momentum confirmation, and strict risk protections. The EA combines multiple indicators—MACD, Stochastic, CCI, Moving-Average Oscillator (MAO), Pin Bar detection, and Candle Color patterns—to identify high-quality trade setups across For

Gold Scalping Machine Pro – XAUUSD Smart Recovery EA Gold Scalping Machine Pro is a fully automated XAUUSD scalping Expert Advisor built with a last-trade recovery averaging system . It targets fast consistent profits with intelligent drawdown control. Unlike risky martingale systems, this EA only opens new trades when the most recent trade reaches controlled drawdown , making it smarter and safer for long-term trading. Gold Expert Pro is a fully automated scalping Expert Advisor designed exc

런칭 프로모션: 현재 가격으로 한정된 수량 제공! 최종 가격: 1,800$ 1 EA를 무료로 받으세요 (2개의 거래 계좌에 유효) -> 구매 후 저에게 연락하세요 Instruction Blog Link to Channel
Message me if you need precise backtest configuration. I’ll send the files and instructions. 환영합니다 Zen Shift ! Zen Shift 는 복잡한 가격 행동 전략을 사용하여 주요 거래 기회를 식별하는 최첨단 EA입니다. EURJPY 기호를 분석하며 하나의 차트에서만 작동하도록 설계되었습니다. 이 EA는 최고의 진입 및 퇴출을 결정하기 위해 가격 패턴 , 캔들스틱 형성 , 지지 및 저항 수준 을 읽는 데 집중하여 변동성이 큰 시장 조건 및 범위 시장 조건에서 우위를 제공합니다. 고급 시장 분석 기능으로 구축된 Zen Shift 는 변화하는 가격 움직임에 적응하는 데 뛰어나며, 거래가

️ Warning – Fake Sigma Trend Protocol EA STP Any “Sigma Trend Protocol EA STP” sold outside my official MQL5 page is a fake scam product using my name to take your money. The only real and supported version is here:
https://www.mql5.com/en/market/product/152096
https://www.mql5.com/en/market/product/157301
Don’t spend your hard-earned money expecting premium performance from a cheap copy. STP cannot be easily copied or sold as a discount scrap version.
STP Signal: Before any thin
BREAKOUT RANGE STRATEGY KASPER - Your Key to Profitable Breakout Trading!
STOP Missing Explosive Breakout Moves!
This professional indicator automatically detects consolidation zones and alerts you the INSTANT price breaks out - giving you the edge to catch powerful trends from the very beginning!
WHY TRADERS LOVE THIS INDICATOR:
Automatic Range Detection - No guesswork! The indicator finds consolidation zones for you Crystal-Clear Visual Zones - Beautiful gray zones show exa
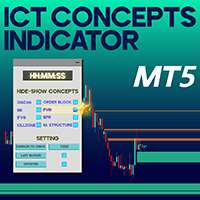
ICT Concepts Indicator for MetaTrader 5 The ICT Concepts Indicator for MetaTrader 5 is an advanced tool designed specifically for experienced traders.
It provides a complete set of Smart Money and ICT-based analytical features through a clean, intuitive control panel. With this indicator, traders can seamlessly apply ICT concepts such as Order Blocks, Fair Value Gaps (FVG), Breaker Blocks, Market Structure interpretation, and Kill Zones directly on their charts. ICT Concepts Indicator Overview

King Fibonacci — Precision Trading at the 0.618 Golden Ratio King Fibonacci is an advanced swing-based Expert Advisor engineered around one of the most powerful concepts in technical analysis — the 0.618 Fibonacci retracement . This EA automatically identifies major swing highs and lows, calculates the golden 0.618 retracement level, and executes trades only when price returns to this precise reversal zone . King Fibonacci is designed for traders who value accuracy, swing structure, and clean
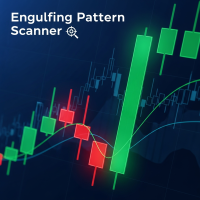
버전 4.4
다중 시간대 확인 기능을 갖춘 Engulfing Candlestick Patterns 감지 전문 지표
주요 기능:
유연한 시간대 구성
확정을 위한 하위 시간대를 완벽하게 사용자 정의 가능
M1-M5-M15, M5-M15-H1, M15-H1-H4 등 원하는 조합으로 사용 가능
모든 거래 스타일 및 전략에 적용 가능
3단계 신호 확인
약한 확인(맞춤형 TF) - 노란색 화살표
중간 확인(맞춤형 TF) - 파란색 화살표
강한 확인(맞춤형 TF) - 녹색/빨간색 화살표
재도색 없이 안정적인 작동
화살표는 한 번 그려지며 사라지지 않습니다.
확정을 위해 마감된 캔들만 사용
허위 신호 방지
모든 거래 스타일에 적용 가능
스캘퍼: M1-M2-M5
데이 트레이더: M5-M15-H1
스윙 트레이더: M15-H1-H4
장기 트레이더: H1-H4-D1
스마트 알림 시스템
현재 막대 신호에 대해서만 알림이 전송됩니다.
지표 추가 시 과거 신호에서 스팸

This tool provides an intelligent method of trading SMA. It has been tested for a period of ten years on EUR/USD and shows consistent profit making capability. The amount of profit you intend to make per year depends on your investment amount. This tool is easy to use and requires no further settings. This product has been well tested on ic marketss for 10yrs and is currently being tested on other platforms to ensure it provides consistent results. Details on its universal use will be provid

Prop Firm GBP EA MT5 는 GBP(영국 파운드) 시장을 위해 특별히 개발된 완전 자동화된 거래 시스템 으로, GBPUSD에 대한 검증된 성능을 자랑합니다. 이 시스템은 런던장이 열릴 때 발생하는 시장 모멘텀 을 활용하기 위해 변동성 기반의 돌파 전략 을 사용합니다. 이 **전문가 어드바이저(EA)**는 리스크 관리와 규율 에 초점을 맞춰 설계되었으며, 엄격한 손실 제한 규칙 이 적용되는 프랍펌(Prop Firm) 트레이더에게 적합한 도구입니다. 거래 전략 이 EA는 위험한 복구 기법을 사용하지 않습니다. 마틴게일 전략 없음 그리드 전략 없음 차익 거래 없음 고빈도 거래(HFT) 없음 대신, 클래식한 가격 행동 기반 돌파(PA Breakout) 로직 을 사용합니다.
야간에 형성된 **통합 구간(range)**을 식별한 후, 거래 세션 초기의 변동성 돌파 를 포착하기 위해 **지정가 주문(pending orders)**을 배치합니다.
모든 거래는 진입 시점부터 **손

Here's a simple description for your indicator: FVG & CHOCH Detector - Visual Indicator for MT5 A clean and simple visual indicator that detects Fair Value Gaps (FVG) and Change of Character (CHOCH) patterns on any timeframe. Features: Bullish FVG Detection : Identifies bullish fair value gaps and marks them with blue boxes Bearish FVG Detection : Identifies bearish fair value gaps and marks them with red boxes CHOCH Detection : Detects trend changes with visual markers: Bullish CHOCH (cyan/aqua
=== RISK ANALYZER MT5 ===
Professional position sizing and margin calculator for serious traders.
MAIN FEATURES:
• LOT SIZE CALCULATOR - Calculate optimal position size based on your risk • MARGIN CALCULATOR - See required margin, free margin, and margin level BEFORE trade • TRADING STATISTICS - Win rate, profit factor, expected payoff analysis • DRAWDOWN MONITORING - Track absolute and maximal drawdown • REAL-TIME RISK ANALYSIS - All metrics update automatically
CALCULATE BEFORE YOU TRADE:
Imbalance Volume Trend is a professional indicator for MetaTrader that combines Fair Value Gap (FVG) / Imbalance zones with volume imbalance analysis and a trend engine based on imbalances . The indicator automatically finds bullish and bearish Fair Value Gaps, paints them on the chart as colored rectangles and calculates the percentage of volume domination of buyers over sellers (or vice versa) inside the breakout candle that created the imbalance. On top of that, it builds a trend of imbalance

TScalper: The "Plug-and-Play" Scalping Solution Stop guessing the trend and start seeing it. TScalper is a non-repainting indicator that visualizes the invisible forces of market momentum. What it does:
It projects a "Sentiment Cloud" on your sub-window.
Green Fill: Buyers are in control. Look for Longs.
Red Fill: Sellers are in control. Look for Shorts. Why TScalper? Locked & Loaded: No confusing settings or inputs. We have tuned the internal algorithms for maximum efficiency

Indicator logic (quick summary) Core job:
Scans every candle for high-probability reversal and continuation patterns , with a special focus on pin bars , and then rates each setup with a 0–100 confidence score . Patterns it recognizes Bullish & bearish Pin Bars (with tail/body/position checks + S/R proximity) Hammer / Hanging Man Engulfing (bullish & bearish) Doji (trend-reversal flavored) Morning Star / Evening Star Optional breakout module (Donchian-style highs/lows + vol

Hi Traders, Distilled from professional traders' experience, this is the only Fibonacci tool you will ever need. Unlock the power of advanced swing-based Fibonacci analysis with this custom MT5 indicator. Designed for precision and clarity, it automatically identifies the nearest Swing High (SH) and Swing Low (SL) on your selected timeframe and draws key Fibonacci retracement and extension levels directly on your chart. Link to download fully functional demo version to test on DEMO a

GOLDEN AXIS – XAUUSD / XAUEUR H1 Institutional-grade system designed for highly volatile trending markets. Quantitatively validated using Monte Carlo Testing, confirming a robust and reliable model. XAUUSD Sharpe Ratio: 4.76 | Recovery Factor: 7.39 | Drawdown: 7.09% | Profit Factor: 1.92
XAUEUR Sharpe Ratio: 6.69 | Recovery Factor: 13.41 | Drawdown: 3.92% | Profit Factor: 2.47 Professional architecture with no grid, martingale, or averaging. Built for traders seeking high-probability systems spe

ORBITRON AI-X
움직임의 정밀함
설명
Orbitron AI-X는 규율 있는 위험 관리로 방향성 모멘텀을 포착하도록 설계된 정밀하게 설계된 거래 시스템입니다. MetaTrader 5용으로 설계되었으며, 다중 시간대 모멘텀 분석과 Parabolic SAR 확인을 결합하여 시장 상황에 동적으로 적응하는 깔끔하고 강력한 의사 결정 엔진을 제공합니다.
모든 거래는 가격 에너지에 의해 인도되고, 구조에 의해 확인되며, 지능적인 거래 관리에 의해 보호됩니다. 이는 Orbitron AI-X를 진지한 트레이더를 위한 진정한 모멘텀 기반 시스템으로 만듭니다.
️ 핵심 기능
다중 시간대 모멘텀 엔진
모멘텀 지표를 사용하여 두 개의 독립적인 시간대에서 추세 에너지를 분석합니다. 여러 논리 모드 중에서 선택하세요:
• 100 이상 바이어스
• 모멘텀 교차
• 이중 시간대 확인
• 교차 동기화
이를 통해 Orbitron은 추세 시작, 지속, 소멸을 감지할 수 있습니다.

FTU Auto Trade with Panel Mt5
This EA will improve your trading, lower work load and improve risk management Adjust Lot size, entry based on at market or by price input EA will manage entry, stop loss, partial close and adjust stop loss after tp1, partial Test on demo to be sure of all the features and inputs Special Features: This version includes price mode PRC, set a price for entry, no need to wait for MKT execution
Features: Multiple No Trade Times - Various time inputs to stop the EA fro
MetaTrader 마켓은 거래 로봇과 기술 지표들의 독특한 스토어입니다.
MQL5.community 사용자 메모를 읽어보셔서 트레이더들에게 제공하는 고유한 서비스(거래 시그널 복사, 프리랜서가 개발한 맞춤형 애플리케이션, 결제 시스템 및 MQL5 클라우드 네트워크를 통한 자동 결제)에 대해 자세히 알아보십시오.
트레이딩 기회를 놓치고 있어요:
- 무료 트레이딩 앱
- 복사용 8,000 이상의 시그널
- 금융 시장 개척을 위한 경제 뉴스
등록
로그인
계정이 없으시면, 가입하십시오
MQL5.com 웹사이트에 로그인을 하기 위해 쿠키를 허용하십시오.
브라우저에서 필요한 설정을 활성화하시지 않으면, 로그인할 수 없습니다.