 MetaTrader 5
 Experts
 지표
 라이브러리
 유틸리티
 위젯
 규칙
MetaTrader 5용 새 기술 지표 - 146
 기술 지표의 시그널은 주식 및 외환 시장에서 거래를 개시 및 종료하는 데 중요한 역할을 합니다. 지표의 본질은 미래의 가격 변화를 예측하기 위한 금융 시그널 값의 수학적 변형입니다.
기술 지표를 테스트하여 시장 행동과 그로 인한 이익을 더 잘 예측할 수 있습니다.
Indicator Description Range Filter Pro is a sophisticated trading tool for XAUUSD (Gold) that combines adaptive price filtering with volume analysis and real-time market monitoring. Designed for both novice and professional traders, this indicator helps identify trend direction, potential reversals, and significant market movements through its multi-layered approach.
Key Components 1.Dynamic Range Filter 2.Volatility-Adjusted Bands 3.Volume-Enhanced Candles 4.Professional Trading Dashboard 5.M
FREE
The "Supply Demand Arrows" indicator for MetaTrader 5 (MT5) is a powerful trading tool designed to help traders identify critical supply and demand zones in the market. By visually marking these zones with arrows, the indicator enhances trading precision and decision-making. Key Features Identification of Supply and Demand Zones : The indicator effectively highlights key supply and demand zones on the price chart, allowing traders to see where significant buying or selling pressure exists. T
FREE
Flux Binary FX is a powerful trading tool designed specifically for binary options and forex trading. This innovative indicator utilizes a unique approach to identify significant market trends, providing traders with clear signals to enhance their trading strategies. Key Features: Flux Trend Detection: The indicator generates arrows on the chart that indicate the presence of a flux trend. This feature allows traders to quickly identify potential entry and exit points, making it easier to cap
FREE
The RSI Back Arrows indicator is a powerful tool designed for traders who rely on the Relative Strength Index (RSI) to identify potential market reversals. This indicator specifically highlights when the RSI has exited the oversold or overbought zones, providing clear visual signals to inform trading decisions. Key Features: Visual Cues : The indicator marks arrows on the chart when the RSI crosses back into a neutral zone, making it easy to spot potential entry and exit points. Over
FREE
The Trend ADX is a specialized implementation of the Average Directional Index (ADX) that focuses on identifying and confirming market trends. By utilizing ADX along with its directional indicators, Trend ADX helps traders pinpoint the strength of a trend and make informed trading decisions. Key Features of Trend ADX Strength Measurement : The Trend ADX quantifies the strength of a trend, allowing traders to determine whether to enter or exit positions based on trend momentum. Direction Indi
FREE
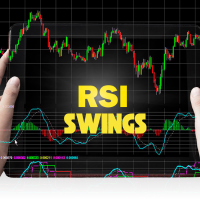
The RSI Swings indicator is a powerful tool designed for MetaTrader 5 (MT5) that combines the principles of the Relative Strength Index (RSI) with high and low price levels to enhance trading decisions. This innovative indicator helps traders identify potential reversal points in the market by analyzing price swings in conjunction with RSI readings. Key Features High-Low Analysis : The RSI Swings indicator focuses on the highs and lows of price movements, allowing traders to pinpoint signifi
FREE
The RSI Channel Binary indicator is a specialized tool designed for binary options trading, leveraging the power of the Relative Strength Index (RSI) . The RSI is a momentum oscillator that ranges from 0 to 100 , helping traders identify overbought and oversold conditions in the market. In the RSI Channel Binary indicator, the following key signals are utilized: Buy Signal (CALL) : A CALL option is indicated when the RSI crosses above the 30 level. This movement suggests that the ass
FREE
The Pattern ADX RSI indicator is a powerful trading tool designed to enhance decision-making by combining the strengths of three distinct components: price patterns , Relative Strength Index (RSI) , and Average Directional Index (ADX) . This indicator waits for specific pattern signals to emerge in the market and then applies filtering mechanisms based on RSI and ADX readings to confirm the quality of the signal before executing trades. Key Components Pattern Detection : The indicator
FREE
The Trend ADX RSI Volumes is an advanced technical indicator that combines the Average Directional Index (ADX), the Relative Strength Index (RSI), and volume information to provide a comprehensive analysis of market trends. This indicator is designed to help traders identify not only the strength of a trend but also its direction and validity. Key Features of the Indicator Trend Strength Measurement : The ADX quantifies the strength of a trend on a scale from 0 to 100. Values above 25 ge
FREE
The Schaff Trend Cycle (STC) is a technical analysis tool designed to help traders identify trends and potential reversals in the market. It combines elements of cycle analysis and moving averages, making it particularly useful for predicting price movements in various financial instruments, including forex 1 . Key Features Predictive Nature : The STC is known for its ability to provide early signals about potential trend changes. This makes it a valuable tool for forex traders looking to
FREE
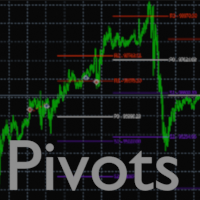
Pivots Points Indicator:
Displays the Pivots Points lines for the Daily, Weekly or Monthly periods
Several parameters are possible:
1 - Choice of calculation method:
- Classic
- Woodie
- Camarilla
- Fibonacci
2 - The choice of the period for calculating the pivot points ( Daily, Weekly or Monthly )
3 - The display or not of the price labels (to the right of each line) as well as the size of the associated font
4 - The number of pivot points (previous) that we want to display
5 - Po

BB Out Arrows is a powerful and intuitive indicator designed for MetaTrader 5 (MT5) that enhances trading strategies using Bollinger Bands. This indicator signals potential trading opportunities by displaying arrows when a candle closes outside of the Bollinger Bands, but with an added layer of precision through a wick percentage filter. Key Features: Bollinger Bands Integration: Utilizes the classic Bollinger Bands to identify market volatility and potential price reversals. Arrows Indicati
FREE

Manyal trading system, CovEchoTrend Robot, focuses on reliability and flexibility. By employing statistical analysis methods to study the relationships between the base indicator and market patterns, the system enables a deeper understanding of market processes. Intelligent pattern analysis: The application of statistical data processing helps identify key trend reversal points more accurately, signaling significant market shifts. Informed decision-making is based on the intersection of indicato
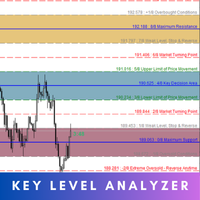
Key Level Analyzer – Know Better, Trade Smarter Key Level Analyzer is a powerful trading tool designed to provide precise market insights by identifying high-probability price zones , market turning points , and key decision areas . Unlike traditional indicators, it uses a smart algorithm to dynamically calculate support, resistance, and balance zones, helping traders make informed, data-driven decisions . MT4 Version - https://www.mql5.com/en/market/product/132809/ With real-ti
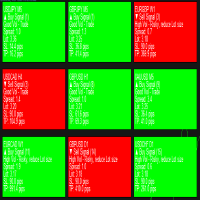
Introducing Telos Dashboard Indicator – Your Ultimate Trading Companion Optimized For Forex! Note: This is a dashboard indicator and won't work on the strategy tester. Demoing it there is a waste. Instead get the main indicator or, use the demo of DynamicCOG to see how it works with arrows, although Telos is a more refined and filtered version than the DynamicCOG indicator. Never Miss a Trading Opportunity Again!
Welcome to the future of trading with the Telos Dashboard Indicator ! Inspired

The indicator is designed to help in making a decision on the direction of trading (buy or sell). It is a history scanner that searches for matches of the current pattern (combination of several current bars) with historical data in percentage terms by the relative vertical position of candles relative to each other, the size of each candle, the size of the candle body and the candle shadows. In history, the matches found are indicated by vertical lines on the candle of the beginning of the soug
Custom ATR Indicator for Horizontal Levels Trading The Custom ATR Indicator is a powerful tool designed for traders who rely on horizontal levels and understand the importance of the Average True Range (ATR) in making informed trading decisions. This indicator calculates the ATR based on a customizable number of bars, filters out abnormal bars (too large or too small), and provides clear visualizations of key data, including ATR values, Stop Loss levels, and price movement percentages. Key F
FREE

A Fair Value Gap (FVG) is a three-candle price imbalance where price moves aggressively in one direction, creating a gap between the wicks of the first and third candle.
How to Identify an FVG: The second candle must have a large body , showing strong displacement.
The wick of the third candle must not overlap with the wick of the first candle , leaving an inefficiency. The third candle should not close beyond the high (bullish) or low (bearish) of the second candle.
Usage: Internal Range

The "Setup Bivit" Indicator The "Setup Bivit" is an advanced technical indicator designed for MetaTrader 5, developed to provide a clear and comprehensive visual analysis of the financial market. Inspired by customized strategies, this indicator combines intuitive visual elements and decision-support tools, making it a powerful ally for traders looking to identify trends, support and resistance zones, and price patterns across different timeframes. With a rich and interactive graphical interface
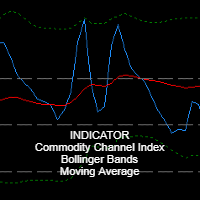
Main Indicator Description: RosMaFin Triple Insight CCI Navigator is an advanced technical indicator that combines the power of three popular indicators - CCI (Commodity Channel Index), Bollinger Bands, and Moving Average - in one comprehensive window. This versatile tool provides traders with a complex view of market conditions and helps identify potential trading opportunities with greater precision. Key Features: Display of all three indicators in one window for efficient analysis Fully custo
FREE
ADBIN BAND – Adaptive Channel Indicator for XAUUSD and DE30
Description:
The ADBIN BAND is a trading indicator designed for analysis of XAUUSD (Gold) and DE30 (German Stock Index) . It generates dynamic price channels using an Adaptive Moving Average (AMA) to reflect market volatility. Functionality: Dynamic Channels : Plots upper and lower bands around price, adjusting to volatility via AMA. Signal Generation : A green arrow appears when price closes above the upper band. A r

Super Trend Indicator – Trend Following Tool
Description:
The Super Trend Indicator is a trend-following tool designed to assist traders in identifying market trends. Utilizing the Average True Range (ATR), it dynamically adjusts to market volatility and generates visual signals. The indicator plots lines directly on the chart, changing color based on trend direction. Crosses between the price and indicator line may suggest potential trend shifts. Key Features: Dynamic trend detection using ATR.
This Indicator enhances the default Relative Strength Index (RSI) by introducing several improvements. First, it visually highlights overbought and oversold regions by changing the RSI color from white to red. Second, it includes additional reference lines at 20, 40, 50, 60, and 80, providing a clearer framework for assessing RSI values. The most notable feature is the use of the middle 50-line to indicate the current market cycle. The color of the 50-line dynamically reflects the cycle: green f

Smart Key Levels Indicator for MT5- Advanced Support & Resistance Tool The Smart Key Levels Indicator is a professional-grade tool for traders seeking precise support and resistance levels. Using advanced algorithms, it identifies key price levels with dynamic strength scoring, volume filtering, and higher timeframe confluence. Perfect for all trading styles and timeframes, this indicator provides clear visual signals with customizable settings. Available for both MT4 and MT5 platforms. Unlo
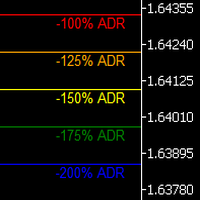
Uncover the market’s secret zones with the ADR Levels+ Indicator. This dynamic tool plots ADR extension levels at 100%, 125%, 150%, and 200% right on your chart. In most cases, price dances between these boundaries—but when it breaks out, it often signals a prime opportunity for a mean reversion trade or the start of an evolving trend. Plus, an integrated alarm system triggers as soon as these key levels are reached, ensuring you never miss a lucrative trading opportunity. Elevate your strategy

The "Matrix Series" indicator is a technical analysis tool designed to identify potential support and resistance zones by visualizing overbought/oversold conditions and trend direction using a combination of price data and customizable parameters, incorporating Commodity Channel Index (CCI) to highlight potential reversal points within the market.
Key features of the Matrix Series indicator: Dynamic Zones: Calculates support and resistance levels based on CCI values, allowing users to adjust th
FREE

Indicador IPCPayroll – O Segredo dos Traders de Sucesso! Quer operar com mais confiança e precisão com os preços do dia da divulgação do Payroll e do IPC Americano ? O Indicador IPCPayroll foi desenvolvido para traders que querem acompanhar o impacto dessas notícias no mercado de forma estratégica e organizada. Marcação Automática das Notícias
O indicador insere automaticamente linhas horizontais no preço de abertura do candle de 5 minutos das datas de Payroll e IPC. Visualização Clar
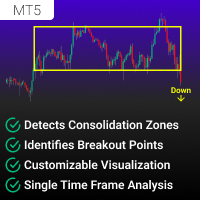
Consolidation and Breakout Detector 는 통합 구역(횡보 시장)을 식별하고 돌파 기회를 감지하고자 하는 트레이더를 위해 설계된 고급 단일 시간 프레임 MT5 지표 입니다.
이 지표는 과거 가격 움직임을 자동으로 스캔하여 시장이 횡보하는 영역을 식별하고, 유효한 돌파가 발생하면 트레이더에게 알림을 제공합니다 . 이 도구는 돌파 트레이더, 추세 추종자 및 횡보 시장 트레이더 에게 유용하며, 가격 구조에 기반한 보다 정확한 거래 결정을 내릴 수 있도록 도와줍니다 . 주요 기능
가격 움직임을 기반으로 통합 구역을 감지
맞춤형 라벨 및 화살표로 돌파 지점을 강조
다양한 돌파 확인 모드 제공 (종가 기준 & 고점/저점 기준)
사용자가 설정한 색상으로 통합 영역을 시각적으로 표시
과거 통합 구역을 확장하여 더욱 명확한 분석 가능 (백워드 익스텐션 기능)
모든 거래 전략에 맞게 완벽한 사용자 설정 지원
모든 시간 프레임 및 자산
Get ALL my MT4 & MT5 indicators FREE — See how here
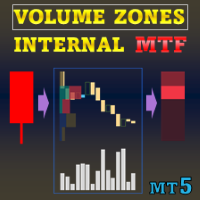
특별 할인 : ALL TOOLS , 각각 $35 에 제공합니다! New tools will be $30 for the first week or the first 3 purchases ! Trading Tools Channel on MQL5 : Join my MQL5 channel to update the latest news from me Volume Zones Internal Visualizer Multi-Timeframe 는 상위 차트에서 거래하면서도 하위 차트의 상세한 거래량 활동을 파악할 수 있도록 도와주는 최고의 솔루션입니다. 다중 시간대(Multi-Timeframe)를 지원하는 강력하고 직관적인 거래량 분석 도구를 찾고 계시다면, 바로 이 제품이 적합합니다! MT4 버전 더 보기: Volume Zones Internal Visualizer MT4 Mul
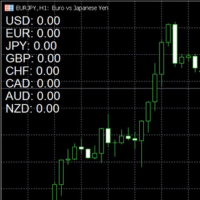
새로운 트레이딩 도구: 트레이드를 최적화하세요! 저는 여러분에게 질문 없이 쉽게 거래할 수 있도록 제가 개발한 완전히 새로운 도구를 소개하게 되어 기쁩니다! 기존의 지표들과 달리, 이 도구는 가격 변동만을 추적하지 않습니다. 대신, 통화 간의 상관관계를 깊이 분석하고, 시장에 진입할 전략적 시점을 포착하는 데 도움을 줍니다. 작동 방식은 다음과 같습니다: 제로 = 거래 없음: 지표가 제로인 동안은 시장 조건이 좋지 않다는 의미이며, 저는 시장에 참여하지 않습니다. 경고는 4에서 발동: 만약 통화 중 하나가 4에 도달하면, 이 도구는 경고를 보내며 4개의 통화 쌍에서 거래할 수 있는 좋은 조건이 마련되었음을 알려줍니다. 상관관계 분석: 기존의 지표와 달리, 이 도구는 통화 간의 상관관계에 기반을 둡니다. 예를 들어, 한 통화가 달러와 상관관계가 있으면 1을 표시하고, 두 개의 통화가 상관관계가 있으면 2를 표시합니다. 4 이상이면 여러 통화가 달러에 비해 약세라는 의미이며,

ShoukatSRI is an advanced MQL5 indicator designed to help traders identify potential market trend changes before they fully develop. Using a combination of smoothing techniques and custom signal logic, the indicator processes market data to provide early alerts through clearly defined buy and sell signals. Key Features: • Early Trend Detection – The indicator employs advanced algorithms such as SuperSmoother, Gaussian filtering, and ALMA to smooth out market noise and highlight significant movem
How Antabod Stochastic Works Antabod Stochastic is a cutting-edge technical indicator designed to analyze market momentum and identify overbought and oversold conditions with unparalleled precision. Here's a breakdown of how it works and what makes it a game-changer for traders: ________________________________________ 1. Core Concept At its heart, Antabod Stochastic is based on the stochastic oscillator principle, which measures the position of a current price relative to its range over a spec

Historical Equity Flow Indicator (HEFI)
Description HEFI is an indicator for MetaTrader 5 that visualizes the dynamics of account balance and floating balance in real time. It helps traders analyze the historical effectiveness of their trading, as well as assess the current state of open positions.
What is it intended for?
Account balance tracking, taking into account closed transactions for the selected period.
Displaying a floating balance (balance + uncovered profits/losses).
Analysis o
FREE
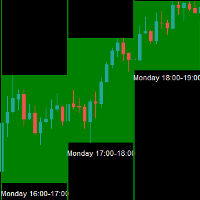
The Entry Signal Analyzer is a sophisticated MetaTrader 5 indicator designed to analyze and identify optimal trading hours based on price movement patterns. The indicator analyzes gold currency only a updated version is currently being developed for other symbol the indicator in the strategy tester is non-functional works on the real chart Statistical Analysis: Analyzes historical price movements for each hour of the trading day Tracks success rates and consistency of movements Calculates poi
FREE

Gaussian scalper indicator based off the same logic used in my gaussian scaler ea. Enjoy!!
The Gaussian Scalper is a precision scalping indicator designed for high-probability trend entries based on advanced filtering techniques. It utilizes a combination of Least Squares Moving Average (LSMA) and Gaussian filtering to detect trend direction and trade signals. The strategy is reinforced by ADX-based trend confirmation, MACD filtering, and a volume threshold for trade validation. Risk management
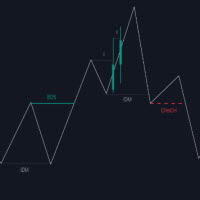
The Market Structure with Inducements & Sweeps indicator is a unique take on Smart Money Concepts related market structure labels that aims to give traders a more precise interpretation considering various factors. Compared to traditional market structure scripts that include Change of Character (CHoCH) & Break of Structures (BOS) -- this script also includes the detection of Inducements (IDM) & Sweeps which are major components of determining other structures labeled on the chart. SMC & price a

This trend-following indicator calculates dynamic trailing stops using a modified (or unmodified) ATR method with a Wilder's moving average for smoothing. It displays separate bullish (green) and bearish (red) trailing stop lines that adjust as the market moves. recommended to be used in conjution with Gaussian Scalper XD indicator for trade entry with multiple confirmations. Gaussian Scalper XD: https://www.mql5.com/en/market/product/132204?source
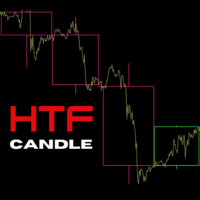
ICT Traders! Here's another cool Indicator that will allow to trade the HTF narrative while focus on price action on your entry timeframes. The following are the input for setup the indicator: Maximum Bar: The number of HTF bar you want to display Bullish Candle: The color of the bullish candle Bearish Candle: The color of the bearish candle Border Width: the width of the HTF candle drawn on the chart.
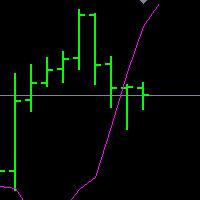
DINAPOLI,MACDP,DMP,XMP,MT5版本 帝纳波利主图MACD指标,国内又叫做:DMP,XMP,MACDP,DNMACDP。 是MACD主图化指标,参数为: FAST=8.3896 SLOW=17.5185 SIGNAL=9.0503 SHIFT=1; 主要作用: 趋势判断,动态压力辅助,SG识别。 是帝纳波利点位交易法不可缺少的指标工具。 1. 只使用 DiNapoliDMP 作为判定趋势的工具。不使用它作为判断超买 / 超卖或动量的指标。 2. 一个上升趋势信号在价格从下向上穿越DMP时被给出。一个下降趋势信号在价格从上向下穿越DMP时被给出。穿越时形成的角度非常重要,陡直的角度,接近于 90 度,往往决定了后续的趋势质量更高。 3. 正确的公式和数字的输入才能使这些研究有效。它们经历了时间的验证。
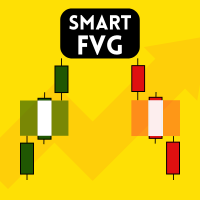
Smart FVG Indicator MT5 – MetaTrader 5에서 Fair Value Gap 및 Imbalance 감지 Smart FVG Indicator MT5 는 Fair Value Gap (FVG) 및 Imbalance 구역을 자동으로 감지하는 전문 도구입니다. Smart Money Concepts (SMC) 와 ICT 분석을 사용하는 트레이더를 위해 설계되었습니다. 이 지표는 가격 움직임을 스캔하여 유효한 FVG 및 Imbalance 구역을 찾고 차트에 실시간으로 표시합니다. 주요 기능 FVG 및 Imbalance 감지: 캔들 구조를 기반으로 가격 비효율성을 식별합니다. Imbalance 필터: 강한 가격 이동이나 유동성 변화를 감지합니다. Body Average 필터: 약한 구조를 제거하여 의미 있는 영역만 표시합니다. 동적 영역 관리: 가격이 채우거나 무효화하면 자동 업데이트됩니다続き: ```html 사용자 지정 시각화: 색상, 투명도 및 선 스타일을 조정할 수 있
FREE
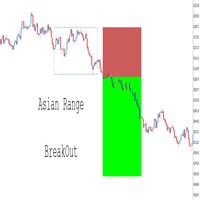
완전 맞춤 설정 가능 – 범위 시간, 색상, 선 스타일 및 리스크-보상 설정과 같은 매개변수를 수정하여 자신의 트레이딩 스타일에 맞게 지표를 조정할 수 있습니다. 트레이드 레벨 시각화 – 돌파 조건을 기반으로 진입 가격, 스톱로스(SL) 및 테이크프로핏(TP) 레벨을 자동으로 표시합니다. 전문가 어드바이저(EA)와 완벽한 통합 – RSI, 이동 평균, 구조적 돌파(BOS) 등과 같은 추가 확인 기능을 추가하여 자동화된 전략을 완벽하게 제어할 수 있습니다. 또한, 버퍼 이름을 사용자 지정 하여 EA 요구 사항에 맞게 조정할 수 있어 전략의 유연성이 더욱 향상됩니다. 멀티 자산 및 멀티 타임프레임 백테스트 – 외환, 암호화폐 및 기타 금융 상품 에서 다양한 설정을 테스트하여 최적의 트레이딩 전략을 찾을 수 있습니다. 깔끔하고 직관적인 인터페이스 – 가격 움직임에 집중할 수 있도록 방해 요소 없이 거래 신호를 쉽게 해석할 수 있도록 설계되었습니다. 이 지표는 브레이크아웃
FREE
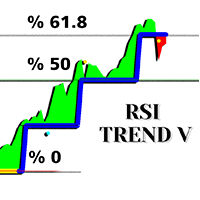
중요한 참고 사항: 스크린샷에 표시된 "일부 이미지" 는 제 인디케이터인 Suleiman Levels Indicator 및 RSI Trend V Indicator 에서 가져온 것입니다. RSI Trend V Indicator 는 트렌드 식별을 위해 설계되었으며, 피보나치와 통합되어 목표 구역과 잠재적인 반전 지점을 결정합니다. 이는 전체적인 트렌드 방향을 판단하는 데 매우 강력하고 엄격하며 유용한 인디케이터입니다. 가격 움직임이 반전될 가능성이 있는 영역에서 상승 및 하락 화살표가 나타납니다. 그러나 집중해야 할 주요 요소는 다음과 같습니다. Thick blue line - 상승 추세
Thick yellow line - 하락 추세
Green cloud above the thick green line
Red cloud below the thick yellow line
Bullish and bearish arrows 새로운 화살표가 표시될 때 나타나는 피보나치 수준을 고려하는 것이

MetaTrader 5 (MT5)용 Wormhole 시간대 지표는 단순한 거래 도구가 아닙니다. 그것은 금융 시장에서의 경쟁 우위입니다. 초보자와 전문가 모두를 염두에 두고 설계된 Wormhole은 데이터 분석과 의사결정 방식을 변화시켜 항상 한 걸음 앞서 나갈 수 있도록 도와줍니다. 왜 Wormhole 지표(무료)가 필요한가 경쟁자를 능가하십시오: 동일한 차트에서 두 가지 시간대를 동시에 볼 수 있다는 것은 항상 한 걸음 앞설 수 있다는 것을 의미합니다. 차트 간 전환을 더 이상 할 필요 없이 모든 필요한 정보가 바로 눈앞에 있습니다. 숨겨진 기회를 발견하십시오: 전통적인 시간대를 변형하고 다른 거래자들이 놓친 패턴을 발견하십시오. 5분 차트의 범위를 00:01에서 00:06으로 변경하여 00:00에서 00:05까지의 표준 시간 대신 분석할 수 있습니다. 이러한 미세한 변화는 독특한 시장 동향을 드러낼 수 있습니다. 실행 가능한 통찰을 얻으십시오: 트렌드, 반전 및 지지/저항 수준
FREE
Un order book, ou carnet est un outil numérique qui affiche en temps réel les ordres d'achat et de vente pour un actif financier spécifique, comme une action, une crypto-monnaie ou une paire de devises. Il permet aux traders de visualiser la profondeur du marché, c'est-à-dire la quantité d'ordres d'achat et de vente à différents prix. Voici une description des éléments clés d'un order book : Colonne d'achat (Bid): Affiche les ordres d'achat en attente pour un actif. Les prix d'achat sont classés
추세 지표는 금융시장 거래에 사용되는 기술 분석 분야 중 하나입니다.
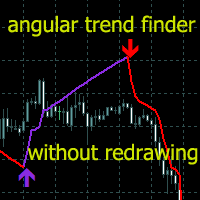
Angular Trend Lines - 추세 방향을 종합적으로 판단하고 진입 신호를 생성합니다. 캔들의 평균 방향을 매끄럽게 하는 것 외에도
또한 추세선의 경사각도 사용합니다. 갠 각도를 구성하는 원리는 경사각의 기초로 사용되었습니다.
기술 분석 지표는 촛대 평활화와 차트 기하학을 결합한 것입니다.
트렌드 라인과 화살표에는 두 가지 유형이 있습니다. 강세 방향의 빨간색 선과 화살표. 약세 방향의 보라색 선과 화살표.
표시기 기능
이 지표는 사용하기 쉽고 매개변수를 구성할 수 있으며, 추세 분석과 주문 개시를 위한 신호 수신에 사용할 수 있습니다.
지표는 다시 그려지지 않고, 화살표는 캔들 마감 시점에 나타납니다.
신호가 발생하면 여러 유형의 알림을 제공합니다.
모든 금융 상품(외환, 암호화폐, 금속, 주식, 지수)에 사용할 수 있습니다.
해당 지표는 모든 시간 범위와 차트에서 작동할 수 있습니다.
이 지표는
Get ALL my MT4 & MT5 indicators FREE — See how here
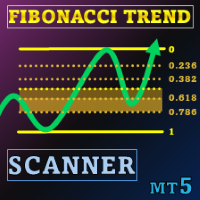
스페셜 오퍼 : ALL TOOLS , 각 $35 에 구매 가능! New tools will be $30 for the first week or the first 3 purchases ! Trading Tools Channel on MQL5 : Join my MQL5 channel to update the latest news from me 변동성이 큰 트레이딩 환경에서 강력하고 직관적인 분석 도구는 신속하게 기회를 포착하는 데 도움이 됩니다. Fibonacci Trend Scanner는 전통적인 피보나치(Fibonacci) 지표 기능과 SuperTrend를 통합할 뿐만 아니라, 통화쌍 스캔, 멀티 타임프레임 모니터링, 그리고 추세가 상승세에서 하락세로(또는 반대로) 전환될 때 인텔리전트 알림을 제공하도록 기능을 확장하였습니다. See more MT4 version
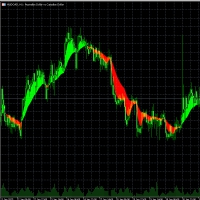
CrossMann is a simple and elegant indicator for MetaTrader 5, which represents the areas of intersection of moving averages.
This indicator displays two Exponential Moving Averages (EMA), with different periods, calculated by closing prices, and colors the ranges of their intersection in two colors - for buying and selling.
The indicator will work great on all trading instruments and timeframes in strategies where a similar principle is used.

This MetaTrader 5 indicator identifies and visually displays the trading hours of major financial markets (Europe, US, and Asia) on the chart. Through customizable colored fills, it marks the trading periods of each market, respecting server times (GMT+2) and excluding weekends. Market names are displayed near the top of the chart in Arial Black font, also with customizable color. The indicator automatically adjusts to the chart scale, maintaining the fill across its entire vertical range.
FREE

This isn't just an indicator; it's a top-tier market analysis tool that combines the power of various technical analysis techniques into one package. Perfect for traders seeking precision and clarity in their trading decisions. Key Features: HiLo Activator: Easily capture the essence of market trends. This component differentiates between bullish or bearish markets, helping you to be on the right side of the move. MACD (Moving Average Convergence Divergence): Quickly identify changes in market

Discover the Power of the QDOTRAXY Indicator: Your Key to Precise Trading Decisions! Have you ever imagined having a powerful ally that combines advanced technical analysis with real-time alerts to maximize your market operations? We introduce ULTRA ADVANCED, the indicator that revolutionizes how you make buy and sell decisions. Why Choose QDOTRAXY? Unmatched Accuracy: QDOTRAXY combines multiple technical indicators (MACD, Bollinger Bands, SAR, and Moving Average) to generate highly reliable si

Reversal Zones Pro – an indicator specifically designed for accurately identifying key trend reversal zones. It calculates the average true range of price movement from lower to upper boundaries and visually displays potential reversal zones directly on the chart, helping traders efficiently pinpoint crucial turning points in the market. Key Features: Reversal Zone Identification: The indicator visually highlights potential reversal zones directly on the chart, enabling traders to effectively id

The THREE DRAGONS is a technical indicator that portrays three mystical Chinese dragons flying through the price chart:
1. The Green Dragon (SeaGreen): - The most agile and fastest of the three - Reacts quickly to market direction changes - Usually leads the movements
2. The Red Dragon (Tomato): - Moves with balance between speed and caution - Confirms movements initiated by the Green Dragon - Its interactions with the Green Dragon may indicate opportunities
3. The Black Dragon (Black): - Th
FREE
VWAP Bands Indicator – Volume Intelligence for All Markets The VWAP Bands Indicator is a professional tool based on the Volume Weighted Average Price (VWAP), designed for traders who seek an objective reading of institutional flow, volatility, and market equilibrium. More than just a central line, the indicator combines cumulative VWAP with three dynamic volatility bands, providing a clear view of value, market excess, and reversion toward fair price throughout the trading day. Why use the VW
FREE
TendencyLine Indicator - Market Trend Analysis General Description TendencyLine is a technical indicator to help traders identify the prevailing market trend. It overlays a trend line based on a user-selected moving average on the price chart and displays a colored histogram that signals the trend direction. Main Features Trend Identification: The indicator differentiates between bullish and bearish periods with colored histogram bars. Based on Moving Averages: Uses a user-configurable moving a
FREE

Maximize your trading performance with Dd-uP , a revolutionary indicator based on an Exponential Moving Average (EMA) smoothing. This indicator is represented by a distinct yellow line on your charts, making it easy to identify market trends and providing precise and reliable trading signals. Key Features: Advanced EMA Smoothing : Track market trends with an EMA smoothing that reacts quickly to price changes, offering precise and real-time analysis. Buy and Sell Signals : Receive clear signals w
FREE

MyHistogram The MyHistogram indicator is a tool designed to help users visualize the distance between price extremes and a moving average. By calculating and displaying this distance in a histogram format, it allows to quickly assess market trends, spot potential reversals, and make more informed trading decisions. The indicator is highly customizable, enabling users to select different timeframes, moving average types, and applied price settings. Additionally, it features a color-coded syste
FREE

A tool for creating Bill Williams indicators Our tool provides the ability to set Bill Williams indicators on a chart with a mouse click. - The Awesome Oscillator (AO) indicator helps to assess the driving force of the trend. - Alligator indicator — determines the current state of the trend and possible entry and exit points. - Fractals indicator — helps to identify significant levels - Accelerator Oscillator (AC) indicator — shows the change in trend acceleration. - Market Facilitation Index
FREE

Utility of the Indicator Multifaceted Analysis : Allows for a comprehensive view of the market through different metrics (trend, volatility, momentum, risk, support/resistance). Trading Signals : Offers clear buy and sell signals, aiding traders in making entry and exit decisions. Risk Management : The risk buffer helps to assess when it is safe or risky to execute trading operations. Customizable Visualization : With multiple colors and chart styles, it becomes easy for the trader to interpre

MTF Candles Overlay View higher timeframe candles directly on your current chart without switching between multiple windows. MTF Candles Overlay displays complete higher timeframe candles (OHLC, body and wicks) as an overlay on any chart, allowing you to analyze market structure, trend direction and key price levels from multiple timeframes at the same time. Includes support for all standard MetaTrader timeframes plus a unique Yearly (Y1) timeframe for long-term market analysis. Key Features Mu
This indicator collects and systematizes the data about the spread. Its code was profiling several times and optimized in such a way that despite the presence of graphics not to slow down the work of the MT5 terminal. In addition, the indicator provides for the mode of complete invisibility (while the indicator continues to collect data and save it). Having returned to the visual display mode, you can see the work done by him.
Advantages and capabilities of the SpreadFix indicator: 1. Collects
FREE
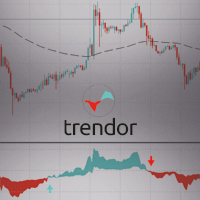
The TRENDOR 1.0 indicator is designed to identify and filter market trends using a combination of RSI and ATR indicators. This powerful trend detection system helps spot significant RSI crossovers while filtering out false signals using an ATR and an EMA (Exponential Moving Average). The purpose of this indicator is to provide clear and precise signals for optimal trading decision-making.
Main features:
Short and Long RSI: Combines the values of two RSIs (short and long) to detect market tr

Solar Prediction – Indicator for Market Price Analysis Solar Prediction is a tool designed to analyze market price movements. The indicator processes market dynamics and helps identify potential entry and exit points. Market data analysis without additional indicators
Flexible application – works on different timeframes
Ease of use – suitable for both beginners and experienced traders
Adaptability to market conditions – tracks price movement changes Solar Prediction is a solution
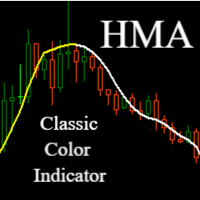
Hull Moving Average (HMA) - Faster and More Precise Trend Tracking
Hull Moving Average represents a revolutionary approach to trend analysis that overcomes the common shortcomings of traditional moving averages. This advanced indicator, developed by Alan Hull, practically eliminates the lag typical for standard moving averages while maintaining exceptional signal smoothness.
Key Benefits:
Significantly faster response to trend changes than traditional moving averages Minimal lag while mainta
FREE
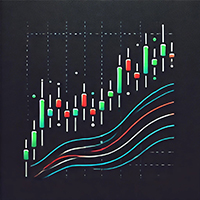
This is simple indicator for displaying Multi Moving Average line in chart, with one single Indicator. Just place the indicator in your chart, select how many MAs you want to display. And you are ready to go. Parameters can be changed on the fly by the control panel provided by the Indicator. And you can show/hide the Moving Average line just with check/unchecked in the Panel. This indicator are still in development, if you have any further feature request, please let me know in the comment.
FREE
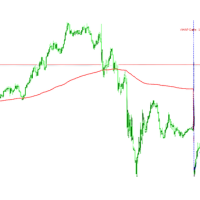
Simple Vwap with the daily, weekly and monthly
VWAP is the abbreviation for volume-weighted average price , which is a technical analysis tool that shows the ratio of an asset's price to its total trade volume. It provides traders and investors with a measure of the average price at which a stock is traded over a given period of time.
How it's used Identify entry and exit points: Traders can use VWAP to determine when to buy or sell an asset. Understand price trends : Traders can use V
FREE
Panther Scalping Indicator – The Ultimate Trading Weapon for Gold, Forex & BTC! Dominate the Markets with Precision Buy & Sell Signals! We’ve designed the Panther Scalping Indicator to give you an unfair advantage in trading Gold (XAUUSD), Forex pairs, and BTC. This powerful tool is built on the proven Panther Scalping Strategy , ensuring you never miss a high-probability trade. How It Works:
Lime Up Arrow – A clear Buy Signal when market conditions align.
Red Down Arrow – A strong

SuperTrend Indicator for MetaTrader 5
Ride Trends Like a Pro — Never Miss a Move Again Description:
The SuperTrend Indicator is your ultimate companion for mastering trend-following strategies. Designed to cut through market noise, this powerful tool combines the precision of Average True Range (ATR) with adaptive trailing stops to pinpoint trend reversals, confirm breakouts, and keep you on the right side of the market. Whether you’re trading forex, stocks, crypto, or commodities, the SuperTr
FREE

Heiken Ashi Smoothed – The Ultimate Trend Filtering Indicator for MT5 Enhance Your Trading with Smoother Trends! The Heiken Ashi Smoothed indicator is a powerful tool designed for traders who want clearer trend signals while eliminating market noise. Unlike traditional Heiken Ashi candles, this smoothed version provides fluid, lag-free price action , making it perfect for swing trading, trend following, and long-term analysis. Key Features: Crystal-Clear Trends – Filters out market noise for
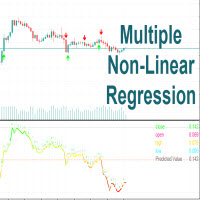
Multiple Non-Linear Regression This indicator is designed to perform multiple non-linear regression analysis using four independent variables: close, open, high, and low prices. Here's a components and functionalities: Inputs: Normalization Data Length: Length of data used for normalization. Learning Rate: Rate at which the algorithm learns from errors. Show data points: Show plotting of normalized input data(close, open, high, low) Smooth?: Option to smooth the output. Smooth Length: Length of
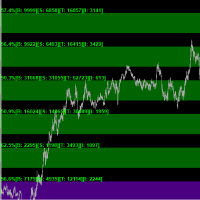
Key Features: • Multi-Zone Analysis: Track volume patterns across multiple customizable price zones • Real-Time Volume Tracking: Monitor buy/sell pressure as it develops • Dynamic Price Levels: Automatically adjusts zones around daily opening prices • Advanced Statistics: View detailed volume metrics and price action percentages
Technical Capabilities: • Volume Distribution Analysis - Buy/Sell volume ratios - Volume imbalance detection - Total trading activity monitoring - Price action directio
MetaTrader 마켓 - 트레이더를 위한 로봇 및 기술 지표는 거래 터미널에서 바로 사용할 수 있습니다.
The MQL5.community 결제 시스템은 MQL5.com 사이트의 모든 등록된 사용자가 MetaTrader 서비스에서 트랜잭션을 수행할 수 있습니다. 여러분께서는 WebMoney, 페이팔, 또는 은행 카드를 통해 자금을 예치하거나 인출하실 수 있습니다.
