MetaTrader 4용 새 기술 지표

77% discount for the next 10 buyers (original price $605): 1 left
3 Indicators in 1 indicator
Strategy based on price action
Made specifically for the best forex currency pairs
Can be used in the best time frame of the market
at a very reasonable price This indicator is basically 3 different indicatos . But we have combined these 3 indicators in 1 indicator so that you can use 3 indicators at the lowest price.
All three strategies are based on price action. But based on different trends.
가격 행동, 통화 거래 세션 탐지, 피보나치 및 탐지 기능과 함께 "Trade Wizards" 전용 지표 공식을 사용하여 주요 추세를 식별하는 데 사용되는 강력한 지표인 "TW Trend Sniper" 지표를 소개합니다. 정확도가 높은 인공지능 노이즈 제거 방법. 숙련된 트레이더와 전문 프로그래머로 구성된 "Trade Wizards 그룹" 이 설계한 이 전략을 이제 트레이더가 사용하여 트레이딩 여정을 발전시킬 수 있습니다.
자세한 내용은 "TW Trend Sniper" 기사를 읽어보세요 . 이 제품은 다음 전략을 사용하여 완전한 신호를 제공합니다. 가격 조치(스마트 머니 조항) 특정 시간 세션(AI가 감지) 피보나치 수준과 동적 지지 및 저항 이동 평균 Trade Wizards 독점 지표 공식 AI 노이즈 제거 방법
기술 사양: 신호와 SL & TP 및 표시기 자체에서는 어떤 식으로도 변경되지 않습니다. 다시 칠하지 않습니다! 변화하는 추세를 높은

Graf Mason is a tool that will make you a professional analyst! The method of determining wave movements using inclined channels qualitatively conveys the schematics of the movement of any instrument, showing not only possible reversals in the market, but also the goals of further movements!Destroys the myth that the market is alive , clearly showing the schematics of movements from one range to another! A professional tool, suitable for the medium term with the definition of the current trend!

이 거래 도구를 사용하면 15개 시장을 동시에 스캔할 수 있습니다.
2024년 새로운 거래 지표 소개:
️ 대시보드 다중 통화 다중 시간 프레임 이중 RSI.
제가 이 거래 도구를 만든 이유는 최소한 두 가지입니다.
첫째, 하나의 시장만 관찰하는 것이 지루합니다. 둘째, 다른 시장에 진입하는 순간을 놓치고 싶지 않습니다.
그렇기 때문에 동시에 다른 시장 상황도 알고 싶습니다.
이러한 이유로 여러 시장의 상황을 동시에 스캔할 수 있는 스캐너가 필요합니다.
나는 종종 빠른 RSI 라인 > (또는 <=) 느린 RSI 라인이 M1에서 H4(또는 단지 M1에서 M30)까지 시작하는 시장을 찾습니다.
그리고 M1부터 M30까지 과매도/과매수 상태인 시장을 자주 찾아봅니다.
내 분석에 동의하신다면 이것이 바로 귀하가 찾고 있던 거래 지표입니다.
시장 상황이 위의 요구 사항을 충족하는 순간을 놓치지 마십시오.
이것은 많은 훌륭한 기능을 갖춘 확률론적 스캐
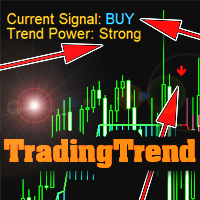
The indicator is not redrawn.
Can be used as a ready-made trading strategy.
Shows: Trend direction; Trend strength; Points of trend reversal or fading. Settings: Trend sensitivity (the lower, the more accurate) - operating sensitivity (the higher, the more accurate); Calculation method - calculation method; Info position - angle of location of the info label (or remove); Text Color - text color; Trend Color Buy - color of the BUY text; Trend Color Sell - SELL text color; Sound Al

Introduction
The "Smart Money Concept" transcends mere technical trading strategies; it embodies a comprehensive philosophy elucidating market dynamics. Central to this concept is the acknowledgment that influential market participants manipulate price actions, presenting challenges for retail traders.
As a "retail trader", aligning your strategy with the behavior of "Smart Money," primarily market makers, is paramount. Understanding their trading patterns, which revolve around supply
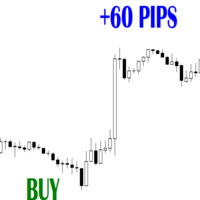
결합할 수 있는 기타 볼륨 도구: https://www.mql5.com/en/market/product/72744 높은 거래량 극단 식별: 트레이더가 강렬한 매수 또는 매도 압력이 있는 기간을 정확히 찾아낼 수 있는 강력한 도구로 지표를 배치합니다. 거래량을 활용하는 지표의 1차 완충 장치가 거래자가 시장 활동의 증가를 나타내는 거래량 급증을 식별하는 데 어떻게 도움이 되는지 강조하십시오. 잠재적인 추세 반전이나 지속을 알리는 데 있어 이러한 대량 극단적인 현상의 중요성을 강조하십시오. 이는 종종 강력한 가격 변동과 일치하기 때문입니다.
낮은 거래량 극한 식별: 시장의 우유부단함이나 참여 부족을 나타낼 수 있는 낮은 거래량 기간을 감지하는 지표의 능력을 보여줍니다. 거래량 기반 버퍼가 현재 추세의 잠재적 소진을 나타내는 약한 매수 또는 매도 압력의 인스턴스를 식별할 수 있는 방법을 강조합니다. 유동성이 낮은 기간에 거래를 피하거나 잠재적인 시장 반전이 예상되는 거래자에게 이
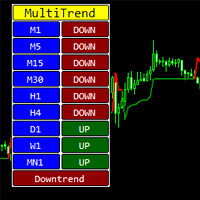
The indicator shows the direction of the trend on different timeframes.
Timeframes can be disabled in the settings.
The bottom line of the indicator reports the prevailing trend - up or down.
The indicator can be used on any trading instruments - currencies, stocks, futures, indices, metals, cryptocurrencies.
This indicator can be used as an independent trading system or as an addition to another system.

Introduction
"Smart money" is money invested by knowledgeable individuals at the right time, and this investment can yield the highest returns.
The concept we focus on in this indicator is whether the market is in an uptrend or downtrend. The market briefly takes a weak and reversal trend with "Minor BoS" without being able to break the major pivot.
In the next step, it returns to its main trend with a strong bullish move and continues its trend with a "Major BoS". The "order bloc

hint: my basic indicators are used like that KingLevel combind with KingSequence will provides basic insights of the price action of the markets and KingSequenceSgn is just for the convienent for watching. And plus with Forex Trading mentor subsccription I will assist you to win the market at first later if it's great will be upgraded to King Forex trading mentor.
It just the main chart sign of the "KingSequence" indicator.
Here is the detals from the "KingSequence" indicator
Slide 1: Ti
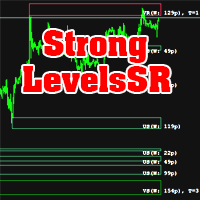
The indicator calculates support and resistance levels. There is a hint in the upper left corner. This hint can be removed. Hint in two languages (English and Russian). The width of support and resistance levels is shown. The number of levels touched is displayed. Works on all timeframes. Can be used as an independent trading system, and as an addition to another system. Download the demo version of the indicator right now and try it in the strategy tester!
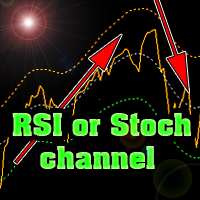
The indicator plots Stochastic or RSI levels in the price channel of a trading instrument.
Download the indicator for FREE right now and test it in the strategy tester.
It is easy to determine the trend direction and overbought or oversold levels.
The settings are standard for any of these indicators.
It is possible to change settings for each trading instrument separately.
You can use currencies, stock markets, futures or cryptocurrencies.
The indicator can be used as an independen

MT4 지표 소개: K-라인 레벨 지표, 거래자들이 100% 거래 기회를 파악하도록 돕습니다. 소개: K-라인 레벨 지표는 거래자들이 고확률 거래 기회를 식별하도록 돕는 강력한 기술 분석 도구입니다. K-라인의 고점, 저점, 시가 및 종가를 분석하여 이 지표는 가격 행동의 지지 및 저항 수준을 밝혀내고 명확한 시각적 효과로 제시합니다. 기능: 잠재적인 추세 반전 식별: 가격 행동이 정체되거나 반전될 가능성이 있는 영역을 파악하여 추세 방향으로 거래할 수 있도록 합니다. 돌파 활용: 지지 및 저항 수준의 돌파를 예측하여 돌파 모멘텀을 포착하고 이익을 극대화할 수 있도록 합니다. 입장 및 퇴장 지점 최적화: 거래의 최적 입장 및 퇴장 지점을 정확하게 파악하여 전반적인 거래 정확도를 높입니다. 장점: 100% 거래 기회 식별: 지지 및 저항 수준을 식별하여 모든 잠재적인 거래 기회를 발견하도록 돕습니다. 명확하고 이해하기 쉬운 차트: 지지 및 저항 수준을 차트에 직접 그려 넣어 시장 구
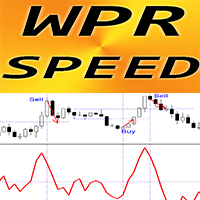
MT4용 외환 지표 "WPR SPEED" - 훌륭한 예측 도구입니다!
이 지표의 계산은 물리학의 방정식을 기반으로 합니다. WPR SPEED는 WPR 발진기 자체의 1차 파생입니다. WPR SPEED는 횡보 및 평면 시장의 스캘핑 진입에 적합합니다. WPR SPEED 표시기는 WPR 자체가 방향을 얼마나 빨리 바꾸는지 보여줍니다. 이는 매우 민감합니다. 모멘텀 스캘핑 거래 전략에는 WPR SPEED 지표를 사용하는 것이 좋습니다. 지표의 큰 크기 피크 찾기 - 반대 방향으로 열린 스캘핑 거래(그림 참조) 표시기에는 모바일 및 PC 알림이 내장되어 있습니다.
// 더 훌륭한 전문가 자문 및 지표는 여기에서 확인할 수 있습니다: https://www.mql5.com/en/users/def1380/seller // 또한 수익성 있고 안정적이며 신뢰할 수 있는 신호 https://www.mql5.com/en/signals/1887493에 참여하실 수 있습니다. MQL5 홈페이지에서
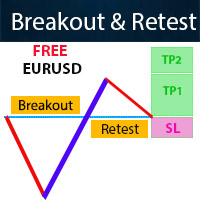
Contact me for any questions All Symbols version! It is free on EURUSD chart. Introduction The breakout and retest strategy is traded support and resistance levels. it involves price breaking through a previous level. The strategy is designed to help traders do two main things, the first is to avoid false breakouts. Many false breakouts start with a candlestick that breaks out of a level but ends with an immediate candlestick that brings the price back into the level. The second thing that the
FREE
This is a trial version, you can only replay one day's Bar! Full version: https://www.mql5.com/en/market/product/117203
Please put this file into the folder in MQL4\Indicators\
This indicator is not an EA,so it does not have the 'ORDER' function. It only simulates placing orders, so please use it with confidence.
Instructions for use: |←:Choice Bar. →:Start.You can also press the 'X' key on the keyboard to go back and the 'Z' key to go forward. X1:Bar Speed. →|:Back to current time.
N
FREE

This indicator is not an EA,so it does not have the 'ORDER' function. It only simulates placing orders, so please use it with confidence.
Instructions for use: |←:Choice Bar. →:Start.You can also press the 'X' key on the keyboard to go back and the 'Z' key to go forward. X1:Bar Speed. →|:Back to current time.
Note: If you pull too far forward in the big period, Bar in the small period may not read that far forward. At this time, you must first reduce the picture to the minimum, then press a

Market Magnet - This is not just a convenient tool, but rather an indispensable assistant for those who prefer to analyze the market using a clean chart. Sometimes even experienced traders need an additional analytical tool to identify key entry and exit points for trades. That's where Market Magnet comes in.
This indicator is ideal for those who often have difficulty identifying trend inflection points or drawing trend lines on a chart. It offers a visual representation of key market moments
The indicator determines the ATR value (points) in a classic way (taking into calculation paranormal bars/candles) and more correctly - ignoring paranormal movements of the Instrument. Correctly it is excluding paranormal bars from the calculation, extremely small bars (less than 5% of the standard ATR) and extremely large bars (more than 150% of the standard ATR) are ignored. The Extended version - allows you to set calculation parameters and a lot of other input parameters Ver

EMA Above Below Bid price Технический индикатор в помощь трейдеру. Данный индикатор, показывает расположение пяти ЕМА,
пяти средних скользящих, относительно цены формирующей японские свечи или бары (цена Bid ).
О понятии ЕМА.
Скользящая средняя (moving average, MA) — это дополнительная линия на графике цены актива.
Внешне она повторяет график цены, но с небольшим запозданием и более гладко, без колебаний. Основные характеристики:
1. Показывает тренды. Если скользящая устрем
FREE

High and Low Levels EMA Технический индикатор в помощь трейдеру. Однажды пришла идея при изучении индикатора Moving A verage ( MA ).
Так как мувинги эти сглаженное, среднее значения цены за выбранный период, то как и у обычной цены и у мувинга
должны быть «хаи и лои».
Данный индикатор, показывает уровни High и Low . Динамических уровней поддержки и сопротивления.
О понятии High и Low .
Хай — от английского high — обозначает наиболее высокую цену («рынок на хаях » — капитализ
FREE
Highly configurable Trader Dynamic Index (TDI) indicator.
Features: Highly customizable alert functions (at levels, crosses, direction changes via email, push, sound, popup) Multi timeframe ability (higher and lower timeframes also) Color customization (at levels, crosses, direction changes) Linear interpolation and histogram mode options Works on strategy tester in multi timeframe mode (at weekend without ticks also) Adjustable Levels Parameters:
TDI Timeframe: You can set the lower/higher
FREE
The presented product is an effective trend indicator which, depending on the settings, can be used for both short-term trading (scalping) and medium/long-term trading strategies. The ease of use of the indicator makes it a good choice for both beginners and experienced traders. The essence of the NRTR (Nick Rypock Trailing Reverse) indicator is that it is always located at a constant distance from the reached price extremes - below the chart on uptrends and above the chart on downtrends. The fo

This indicator will show week and monthhigh low, very useful to understand the market sentiment. To trade within the range/ break out. Low- can act as support- can used for pull back or break out High- can act as resistance- can used for pull back or break out Breakout strategy refers to the day trading technique that provides traders with multiple opportunities to go either long or short . The main idea is to identify the trend in its most juicy state followed by a trending move.
FREE

The indicator defines the buy and sell arrows with high performance and consistent results. Suitable for trend trading or following the trend. Automatic analysis of market opportunities ; Help traders earn more from their investments;
Never repaints, recalculates or backpaints signals; This is FREE demo version of the indicator and works only on "EUR USD M5" . The demo version does not work on SUFFIX OR PREFIX brokers ! Forex Trend Commander All details about the indicator here :
FREE

"NEXT GENERATION ARROWS INDICATOR, SMALL LOSSES BIG PROFITS!" Buy Infinity Trend Commander MT4 Indicator And You Will Get Trends Reversing PRO Indicator for FREE !
Trading is not a simple job. To the uninitiated, trading is an expensive endeavour. Many beginning Traders make one basic mistake: they start their business without a clear vision; without a clear idea of how to achieve what they want. However, we should not forget that Your winning trades should always be bigger than the losin

Best strategy,
Easy trade ,
Support of version update in the future MT My Way: develop for new traders with no experience It is a very simple trade. Open the order when there is signal
and close the order when there is exit or found the next opposite signal. For experienced traders, It will be very easy to trade.
TRADE: Forex
TIME FRAME: All Time Frame
SYMBOL PAIR: All Symbol
SETTINGS:
CALCULATE BARS: Value or bars used must be large enough to calculate the formula. Fo

The indicator defines the buy and sell arrows with high performance and consistent results. Suitable for trend trading or following the trend. Automatic analysis of market opportunities ; Help traders earn more from their investments;
Never repaints, recalculates or backpaints signals; This is FREE demo version of the indicator and works only on "GBP USD H1" . The demo version does not work on SUFFIX OR PREFIX brokers ! ProTrading Arrow - All details about the indicator here : Work
FREE

The indicator defines the buy and sell arrows with high performance and consistent results. Suitable for trend trading or following the trend. Automatic analysis of market opportunities ; Help traders earn more from their investments;
Never repaints, recalculates or backpaints signals; This is FREE demo version of the indicator and works only on " USDJPY M30" . The demo version does not work on SUFFIX OR PREFIX brokers ! ProTrading Arrow - All details about the indicator here : Wor
FREE
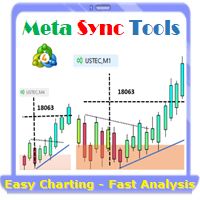
Supercharge Your MetaTrader Analysis and Trading with Meta Sync Tools! Struggling to analyze price action across different timeframes? Meta Sync Tools eliminates the frustration of unsynced crosshairs and charts, allowing seamless multi-timeframe analysis. Missing key correlations between assets and constantly switching between charts? Meta Sync Tools empowers you to visualize relationships between instruments effortlessly. Tired of wasting time on repetitive tasks? With 30+ Customizable Short

hint: my basic indicators are used like that KingLevel combind with KingSequence will provides basic insights of the price action of the markets and KingSequenceSgn is just for the convienent for watching. And plus with Forex Trading mentor subsccription I will assist you to win the market at first later if it's great will be upgraded to King Forex trading mentor.
Slide 1: Title Slide Title: Unveiling Market Rhythms with Advanced Price Momentum Analysis Subtitle: A Revolutionary Trading Ind

Use GANN 369 to use a combination of 30's,60's,90's time to cross 3's,6's,9's. Any larger combination of these cross smaller combinations of these
Using GANN 369 Method for Trading Reversals The GANN 369 method, inspired by the works of W.D. Gann and Nikola Tesla's 3, 6, 9 numerical patterns, can be employed to identify potential reversals in financial markets. By combining specific periods (30, 60, and 90) with the numbers 3, 6, and 9, traders can seek opportunities for trend changes.

Overview
In the evolving landscape of trading and investment, the demand for sophisticated and reliable tools is ever-growing. The AI Trend Navigator is an indicator designed to meet this demand, providing valuable insights into market trends and potential future price movements. The AI Trend Navigator indicator is designed to predict market trends using the k-Nearest Neighbors (KNN) classifier.
By intelligently analyzing recent price actions and emphasizing similar values, it help

- It is 30$ now - 50% Discount (Real price is 60$) Contact me for instruction, any questions! Introduction Triangle chart patterns are used in technical analysis , which is a trading strategy that involves charts and patterns that help traders identify trends in the market to make predictions about future performance.
Triangle Pattern Scanner Indicator It is usually difficult for a trader to recognize classic patterns on a chart, as well as searching for dozens of charts and time frames w
Our custom Kalman Filter indicator is a sophisticated, adaptive tool designed for MetaTrader 4 (MT4), giving traders a dynamic approach to analyzing the financial markets. This indicator is based on the Kalman Filter algorithm, a powerful statistical method used to estimate linear dynamic systems. It is specifically designed for traders who need an advanced, responsive tool to monitor market trends and make informed decisions. We have slightly modified the algorithm for this filter to provide b

on free demo press zoom out button to see back.. cnt number is bar numbers.you can change up to 3000 related to chart bars numbers. minimum value is 500. there is g value set to 1.01. no need to change it.
this indicator almost grail,no repaint and all pairs ,all timeframe indicator. there is red and blue histograms. if gold x sign comes on red histogram that is sell signal. if blue x sign comes on blue histogram that is buy signal. this indicator on thise version works all pairs.al timeframes

Symbols must be separated by commas (,) and entered into the parameters exactly as displayed by your broker to ensure they are recognized in the dashboard. These symbols will be used for analysis by the indicator.
With one click open any pair any timeframe directly from dashboard The MA Speedometer Dashboard is a highly functional MetaTrader 4 (MT4) indicator designed to enhance trading strategies through dynamic market analysis. It offers robust features for identifying market trends, trading

You can visually backtest Elliot Wave Impulse to see how it behaved in the past!
Manual guide: Click here Starting price of $49 for the first 25 copies ( 12 left)! -- Next price is $99 .
This indicator is unstoppable when combined with our other indicator called Katana . After purchase, send us a message and you could get it for FREE as a BONUS! The Elliot Wave Impulse is a pattern identified in the Elliott Wave Theory, a form of technical analysis used to a

volatility level indicator is a volatility oscillator to see trend reversal points. price trends has reverese when volatility inreased . this indicator show trend reversal points volatility. mostly same level up and down volatility is reversal points. red colour shows up points of volatilty.and probably trend will down. blue colour oscillator shows deep point of price when increased volatiliyty. on pictures horizontal lines on oscillator has drawed by hand.to see the before level and compare now

The PERFECT TREND HIT creates BUY and SELL perfect trend arrow signals based on ADX EMA AND RSI And all filters inbuilt with accurate trend entries. Furthermore, the indicator and template display the trend direction, strength, and trade recommendation for independent price charts. ROCK WITH THE TREND Moreover, it shows the final trade recommendation to BUY or SELL with all filters and displays that information as arrow signals and pop up in the chart. The indicator works well for new and
RSI Pro Analyser Indicator는 동시에 여러 시간대에 걸쳐 정보에 입각한 결정을 내리려는 트레이더를 위해 설계된 강력한 도구입니다. 이 지표는 RSI를 사용하여 과매수, 과매도 및 추세 신호를 제공하므로 시장 진입 기회를 더 쉽게 식별할 수 있습니다. 주요 장점은 다양한 시장 상황을 나타내는 명확하고 뚜렷한 색상 코드 덕분에 읽기 쉽다는 것입니다.
이 지표는 RSI 값과 관련 신호를 5가지 서로 다른 시간대(D,H4,H1,M30,M15)로 표시하므로 거래자는 포괄적인 시장 관점을 얻고 여러 시간대에 대해 정보에 입각한 결정을 내릴 수 있습니다.
색상 변경을 사용하여 다양한 기간에 걸친 추세와 잠재적 반전을 식별합니다. 과매수 및 과매도 영역을 찾아 역추세 또는 추세 반전 거래 기회를 찾아보세요.
빨간색: 하락세를 나타내는 RSI.
녹색: 상승 추세를 나타내는 RSI.
진한 빨간색: RSI가 과매도 영역을 나타냅니다.
진한 녹색: RSI가 과매수 영

이 거래 도구를 사용하면 15개 시장을 동시에 스캔할 수 있습니다.
2024년 새로운 거래 지표 소개:
️ 대시보드 다중 통화 다중 시간 프레임 이중 CCI.
제가 이 거래 도구를 만든 이유는 최소한 두 가지입니다.
첫째, 하나의 시장만 관찰하는 것이 지루합니다. 둘째, 다른 시장에 진입하는 순간을 놓치고 싶지 않습니다.
그렇기 때문에 동시에 다른 시장 상황도 알고 싶습니다.
이러한 이유로 여러 시장의 상황을 동시에 스캔할 수 있는 스캐너가 필요합니다.
나는 종종 빠른 CCI 라인 > (또는 <=) 느린 CCI 라인이 M1에서 H4(또는 단지 M1에서 M30)까지 시작하는 시장을 찾습니다.
내 분석에 동의하신다면 이것이 바로 귀하가 찾고 있던 거래 지표입니다.
시장 상황이 위의 요구 사항을 충족하는 순간을 놓치지 마십시오.
이것은 많은 훌륭한 기능을 갖춘 확률론적 스캐너 또는 대시보드입니다.
빠른 CCI 라인의 데이터를 표시할 수 있습니다.

Introduction
The Price Action, styled as the "Smart Money Concept" or "SMC," was introduced by Mr. David J. Crouch in 2000 and is one of the most modern technical styles in the financial world. In financial markets, Smart Money refers to capital controlled by major market players (central banks, funds, etc.), and these traders can accurately predict market trends and achieve the highest profits.
In the "Smart Money" style, various types of "order blocks" can be traded. This indicator

Waddah Explosion Scanner Features : Waddah Trend, Explosion Increase/Decrease Trend Percentage with Threshold DeadZone Trend Direction Aligned Checks Highlight and Alerts Multi-Timeframe & Multi-Currency Detailed Product Description and Free Demo: https://abiroid.com/product/abiroid-waddah-scanner/
Customizable Threshold: With customizable threshold, you can identify best trading opportunities in volume-based trading. Use Trend Height (x times Explosion) : Trend height in relation to the exp

Title: BBMA Structure Guide - BBMA Structure Guide
Description: BBMA Structure Guide is a specialized MQL4 indicator designed to help traders understand the journey of BBMA structure more easily and efficiently. BBMA, or "Bollinger Bands Moving Average," is known for its motto "One Step Ahead," highlighting the importance of understanding market structure in depth.
With BBMA Structure Guide, you can quickly identify the underlying market structure patterns that drive price movements. This w
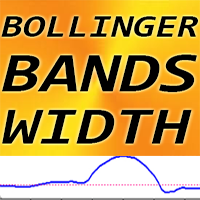
MT4에 대한 외환 표시 볼린저 밴드 폭, 다시 그리기 없음.
-BB 폭 지표는 표준 볼린저 밴드 지표와 함께 사용할 수 있습니다. -이 소프트웨어는 모든 Bollinger Bands 표시기 팬에게 필수입니다. 왜냐하면 이들의 조합은 매우 다양하기 때문입니다. 브레이크아웃 거래에 효율적 -BB 폭 표시기는 볼린저 밴드 사이의 거리(스팬)를 보여줍니다.
BB 폭을 사용하는 방법(그림의 예 참조): 1) 지난 6개월간 BB Width의 가장 낮은 값을 찾아 여기에 25%를 더해 LEVEL을 구합니다. 2) BB 폭 표시기에 LEVEL을 부착합니다. 또한 Bollinger Bands 표시기를 차트에 첨부하십시오. 3)볼린저 밴드 지표 경계선과 BB 너비 값이 LEVEL보다 낮아질 때까지 가격이 고정될 때까지 기다립니다. 4) 볼린저 밴드 인디케이터 보더(캔들은 밴드 외부에서 닫혀야 함)를 통한 돌파를 예상하고 BB 폭을 확인하세요. LEVEL보다 높아야 합니다. 5) 돌파 방향으
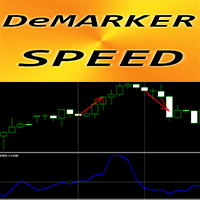
MT4용 외환 지표 "DeMarker 속도"
이 지표의 계산은 물리학의 방정식을 기반으로 합니다. DeMarker Speed는 DeMarker 자체의 첫 번째 파생물입니다. DeMarker 오실레이터 곡선은 지표 계산 기간 동안 이전 고점과 저점을 기준으로 현재 가격 위치를 나타냅니다. DeMarker Speed는 표준 DeMarker 오실레이터가 OverSold/OverBought 영역에 있을 때 항목을 스캘핑하는 데 적합합니다(그림 참조). DeMarker 속도 표시기는 DeMarker 자체가 방향을 얼마나 빨리 바꾸는지 보여줍니다. 이는 매우 민감합니다. DeMarker 속도 표시기의 값이 < 0인 경우: 속도는 음수입니다. DeMarker 속도 표시기의 값이 > 0인 경우: 속도는 양수입니다. 표시기에는 모바일 및 PC 알림이 내장되어 있습니다.
// 더 훌륭한 전문가 자문 및 지표는 여기에서 확인할 수 있습니다: https://www.mql5.com/en/users
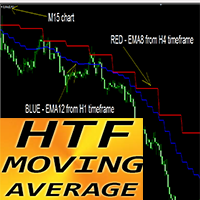
MT4에 대한 외환 표시 HTF 이동 평균
MT4용 전문 HTF MA 표시기로 거래 방법을 업그레이드하세요. HTF는 더 높은 시간 프레임을 의미합니다. 이 지표는 가격 행동 항목이 있는 추세 거래자에게 탁월합니다. HTF MA 표시기를 사용하면 더 높은 기간의 이동 평균을 현재 차트에 연결할 수 있습니다. 지표는 더 높은 시간대의 추세를 보여줍니다. --> 이는 항상 수익성 있는 방법입니다. HTF MA 지표는 낮은 위험으로 큰 이익을 얻을 수 있는 기회를 제공합니다.
사용하는 방법: MA를 D1에서 H4 또는 H1 차트로 연결 H4에서 H1, M30 또는 M15 차트로 MA 연결 등 (사진 참조)
// 더 훌륭한 전문가 자문 및 지표는 여기에서 확인할 수 있습니다: https://www.mql5.com/en/users/def1380/seller // 또한 수익성 있고 안정적이며 신뢰할 수 있는 신호 https://www.mql5.com/en/signals/188749
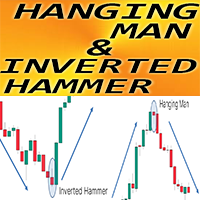
MT4용 외환 지표 "행잉맨과 역해머 패턴"
"매달린 사람과 거꾸로 된 망치 패턴" 지표는 가격 행동 거래에 대한 매우 강력한 지표입니다. 다시 칠하지 않고 지연도 없습니다. 지표는 차트에서 강세를 보이는 역해머 패턴과 약세 행잉맨 패턴을 감지합니다. Bullish Inverted Hammer - 차트의 파란색 화살표 신호(그림 참조) Bearish Hang Man - 차트의 빨간색 화살표 신호(사진 참조) PC, 모바일 및 이메일 알림이 포함되어 있습니다. "매달린 사람과 거꾸로 된 망치 패턴" 표시기는 지원/저항 수준과 결합하는 데 탁월합니다: https://www.mql5.com/en/market/product/100903
// 더 훌륭한 전문가 자문 및 지표는 여기에서 확인할 수 있습니다: https://www.mql5.com/en/users/def1380/seller // 또한 수익성 있고 안정적이며 신뢰할 수 있는 신호 https://www.mql5.com/en/
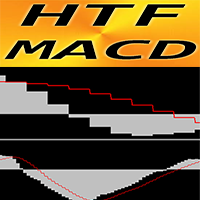
MT4용 외환 표시 HTF MACD 발진기
HTF는 더 높은 시간 프레임을 의미합니다. MACD 지표 자체는 추세 거래에서 가장 인기 있는 지표 중 하나입니다. 이 지표는 가격 조치 항목이 있거나 다른 지표와 결합된 다중 시간 프레임 거래 시스템에 탁월합니다. HTF MACD 표시기를 사용하면 더 높은 시간대의 MACD를 현재 차트에 첨부할 수 있습니다. --> 이는 전문적인 거래 접근 방식입니다. 표시기에는 모바일 및 PC 알림이 내장되어 있습니다.
// 더 훌륭한 전문가 자문 및 지표는 여기에서 확인할 수 있습니다: https://www.mql5.com/en/users/def1380/seller // 또한 수익성 있고 안정적이며 신뢰할 수 있는 신호 https://www.mql5.com/en/signals/1887493에 참여하실 수 있습니다. 본 MQL5 웹사이트에서만 제공되는 오리지널 제품입니다.
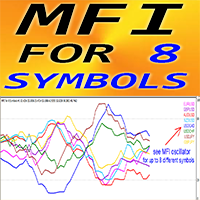
MT4용 외환 표시기 "8개 기호에 대한 MFI".
MFI(자금 흐름 지수)는 과매도 및 과매수 영역을 식별하기 위해 가격 및 거래량 데이터를 사용하는 기술 오실레이터입니다. MFI가 80보다 높을 때 과매수에서 매도 항목을 가져오고, 20보다 낮을 때 과매도에서 구매 항목을 가져오는 것이 좋습니다. MFI는 다이버전스 탐지에 매우 유용하며 Price Action과 결합하는 것도 좋습니다. "8개 기호에 대한 MFI"는 하나의 차트에서 최대 8개 기호의 MFI 값을 제어할 수 있는 기회를 제공합니다. MFI 오실레이터는 강세 및 약세 가격 모멘텀에 대한 정보를 제공합니다.
// 더 훌륭한 전문가 자문 및 지표는 여기에서 확인할 수 있습니다: https://www.mql5.com/en/users/def1380/seller // 또한 수익성 있고 안정적이며 신뢰할 수 있는 신호 https://www.mql5.com/en/signals/1887493에 참여하실 수 있습니다. 본
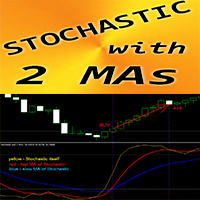
MT4용 외환 지표 "확률 및 2개 이동 평균"
스토캐스틱 오실레이터는 시장 최고의 지표 중 하나이며 많은 트레이더에게 완벽한 도구입니다. "스토캐스틱 및 2개 이동 평균" 표시기를 사용하면 스토캐스틱 오실레이터의 빠르고 느린 이동 평균을 볼 수 있습니다. 과매수 구역 - 80 이상; 과매도 1 - 20 미만 80 영역 이상에서 매도 항목을 가져오고 20 영역 미만에서 구매 항목을 가져오는 것이 좋습니다. 매수, 매도 진입 조건은 사진에서 확인하실 수 있습니다 매수(매도) 신호 조건을 고려하십시오. (1) -과매도(overBought)에서 빠른 MA가 느린 MA를 상향(하향) 교차합니다. 매수(매도) 거래 개시 (2) -확률적 가치는 과매수 영역에서 빠른 MA를 하향 교차합니다(과매도 영역에서 빠른 MA를 상향 교차): 매수(매도) 거래 종료
// 더 훌륭한 전문가 자문 및 지표는 여기에서 확인할 수 있습니다: https://www.mql5.com/en/users/def13

In a departure from the conventional approach, traders can leverage the bearish engulfing candlestick pattern as a buy signal for short-term mean reversion trades. Here's how this alternative strategy unfolds: The bearish engulfing pattern, (typically signaling a reversal of bullish momentum) , is interpreted differently in this context. Instead of viewing it as a precursor to further downward movement, we perceive it as an indication of a potential short-term bounce or mean reversion in prices.
FREE

The Tripl indicator is designed to visually display the current trend in the market. One of the key aspects of currency market analysis is identifying a trend, which is a stable direction in which prices are moving. For this purpose, the Tripl indicator uses calculations that smooth out sharp fluctuations that do not have a significant impact on the overall trend of price movements.
A trend can be either upward (bullish) or downward (bearish). Most often, a trend develops for a long time befo

The Deep Space Divergence indicator carefully analyzes price dynamics, identifying temporary weakening of the trend or sharp changes in its direction. By monitoring the readings of this indicator, you can easily notice changes in the market and take appropriate action. Entering the market may be easy, but staying in it is much more difficult. With Deep Space Divergence, you will have a reliable base to successfully stay ahead of the trend. This indicator allows you to analyze historical data an
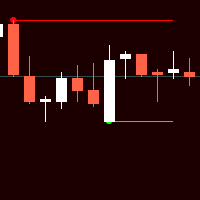
Индикатор Форекс и бинарных опционов основан на простых паттернах из двух свечей. Стрелки вообще не рисуют. Даже при смене таймфреймов.
В настройках можно включить или отключить линию уровня.
Также в настройках можно менять коды стрел, их цвета (также цвета линии уровней), Размер и расстояние от свечи (баров).
Индикатор прост в применении. А настройки тоже не сложные. Единственно не рекомендуется увеличивать период (step). По умолчанию прописано 500. Больше этого уже загружает терминал.
FREE
Please feel free to contact me if you need any further information.
Please let me know if you have any questions.
I hope the above is useful to you. MT Trend Pro: "Trade according to the trend and you will be a winner." There is Supply&Demand and Fibo to help set SL and TP.
TRADE: Forex
TIME FRAME: All Time Frame
SYMBOL PAIR: All Symbol
SETTINGS:
SIGNAL FOLLOW TREND: Input period (>1)
CANDLE MA FILTER TREND: Set MA to change the candle color and filter signals.
FIBO TREND:
This trading system is based on mathematical probability. In this case, 5 consecutive candles are compared with each other. For a logical comparison, consider these 5 candles as 1 candle on the M5 timeframe. Therefore, the comparison begins with the opening of a candle on the M5 timeframe. The probability of a match is 50% in the 1st candle, 25% in the 2nd candle, 12.5% in the 3rd candle, 6.25% in the 4th candle, 3.125% in the 5th candle. Thus, the 5th candle has a probability of matching in 1

About Waddah Multimeter (free): This product is based on the WAExplosion Indicator. It helps identify explosive market trends and potential trading opportunities. Waddah Multi-meter (Multi-timeframe) Check out the detailed product post here: https://abiroid.com/product/simple-waddah-multimeter/
Features: Waddah Trend Direction Trend Strength (above/below explosion line or deadzone) Trend Explosion Alert Alignment alerts Multi-timeframe Custom currency Multi indicators on same chart (unique p
FREE
Dynamic Arc is a non-redrawing channel indicator based on the use of double smoothing moving averages. The difference between the Dynamic Arc indicator and other channel indicators such as Bollinger Band is that it uses double smoothed moving averages. This allows you to more accurately determine the direction of market movement, but makes the indicator less sensitive. However, thanks to double smoothing, it provides a clearer and more stable representation of channels on the chart, which helps
Working with the Channel Motion Tracker indicator is as simple as possible. Just react to the arrows that the indicator displays. Each arrow represents an explicit command to action. The signals generated by this indicator are accurate enough to allow you to trade based on this information.
One of the main advantages of the indicator is its ability to build high-quality channels and generate signals for entering the market. This is great for the trader who always finds it difficult to choose
AlphaTrend AM is an indicator that allows you to open a position at the very beginning of a significant price movement. The second most important quality of the indicator is the ability to follow the trend as long as possible in order to obtain all potential profits while minimizing potential losses. The indicator allows you to notify the user about your signals by sending messages to the terminal and e-mail. This indicator does not repaint or not recalculate.
The indicator is a synthesis of t

TrendExpert TrendExpert is a sophisticated MQL trading strategy indicator developed by TradeAdviser LLC. It combines advanced technical indicators and risk management principles to deliver consistent and profitable trading outcomes in the financial markets. This strategy is designed to be robust, adaptable, and suitable for various market conditions. Key Features: Utilizes Moving Averages (MA) for trend identification and confirmation. Implements Stop Loss (SL) mechanisms for effective risk man
FREE

With the growth of information technology and the increasing number of participants in financial markets, traditional analysis tools are becoming less effective. Conventional technical indicators, such as the moving average or stochastic, in their pure form are unable to accurately determine the direction of the trend or its reversal. Is it possible to find an indicator that remains effective for 14 years without changing its parameters, and at the same time adapts to market changes? Yes, such

Auto Multi Channels VT Ещё один технический индикатор в помощь трейдеру. Данный индикатор, автоматически показывает, наклонные каналы в восходящем,
нисходящем и боковом движении цены, т.е. тренды. (Внутри дня. Среднесрочные и долгосрочные, а также Восходящие, нисходящие и боковые).
О понятии Тренд. На бирже, трендом называется направленное движение ценового графика в одну из сторон (вверх или вниз) . То есть, тренд в трейдинге — это ситуация,
когда цена определенное время возрастает или

Precision Pivot Points Yuri Congia Description: Precision Pivot Points is a sophisticated indicator designed to identify potential market reversal points with accuracy and precision. Utilizing advanced algorithms, this indicator automatically calculates key support and resistance levels based on pivot point analysis. Pivot points are essential tools used by traders worldwide to make informed trading decisions and optimize their trading strategies. Join me in the exciting world of financial trad
FREE

Yuri Congia Market Info Indicator
Description: The Yuri Congia Market Info Indicator is a tool for traders, providing a wide range of key data directly on the chart. Developed by Yuri Congia, this indicator offers detailed information on the current price, spread, daily highs and lows, remaining time before candle close, and more. It's an essential tool for traders who want immediate access to crucial information during their trading operations. Join me in the exciting world of financial trad
FREE

Safe Trade Indicator MT4
The Safe Trade indicator is an analytical and technical tool that has different features and very accurate signals. This indicator can be used in various markets such as the stock market and the forex market. It states and also provides buy and sell signals.
Features of the Safe Trade indicator
Receiving signals as notifications on the Metatrader mobile application. Receive signals by email. Receiving signals in the form of warning messages or alarms on Metatrader.

Unveil the Secret to Trading with Joker's TrendMaster!
Ready to outperform the markets with a proven and reliable strategy? Look no further! Introducing Joker's TrendMaster, the revolutionary indicator crafted by Yuri Congia! With Joker's TrendMaster, you'll gain access to a powerful combination of advanced technical analysis and unique strategic insights.
Limited-time Special Opportunity: Seize the moment! Be among the first 10 (Purchasing 1/10) to seize this unique opportunity, and not

MACD is probably one of the most popular technical indicators out there. When the market is trending, it actually does a pretty good job, but when the market starts consolidating and moving sideways, the MACD performs not so well. SX Impulse MACD for MT5 is available here . Impulse MACD is a modified version of MACD that works very well for trading Forex, stocks, and cryptocurrencies. It has its own unique feature which perfectly filters out the values in a moving average range and enables it t
123456789101112131415161718192021222324252627282930313233343536373839404142434445464748495051525354555657585960616263646566676869707172737475767778798081828384858687888990919293949596979899100101102103104105106107108109110111112113114115116117118119120121122123124125126127128129130131132133134135136137138
MetaTrader 마켓은 과거 데이터를 이용한 테스트 및 최적화를 위해 무료 데모 거래 로봇을 다운로드할 수 있는 유일한 스토어입니다.
어플리케이션의 개요와 다른 고객의 리뷰를 읽어보시고 터미널에 바로 다운로드하신 다음 구매 전 트레이딩 로봇을 테스트해보시기 바랍니다. 오직 MetaTrader 마켓에서만 무료로 애플리케이션을 테스트할 수 있습니다.
트레이딩 기회를 놓치고 있어요:
- 무료 트레이딩 앱
- 복사용 8,000 이상의 시그널
- 금융 시장 개척을 위한 경제 뉴스
등록
로그인
계정이 없으시면, 가입하십시오
MQL5.com 웹사이트에 로그인을 하기 위해 쿠키를 허용하십시오.
브라우저에서 필요한 설정을 활성화하시지 않으면, 로그인할 수 없습니다.