|
9+ 年
経験
|
9
製品
|
82
デモバージョン
|
|
1
ジョブ
|
1
シグナル
|
0
購読者
|
Full TIme Trader
において
Freelancer
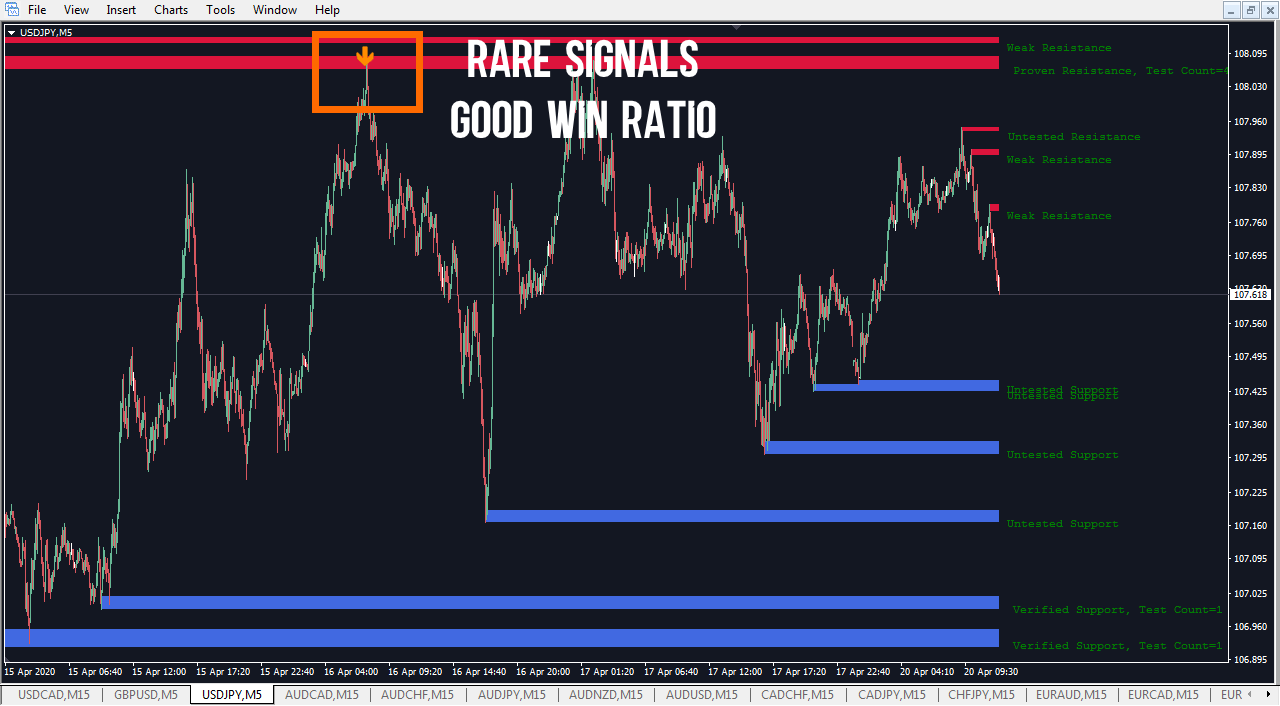
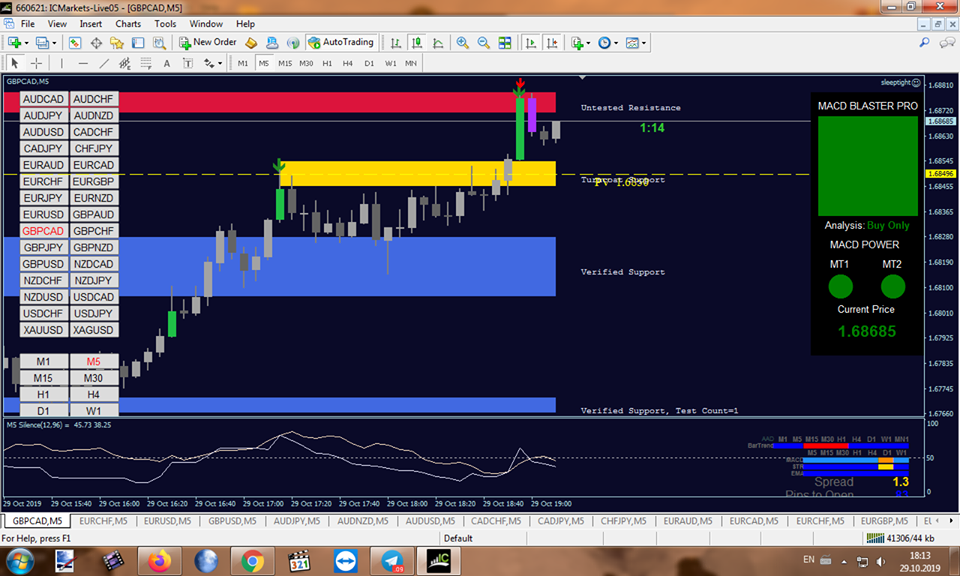
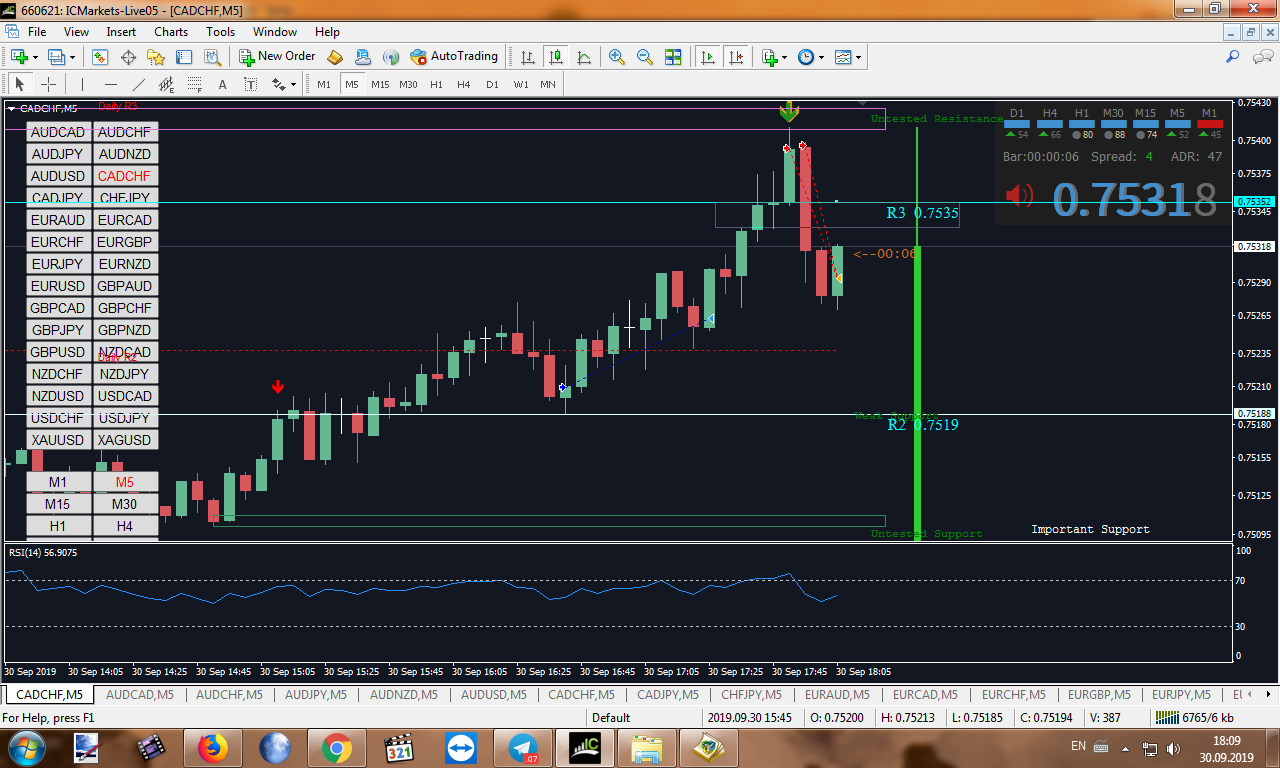
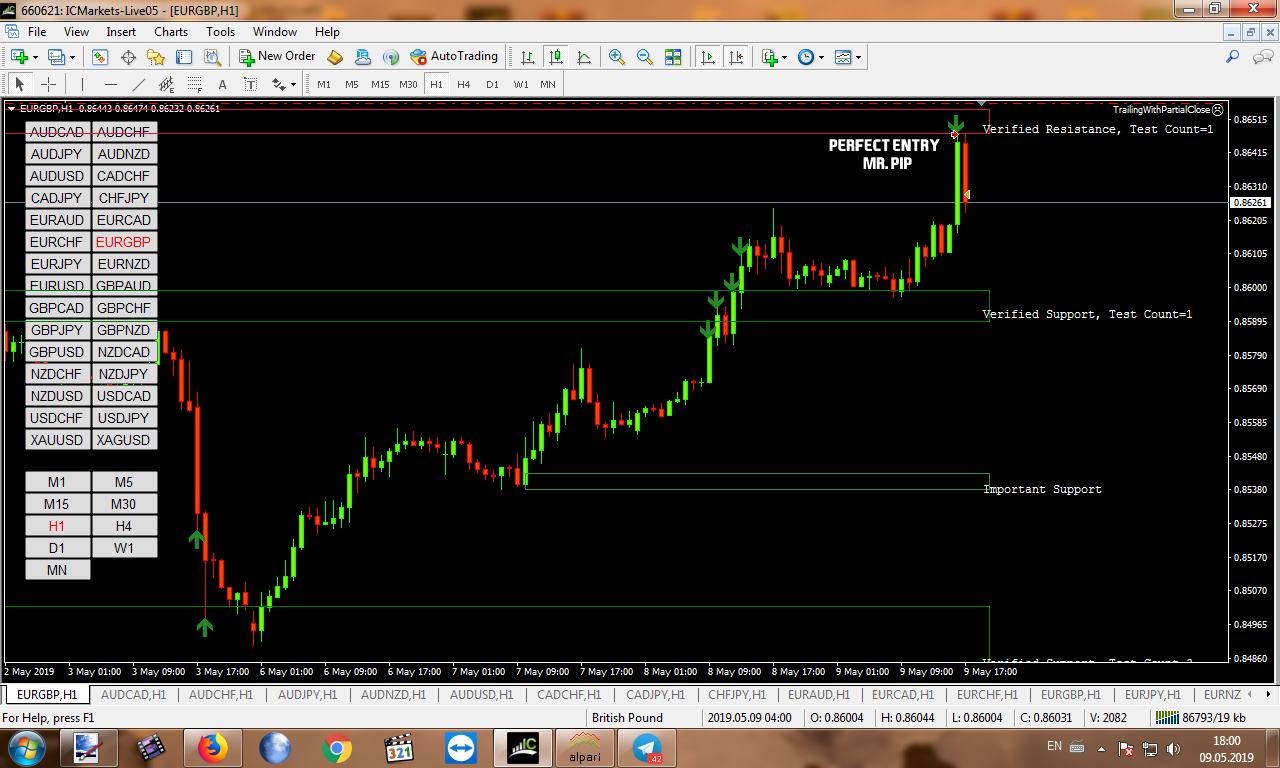
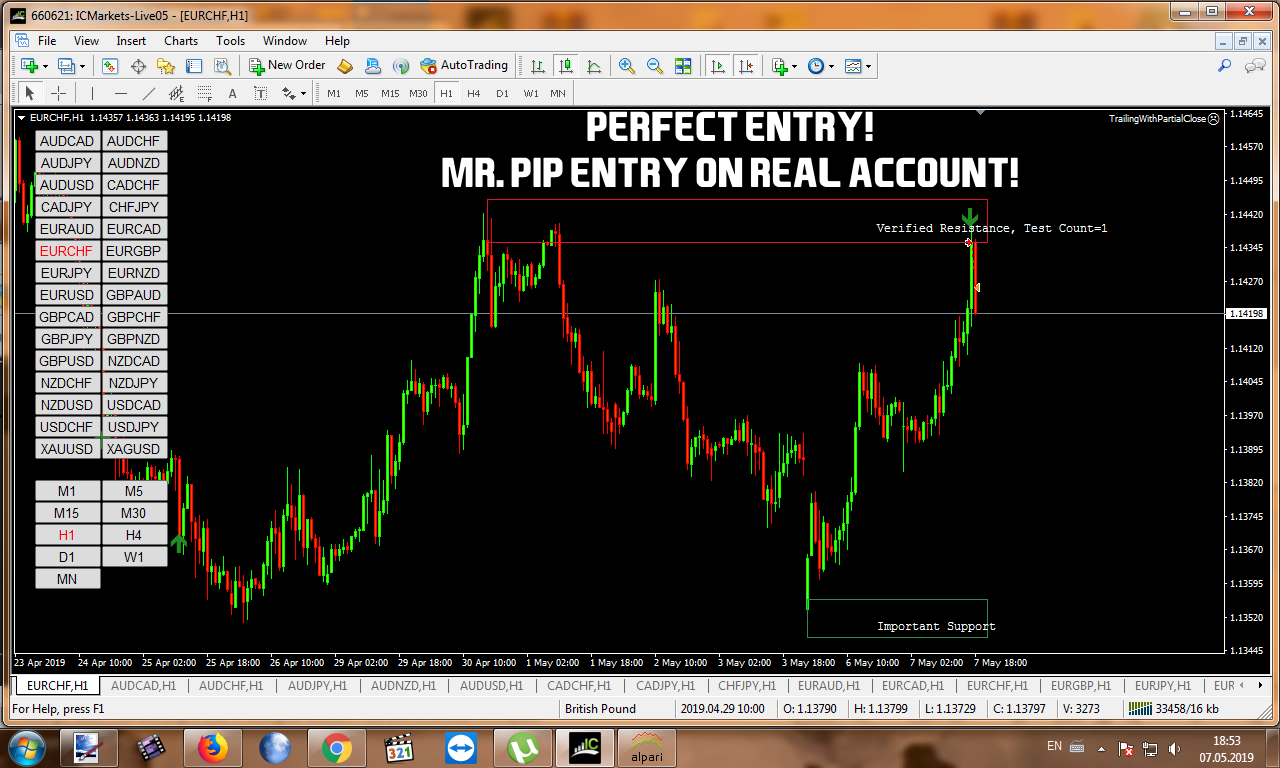
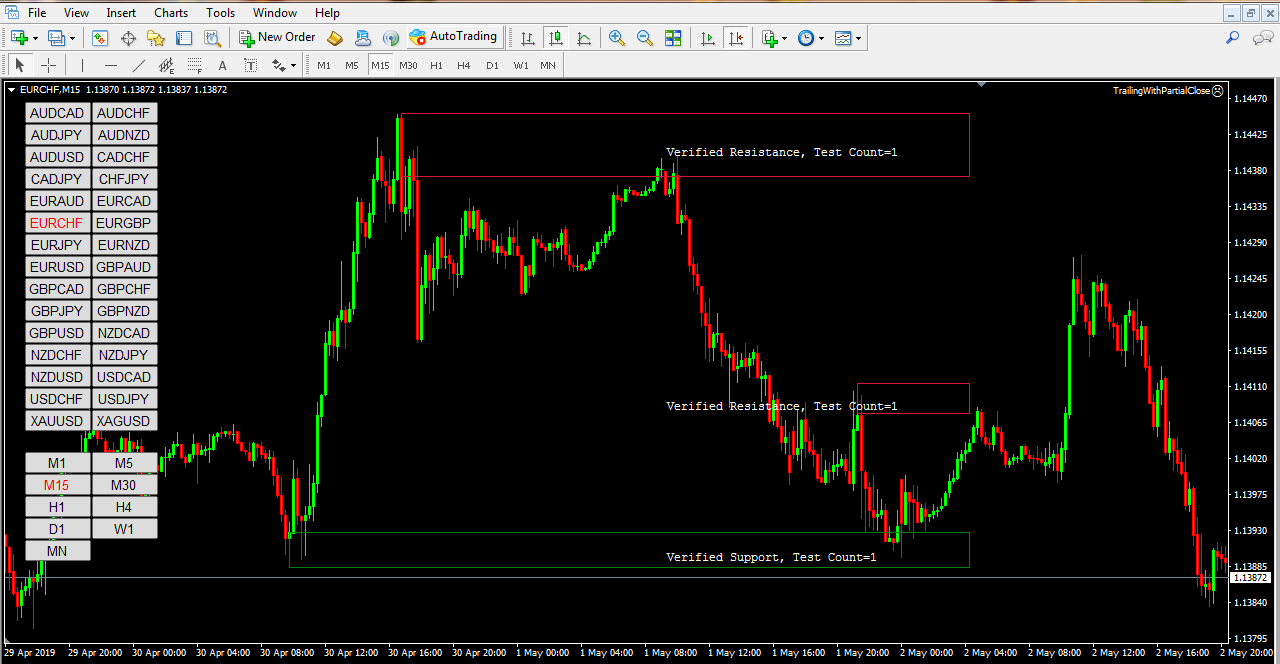
I am fulltime trader with over 13 years of forex experience. I developed my own strategy based on supply/demand levels and trend follow!
Motto: Take what you need and leave, don't look back!
Motto: Take what you need and leave, don't look back!