MTF Supply Demand Zones MT5
- インディケータ
- Georgios Kalomoiropoulos
- バージョン: 1.0
- アクティベーション: 20
次世代の自動化された需要と供給のゾーン。どのチャートでも機能する新しい革新的なアルゴリズム。すべてのゾーンは、市場の価格行動に従って動的に作成されています。
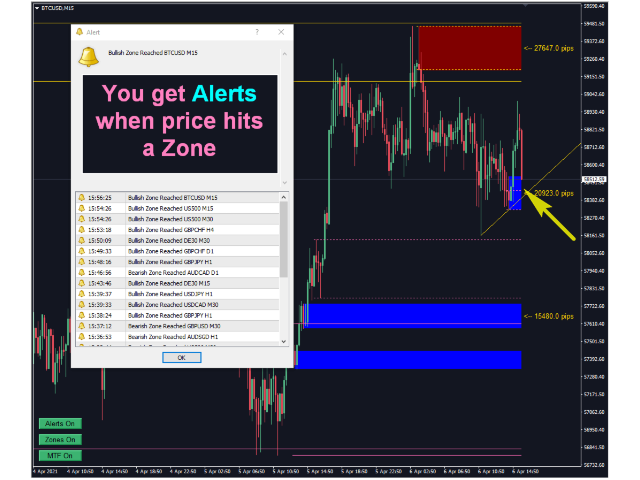
2種類のアラート --> 1) 価格がゾーンに達したとき 2) 新しいゾーンが形成されたとき
もう 1 つの役に立たない指標はありません。実績のある完全な取引戦略を手に入れることができます。
新機能:
価格が需給ゾーンに達したときにアラートを出す
新しい需給ゾーンが作成されたときにアラートを発します
プッシュ通知アラート
ピップ単位のゾーン幅ラベル
MTF のもう 1 つのタイムフレーム。したがって、現在より 2 時間足高いのではなく、現在より 3 時間足し上に見えるようになります。
アラート/ゾーン/MTF 機能を有効/無効にするボタン
あなたが得る利点:
取引から感情を取り除きます。
取引エントリをオブジェクト化します。
確率の高いセットアップで利益を上げましょう。
描画ゾーンから時間を節約します。
プロのように金融市場を取引します。
あらゆる市場の即時マルチタイムフレーム分析。
チャートに何が表示されますか?
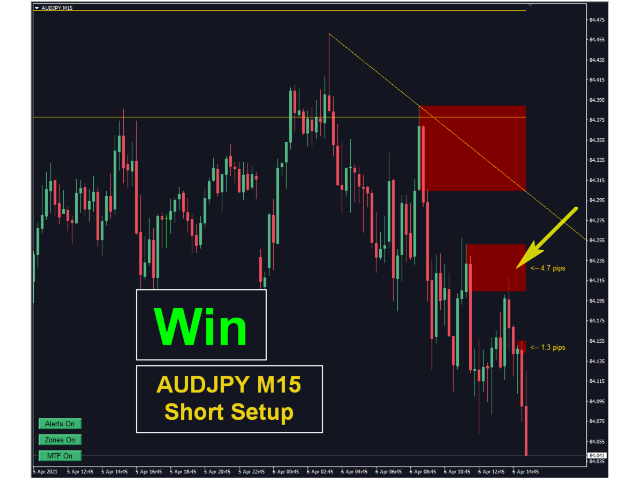
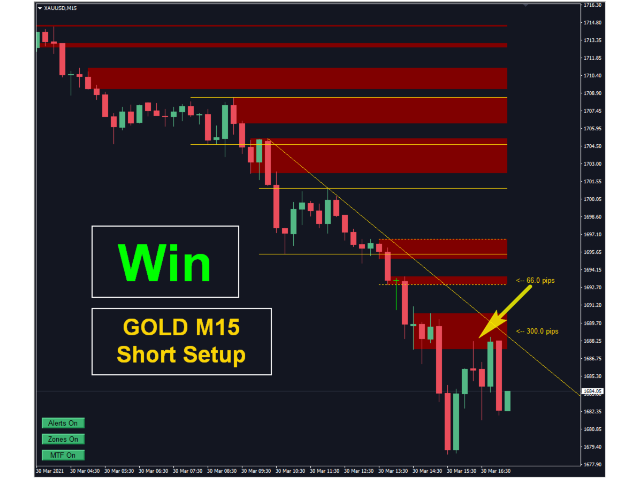
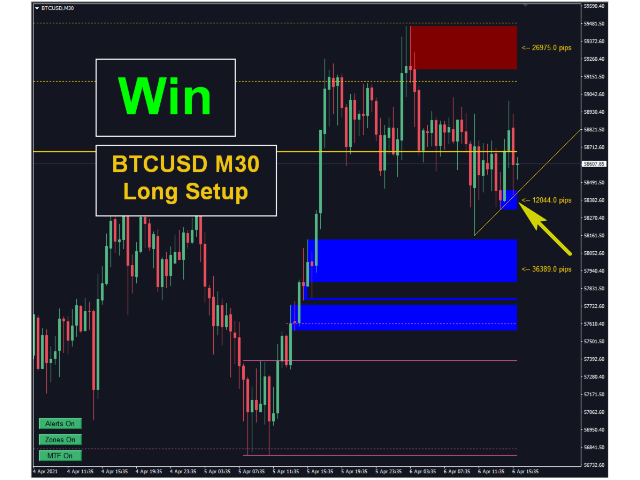
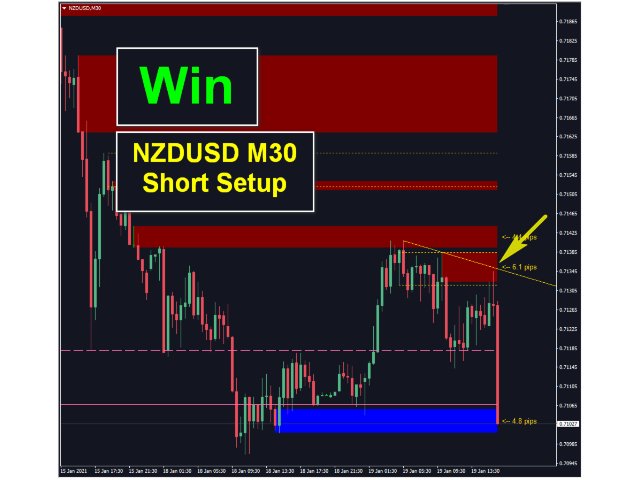
青と赤の四角形は、現在のタイムフレームの需要と供給のゾーンです。
点線のスタイルの線は、現在より上の最初の時間枠からの供給ゾーンと需要ゾーンです。
実線スタイルの線は、現在より上の 2 番目の時間枠からの供給ゾーンと需要ゾーンです。
また、Current より上の thirdTimeframe から需給ゾーンを表示する可能性もあります。
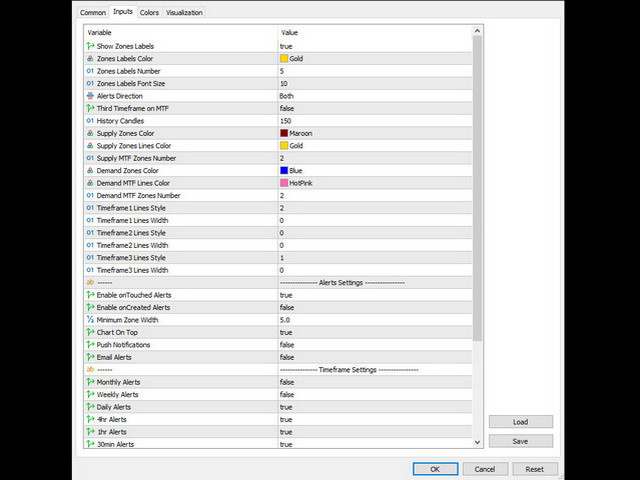
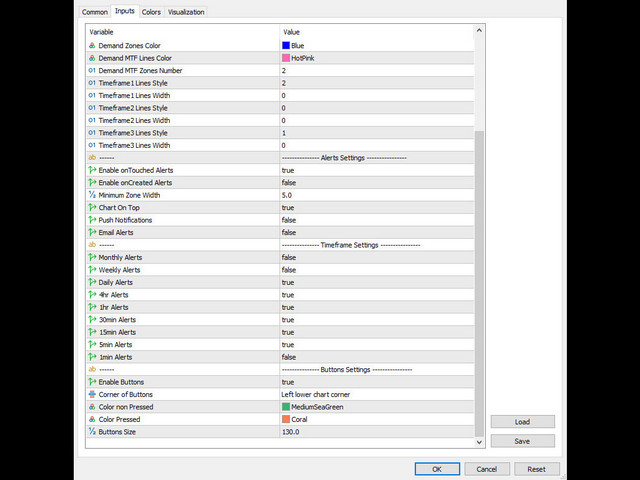
インジケーターの入力パラメーターから、長方形の色と線のスタイル/幅を変更できます。
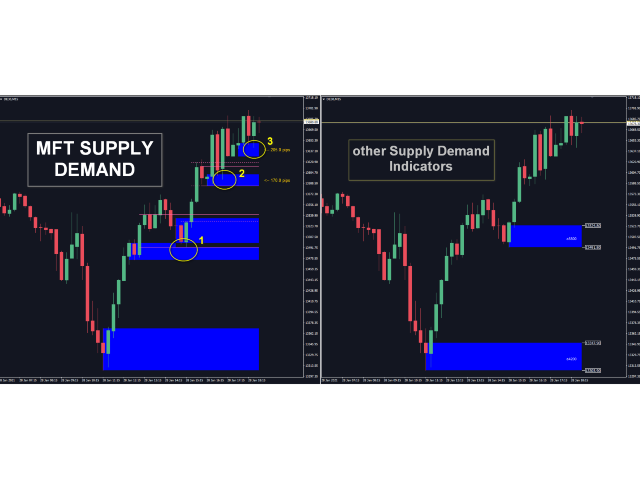
この指標は他の需給指標と同じですか?
いいえ、このインジケーターは、既存の無料インジケーターを単に強化したものではありません。
このインジケーターがゾーンを作成する方法は、市場の他のすべての需給インジケーターとは異なります。
まったく新しいツールです。以下の写真を確認できます。
他の需給指標との主な違い:
1. MTF Automated SD Zones インジケータはマルチタイムフレーム インジケータです。現在のチャートから、上の 2 つの時間枠のゾーンを確認できます。たとえば、現在のチャートが 1 時間の場合、4 時間と毎日の時間枠の需要/供給ゾーンを確認できます。
2. アルゴリズムは完全に新しく、ゼロから作成されました。他のインジケーターでは描かれていないゾーンも見ることができます。ゾーンはより正確になり、より良いエントリーポイントを見つけることができます。
3. すべてのゾーンは、市場の価格行動に従って動的に作成されています。つまり、市場のダイナミクスに応じてゾーンの幅が変化しています。
4. プロのトレーダーによって、取引を次のレベルに引き上げたい初心者および経験豊富なトレーダーによって設計されています。
このインジケーターを使用して取引を次のレベルに引き上げる方法についてさらに情報が必要な場合は、喜んでお手伝いします.
私のプロフィールから個人的なメッセージを送ることができます。
2種類のアラート --> 1) 価格がゾーンに達したとき 2) 新しいゾーンが形成されたとき
もう 1 つの役に立たない指標はありません。実績のある完全な取引戦略を手に入れることができます。
新機能:
価格が需給ゾーンに達したときにアラートを出す
新しい需給ゾーンが作成されたときにアラートを発します
プッシュ通知アラート
ピップ単位のゾーン幅ラベル
MTF のもう 1 つのタイムフレーム。したがって、現在より 2 時間足高いのではなく、現在より 3 時間足し上に見えるようになります。
アラート/ゾーン/MTF 機能を有効/無効にするボタン
あなたが得る利点:
取引から感情を取り除きます。
取引エントリをオブジェクト化します。
確率の高いセットアップで利益を上げましょう。
描画ゾーンから時間を節約します。
プロのように金融市場を取引します。
あらゆる市場の即時マルチタイムフレーム分析。
チャートに何が表示されますか?
青と赤の四角形は、現在のタイムフレームの需要と供給のゾーンです。
点線のスタイルの線は、現在より上の最初の時間枠からの供給ゾーンと需要ゾーンです。
実線スタイルの線は、現在より上の 2 番目の時間枠からの供給ゾーンと需要ゾーンです。
また、Current より上の thirdTimeframe から需給ゾーンを表示する可能性もあります。
インジケーターの入力パラメーターから、長方形の色と線のスタイル/幅を変更できます。
この指標は他の需給指標と同じですか?
いいえ、このインジケーターは、既存の無料インジケーターを単に強化したものではありません。
このインジケーターがゾーンを作成する方法は、市場の他のすべての需給インジケーターとは異なります。
まったく新しいツールです。以下の写真を確認できます。
他の需給指標との主な違い:
1. MTF Automated SD Zones インジケータはマルチタイムフレーム インジケータです。現在のチャートから、上の 2 つの時間枠のゾーンを確認できます。たとえば、現在のチャートが 1 時間の場合、4 時間と毎日の時間枠の需要/供給ゾーンを確認できます。
2. アルゴリズムは完全に新しく、ゼロから作成されました。他のインジケーターでは描かれていないゾーンも見ることができます。ゾーンはより正確になり、より良いエントリーポイントを見つけることができます。
3. すべてのゾーンは、市場の価格行動に従って動的に作成されています。つまり、市場のダイナミクスに応じてゾーンの幅が変化しています。
4. プロのトレーダーによって、取引を次のレベルに引き上げたい初心者および経験豊富なトレーダーによって設計されています。
このインジケーターを使用して取引を次のレベルに引き上げる方法についてさらに情報が必要な場合は、喜んでお手伝いします.
私のプロフィールから個人的なメッセージを送ることができます。