MTF Supply Demand Zones MT5
- Indicateurs
- Georgios Kalomoiropoulos
- Version: 2.5
- Mise à jour: 26 juillet 2024
- Activations: 20
Nouvelle génération de zones d'approvisionnement et de demande automatisées. Algorithme nouveau et innovant qui fonctionne sur n'importe quel graphique. Toutes les zones sont créées dynamiquement en fonction de l'action des prix du marché.
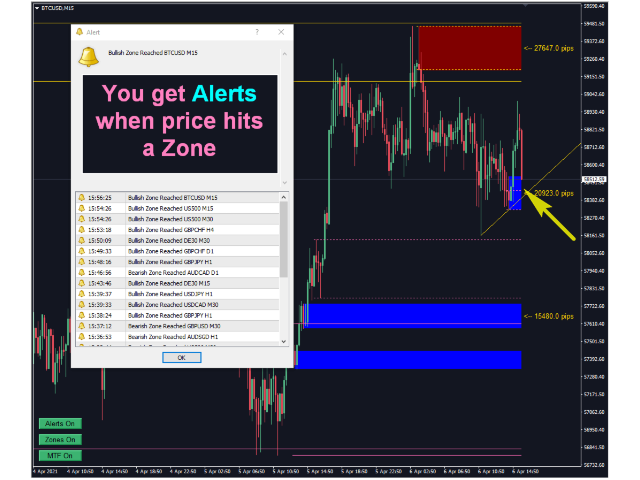
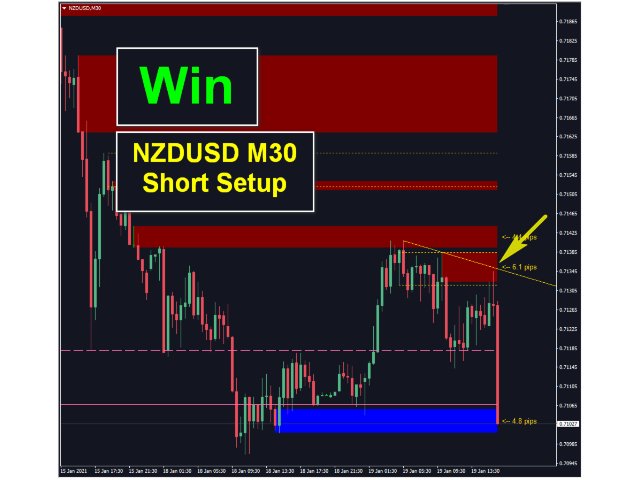
DEUX TYPES D'ALERTES --> 1) QUAND LE PRIX ATTEINT UNE ZONE 2) QUAND UNE NOUVELLE ZONE SE FORME
Vous n'obtenez pas un indicateur inutile de plus. Vous obtenez une stratégie de trading complète avec des résultats prouvés.
Nouvelles fonctionnalités:
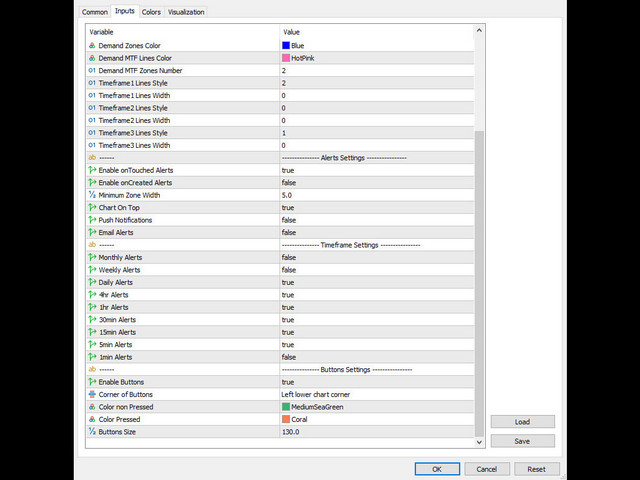
Alertes lorsque le prix atteint la zone d'offre/demande
Alertes lorsqu'une nouvelle zone d'approvisionnement/demande est créée
Alertes de notifications push
Étiquettes de largeur de zone en pips
Un délai de plus sur MTF. Alors maintenant, au lieu de 2 délais au-dessus du courant, vous pourrez voir 3 délais au-dessus du courant
Boutons pour activer/désactiver les fonctions Alertes/Zones/MTF
Avantages que vous obtenez :
Supprimez les émotions de votre trading.
Objectivez vos entrées de trading.
Augmentez vos bénéfices en prenant des configurations à haute probabilité.
Gagnez du temps sur les zones de dessin.
Tradez sur les marchés financiers comme un professionnel.
Analyse multi-période instantanée de n'importe quel marché.
Que voyez-vous sur le graphique ?
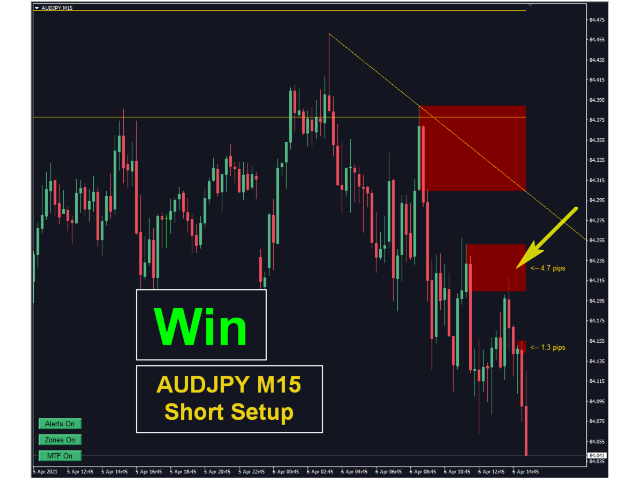
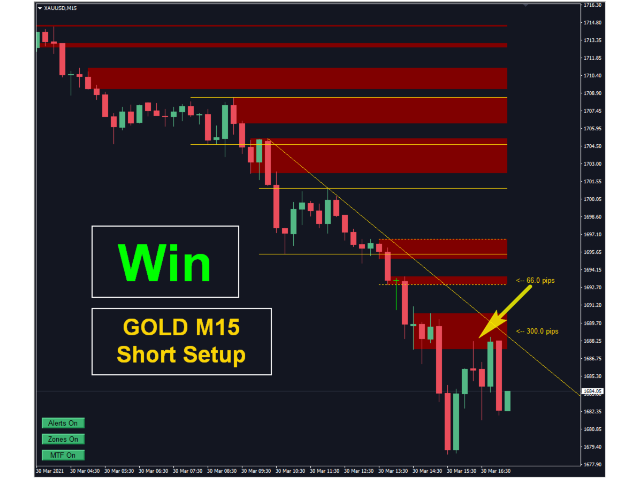
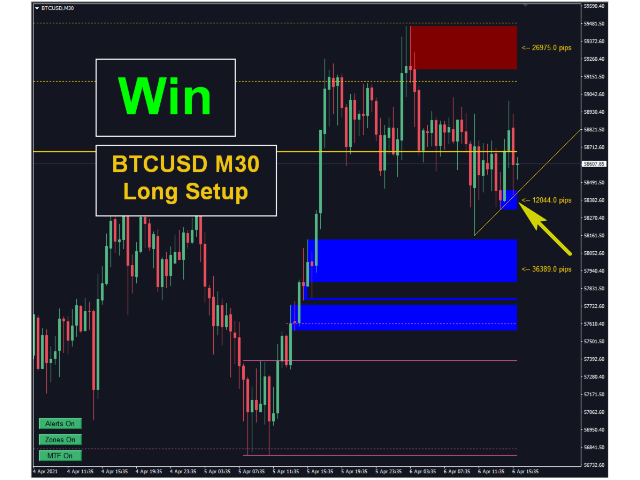
Les rectangles bleu et rouge sont la zone d'offre et de demande de la période actuelle.
Les lignes de style pointillé sont les zones d'offre et de demande de la première période au-dessus du courant.
Les lignes de style solide sont les zones d'offre et de demande de la deuxième période au-dessus du courant.
Vous avez également la possibilité de voir les zones d'offre et de demande à partir de la troisième période au-dessus du courant.
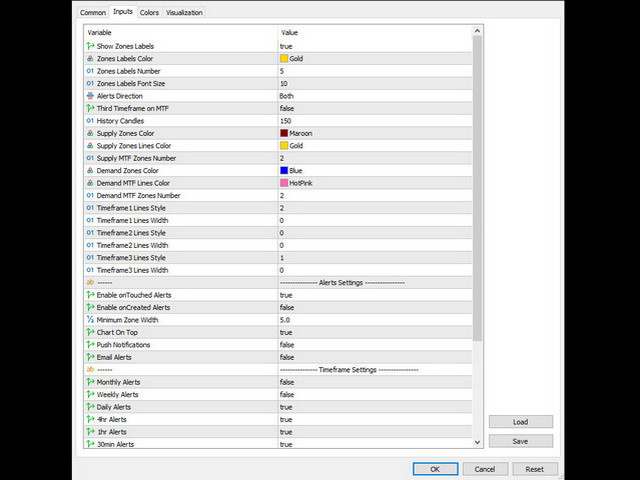
Vous pouvez modifier la couleur du rectangle et le style/largeur des lignes à partir des paramètres d'entrée de l'indicateur.
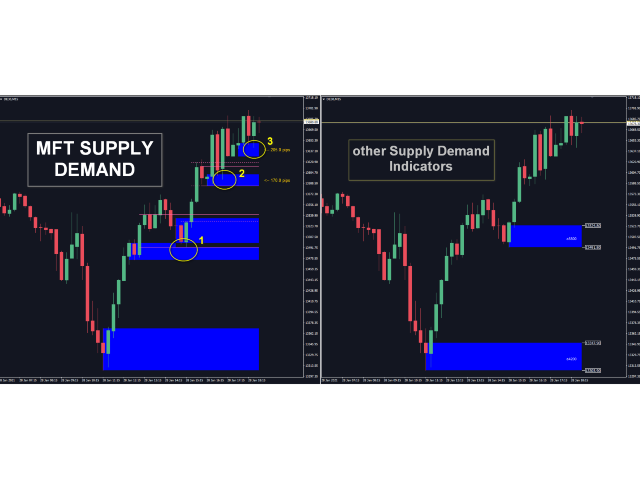
Cet indicateur est-il le même que les autres indicateurs de l'offre et de la demande ?
Non, cet indicateur n'est pas simplement une amélioration de l'indicateur gratuit préexistant.
La façon dont cet indicateur crée les zones est différente de tous les autres indicateurs d'offre et de demande du marché.
C'est un outil complètement nouveau. Vous pouvez vérifier les photos ci-dessous.
Principales différences par rapport aux autres indicateurs de l'offre et de la demande :
1. L'indicateur MTF Automated SD Zones est un indicateur multi-période. À partir du graphique actuel, vous pouvez voir les zones des deux périodes supérieures. Par exemple, si votre graphique actuel est de 1 heure, vous pouvez voir les zones Offre/Demande de 4 heures et les périodes quotidiennes.
2. L'algorithme est complètement nouveau et il a été créé à partir de zéro. Vous pouvez voir des zones qui ne sont même pas dessinées avec d'autres indicateurs. Les zones sont plus précises et vous pouvez trouver de meilleurs points d'entrée.
3. Toutes les zones sont créées dynamiquement en fonction de l'évolution des prix du marché. Cela signifie que les zones changent de largeur en fonction de la dynamique du marché.
4. Il est conçu par un trader professionnel pour les débutants et les traders expérimentés qui souhaitent faire passer leur trading au niveau supérieur.
Si vous avez besoin de plus d'informations sur la façon d'utiliser cet indicateur pour faire passer votre trading au niveau supérieur, je serais heureux de vous aider.
Vous pouvez m'envoyer un message personnel sur mon profil.
DEUX TYPES D'ALERTES --> 1) QUAND LE PRIX ATTEINT UNE ZONE 2) QUAND UNE NOUVELLE ZONE SE FORME
Vous n'obtenez pas un indicateur inutile de plus. Vous obtenez une stratégie de trading complète avec des résultats prouvés.
Nouvelles fonctionnalités:
Alertes lorsque le prix atteint la zone d'offre/demande
Alertes lorsqu'une nouvelle zone d'approvisionnement/demande est créée
Alertes de notifications push
Étiquettes de largeur de zone en pips
Un délai de plus sur MTF. Alors maintenant, au lieu de 2 délais au-dessus du courant, vous pourrez voir 3 délais au-dessus du courant
Boutons pour activer/désactiver les fonctions Alertes/Zones/MTF
Avantages que vous obtenez :
Supprimez les émotions de votre trading.
Objectivez vos entrées de trading.
Augmentez vos bénéfices en prenant des configurations à haute probabilité.
Gagnez du temps sur les zones de dessin.
Tradez sur les marchés financiers comme un professionnel.
Analyse multi-période instantanée de n'importe quel marché.
Que voyez-vous sur le graphique ?
Les rectangles bleu et rouge sont la zone d'offre et de demande de la période actuelle.
Les lignes de style pointillé sont les zones d'offre et de demande de la première période au-dessus du courant.
Les lignes de style solide sont les zones d'offre et de demande de la deuxième période au-dessus du courant.
Vous avez également la possibilité de voir les zones d'offre et de demande à partir de la troisième période au-dessus du courant.
Vous pouvez modifier la couleur du rectangle et le style/largeur des lignes à partir des paramètres d'entrée de l'indicateur.
Cet indicateur est-il le même que les autres indicateurs de l'offre et de la demande ?
Non, cet indicateur n'est pas simplement une amélioration de l'indicateur gratuit préexistant.
La façon dont cet indicateur crée les zones est différente de tous les autres indicateurs d'offre et de demande du marché.
C'est un outil complètement nouveau. Vous pouvez vérifier les photos ci-dessous.
Principales différences par rapport aux autres indicateurs de l'offre et de la demande :
1. L'indicateur MTF Automated SD Zones est un indicateur multi-période. À partir du graphique actuel, vous pouvez voir les zones des deux périodes supérieures. Par exemple, si votre graphique actuel est de 1 heure, vous pouvez voir les zones Offre/Demande de 4 heures et les périodes quotidiennes.
2. L'algorithme est complètement nouveau et il a été créé à partir de zéro. Vous pouvez voir des zones qui ne sont même pas dessinées avec d'autres indicateurs. Les zones sont plus précises et vous pouvez trouver de meilleurs points d'entrée.
3. Toutes les zones sont créées dynamiquement en fonction de l'évolution des prix du marché. Cela signifie que les zones changent de largeur en fonction de la dynamique du marché.
4. Il est conçu par un trader professionnel pour les débutants et les traders expérimentés qui souhaitent faire passer leur trading au niveau supérieur.
Si vous avez besoin de plus d'informations sur la façon d'utiliser cet indicateur pour faire passer votre trading au niveau supérieur, je serais heureux de vous aider.
Vous pouvez m'envoyer un message personnel sur mon profil.

This is an incredibly powerful, accurate, and insightful indicator. It functions without any issues on my laptop, and my very slow tablet. The alerts are always timely, and compared to other Supply and Demand indicators, this one draws zones that would otherwise be missed. Did I mention it's accurate? Price reacts to these zones, its crazy. I also emailed the author with some questions, and they wrote back within a very short amount of time. The support offered for this indicator is infinite. There is also a 71 page thread (that spans back for 4 years) on forexfactory with screenshots of its performance, as well as a video course for how to use this already intuitive indicator. Im really happy with this purchase, it is a MUST HAVE for every Supply and Demand trader. Many thanks to the author for his hard work, his ability and talent to teach, as well as his emotional support for his fellow traders and customers. Mentorship is offered as well (email him for details). There really isnt any more that could be asked for, this is the real deal. The description quality and completeness here on MQL5 discloses all of the functions. After closing and reopening my MT5 on both devices maybe 20+ times the indicator has not failed once, therefore I can confidently say its reliable. It's more than usable, its straight forward Supply and Demand zones without any frills or unnecessary confusing addons. Again, the support ive received, and the support ive seen others receive from the forum makes me want to get a "HPZ Trading" tattoo on my forehead, that's how awesome it is. What are you waiting for? Get this indicator today.