MTF Supply Demand Zones MT5
- 지표
- Georgios Kalomoiropoulos
- 버전: 1.0
- 활성화: 20
자동화된 수요 및 공급 구역의 차세대. 모든 차트에서 작동하는 새롭고 혁신적인 알고리즘. 모든 구역은 시장의 가격 움직임에 따라 동적으로 생성됩니다.
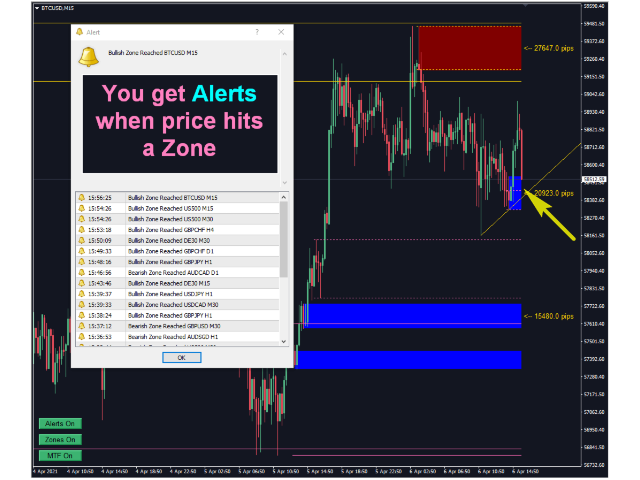
두 가지 유형의 경고 --> 1)가격이 영역에 도달할 때 2)새로운 영역이 형성될 때
당신은 더 이상 쓸모없는 지표를 얻을 수 없습니다. 입증된 결과로 완벽한 거래 전략을 얻을 수 있습니다.
새로운 기능:
가격이 공급/수요 영역에 도달하면 경고
새로운 공급/수요 구역이 생성되면 알림
푸시 알림 알림
핍의 영역 너비 레이블
기동특무부대에 한 번 더 시간이 주어집니다. 따라서 현재보다 위의 2개의 시간 프레임 대신 현재보다 높은 3개의 시간 프레임을 볼 수 있습니다.
Alerts/Zones/MTF 기능을 활성화/비활성화하는 버튼
당신이 얻는 이점:
거래에서 감정을 제거하십시오.
거래 항목을 객관화하십시오.
높은 확률 설정을 사용하여 수익을 높이십시오.
도면 영역에서 시간을 절약하십시오.
전문가처럼 금융 시장을 거래하십시오.
모든 시장에 대한 즉각적인 다중 시간 프레임 분석.
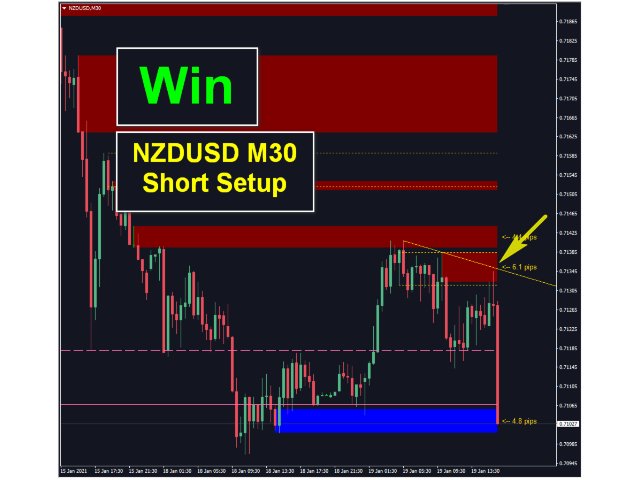
차트에서 무엇을 볼 수 있습니까?
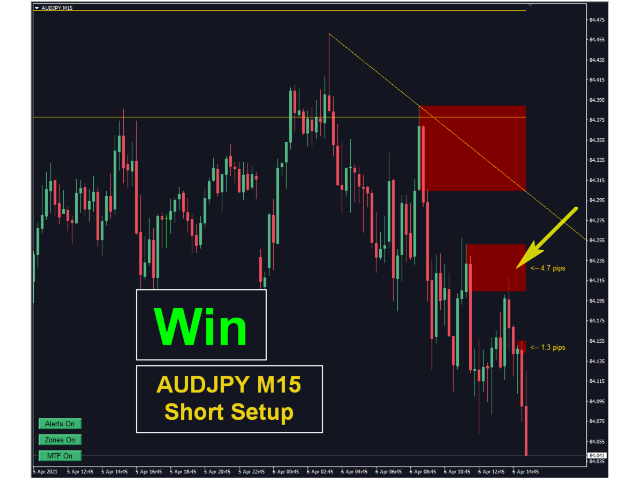
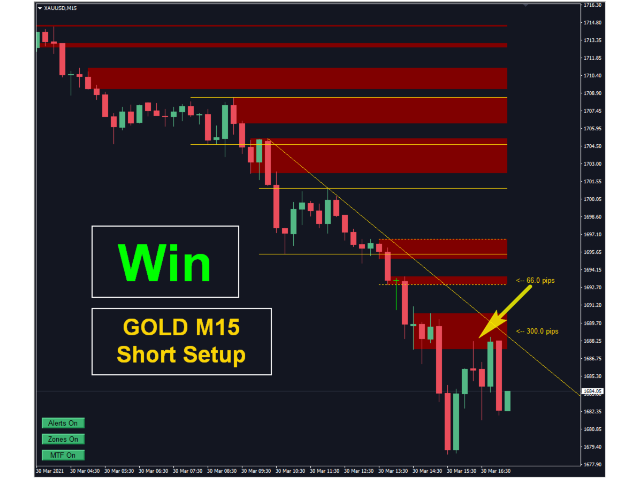
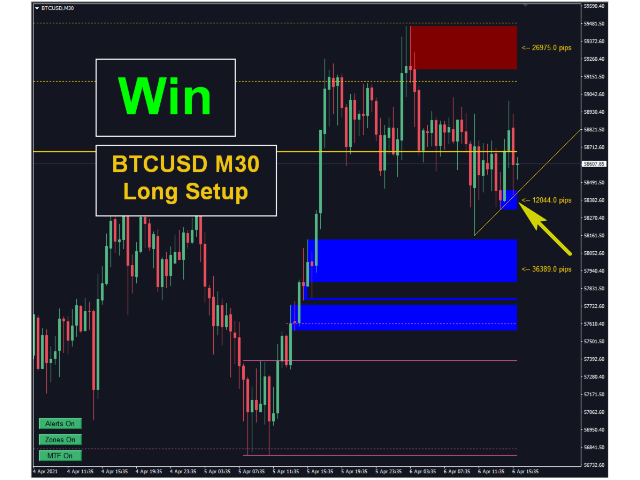
파란색과 빨간색 사각형은 현재 시간대의 수요와 공급 영역입니다.
점선은 현재 위의 첫 번째 시간대의 공급 및 수요 영역입니다.
솔리드 스타일 라인은 현재보다 두 번째 시간대의 공급 및 수요 영역입니다.
또한 현재 위의 thirdTimeframe에서 공급 및 수요 영역을 볼 수 있습니다.
표시기의 입력 매개변수에서 사각형의 색상과 선의 스타일/너비를 변경할 수 있습니다.
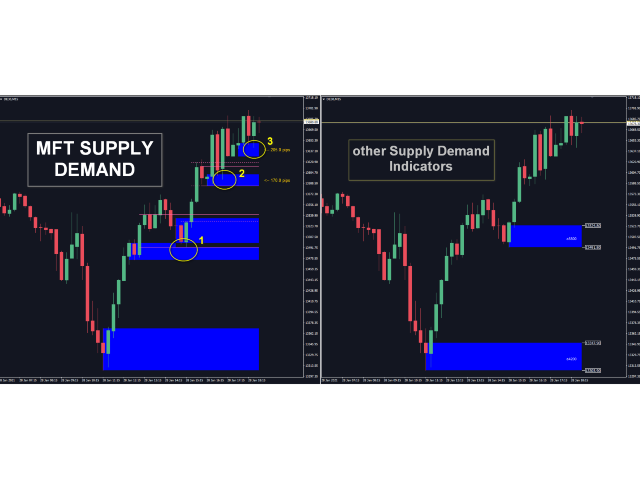
이 지표는 다른 공급 및 수요 지표와 동일합니까?
아니오, 이 지표는 기존의 무료 지표를 개선한 것이 아닙니다.
이 지표가 구역을 생성하는 방식은 시장의 다른 모든 공급 및 수요 지표와 다릅니다.
완전히 새로운 도구입니다. 아래 사진을 확인하실 수 있습니다.
다른 공급 및 수요 지표와의 주요 차이점:
1. MTF 자동 SD 영역 표시기는 다중 시간 프레임 표시기입니다. 현재 차트에서 상위 두 시간대의 영역을 볼 수 있습니다. 예를 들어 현재 차트가 1시간인 경우 4시간 및 일일 시간대의 공급/수요 영역을 볼 수 있습니다.
2. 알고리즘은 완전히 새롭고 처음부터 만들어졌습니다. 다른 지표로도 그려지지 않은 영역을 볼 수 있습니다. 영역이 더 정확하고 더 나은 진입점을 찾을 수 있습니다.
3. 모든 구역은 시장의 가격 움직임에 따라 동적으로 생성됩니다. 이는 구역이 시장 역학에 따라 너비를 변경하고 있음을 의미합니다.
4. 새로운 수준의 거래를 원하는 숙련된 거래자와 초보자를 위해 전문 거래자가 설계했습니다.
이 지표를 사용하여 거래를 한 단계 끌어올리는 방법에 대한 추가 정보가 필요한 경우 기꺼이 도와드리겠습니다.
내 프로필에 개인 메시지를 보낼 수 있습니다.
두 가지 유형의 경고 --> 1)가격이 영역에 도달할 때 2)새로운 영역이 형성될 때
당신은 더 이상 쓸모없는 지표를 얻을 수 없습니다. 입증된 결과로 완벽한 거래 전략을 얻을 수 있습니다.
새로운 기능:
가격이 공급/수요 영역에 도달하면 경고
새로운 공급/수요 구역이 생성되면 알림
푸시 알림 알림
핍의 영역 너비 레이블
기동특무부대에 한 번 더 시간이 주어집니다. 따라서 현재보다 위의 2개의 시간 프레임 대신 현재보다 높은 3개의 시간 프레임을 볼 수 있습니다.
Alerts/Zones/MTF 기능을 활성화/비활성화하는 버튼
당신이 얻는 이점:
거래에서 감정을 제거하십시오.
거래 항목을 객관화하십시오.
높은 확률 설정을 사용하여 수익을 높이십시오.
도면 영역에서 시간을 절약하십시오.
전문가처럼 금융 시장을 거래하십시오.
모든 시장에 대한 즉각적인 다중 시간 프레임 분석.
차트에서 무엇을 볼 수 있습니까?
파란색과 빨간색 사각형은 현재 시간대의 수요와 공급 영역입니다.
점선은 현재 위의 첫 번째 시간대의 공급 및 수요 영역입니다.
솔리드 스타일 라인은 현재보다 두 번째 시간대의 공급 및 수요 영역입니다.
또한 현재 위의 thirdTimeframe에서 공급 및 수요 영역을 볼 수 있습니다.
표시기의 입력 매개변수에서 사각형의 색상과 선의 스타일/너비를 변경할 수 있습니다.
이 지표는 다른 공급 및 수요 지표와 동일합니까?
아니오, 이 지표는 기존의 무료 지표를 개선한 것이 아닙니다.
이 지표가 구역을 생성하는 방식은 시장의 다른 모든 공급 및 수요 지표와 다릅니다.
완전히 새로운 도구입니다. 아래 사진을 확인하실 수 있습니다.
다른 공급 및 수요 지표와의 주요 차이점:
1. MTF 자동 SD 영역 표시기는 다중 시간 프레임 표시기입니다. 현재 차트에서 상위 두 시간대의 영역을 볼 수 있습니다. 예를 들어 현재 차트가 1시간인 경우 4시간 및 일일 시간대의 공급/수요 영역을 볼 수 있습니다.
2. 알고리즘은 완전히 새롭고 처음부터 만들어졌습니다. 다른 지표로도 그려지지 않은 영역을 볼 수 있습니다. 영역이 더 정확하고 더 나은 진입점을 찾을 수 있습니다.
3. 모든 구역은 시장의 가격 움직임에 따라 동적으로 생성됩니다. 이는 구역이 시장 역학에 따라 너비를 변경하고 있음을 의미합니다.
4. 새로운 수준의 거래를 원하는 숙련된 거래자와 초보자를 위해 전문 거래자가 설계했습니다.
이 지표를 사용하여 거래를 한 단계 끌어올리는 방법에 대한 추가 정보가 필요한 경우 기꺼이 도와드리겠습니다.
내 프로필에 개인 메시지를 보낼 수 있습니다.