Candles Indicator for MT5
- インディケータ
- Mikhail Gudyrin
- バージョン: 1.1
- アクティベーション: 5
A machine translation from English product description was used. We apologies for possible imprecisions.
英語の製品説明からの機械翻訳が使用されました。 不正確な可能性があることをお詫び申し上げます。
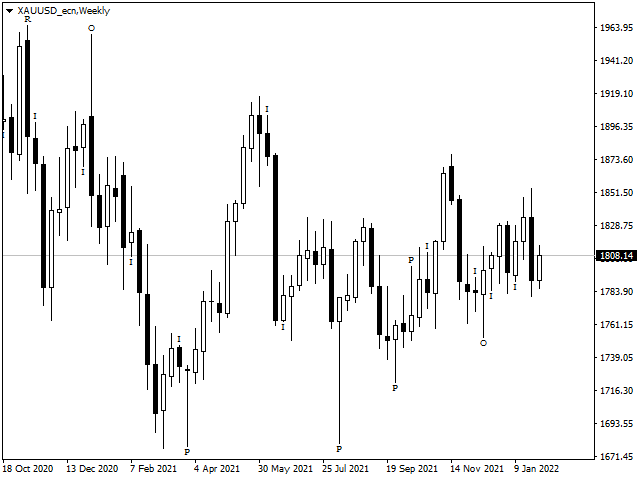
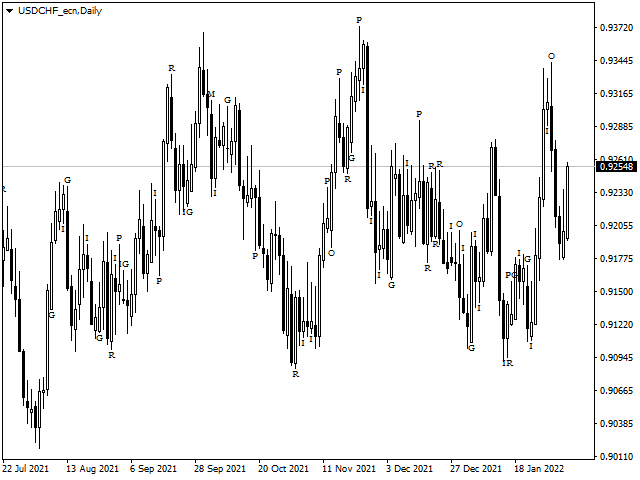
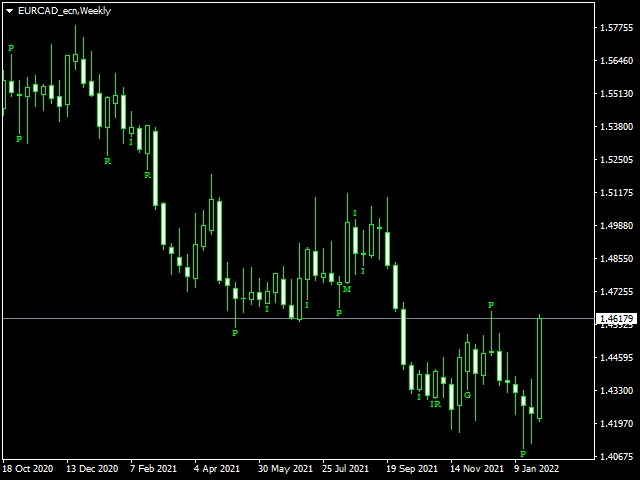
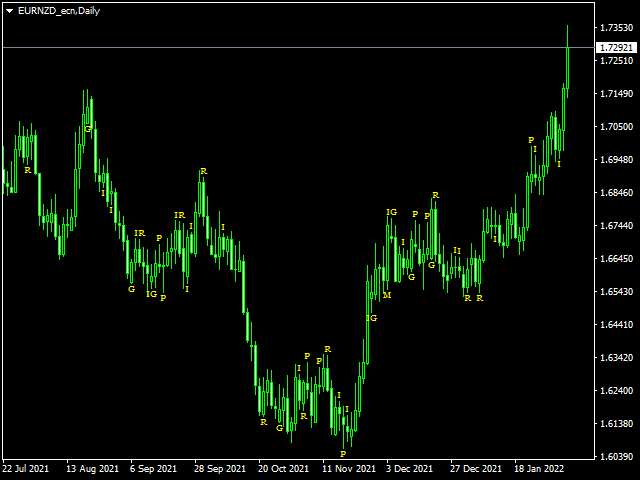
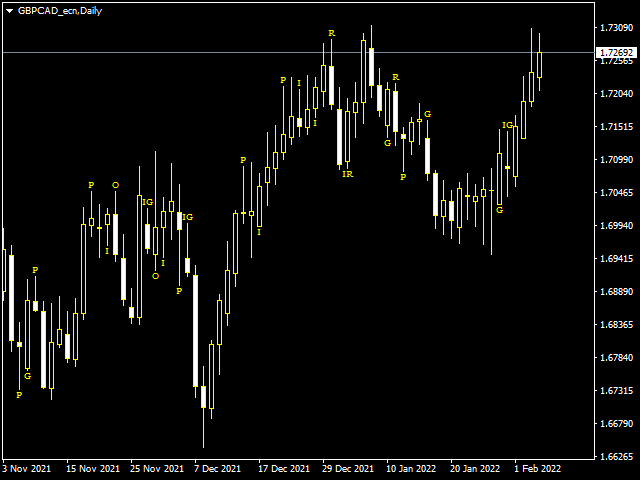
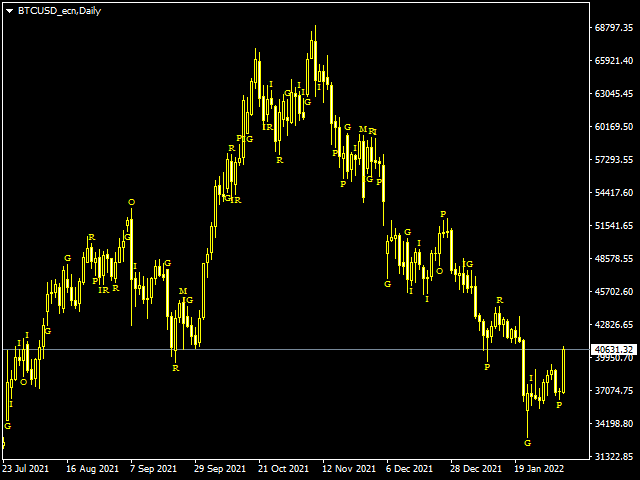
お気に入りのろうそく足の価格アクションパターンの視覚化システム。
アタッチされると、インジケーターはチャート上の次のパターンを自動的にマークします。
- ピノキオバー-長い「鼻」を持つ小さなボディのバー、非常によく知られている逆のパターン。
- 内側のバー-範囲が前のバーの範囲内にあるバー。 それは市場の不確実性を表しています。
- 外側のバー-範囲が前のバーの範囲を超えるバー。 それは市場の不確実性を表しています。
- レールパターン-ほぼ等しく、より大きなボディを持つ2つの結果として生じる反対側のバー。 逆のパターン。これは、より高い時間枠のピノキオバーパターンと実際に一致します。
- マスターキャンドルパターン-キャンドルの5つ、後続の4つのキャンドルの範囲は5番目の範囲内にあります-マスターキャンドル。 このパターンは、特により短い時間枠での市場の統合を表しています。
- ギャップ-結果として生じるバーの終値と始値の間のギャップ。これは見落とされるべきではありません。
この指標は、高性能要件を念頭に置いて開発されました。