Candles Indicator for MT5
- Göstergeler
- Mikhail Gudyrin
- Sürüm: 1.1
- Etkinleştirmeler: 5
A machine translation from the English product description was used. We apologize for possible imprecisions.
İngilizce ürün açıklamasından bir makine çevirisi kullanıldı. Olası yanlışlıklar için özür dileriz.
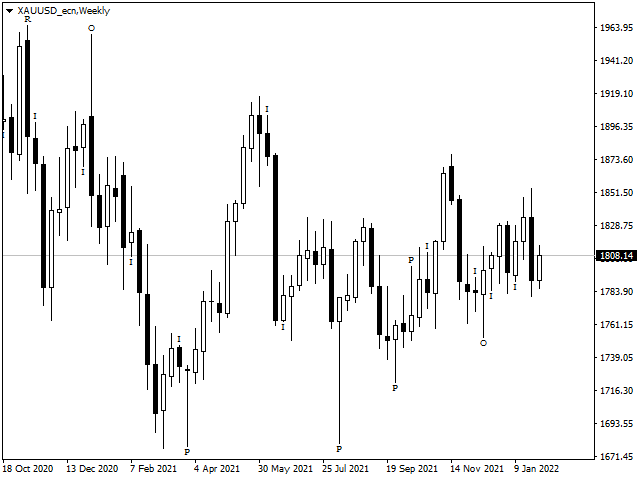
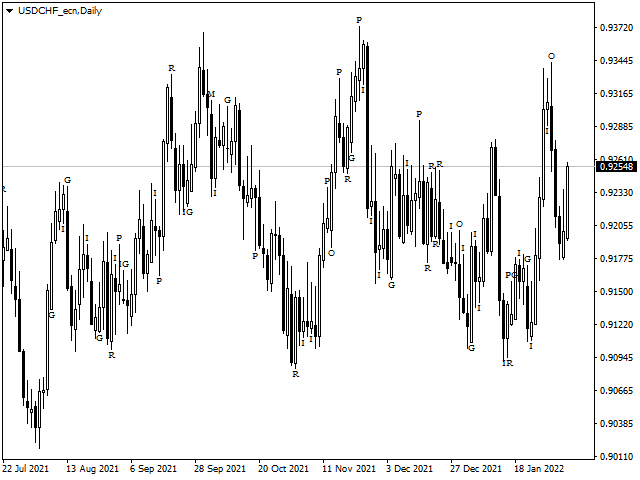
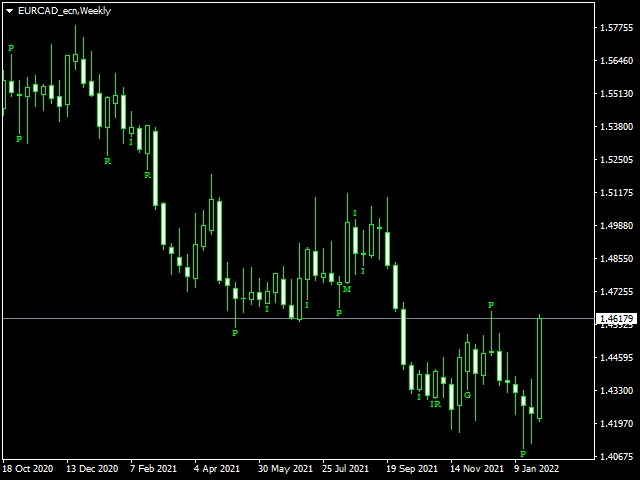
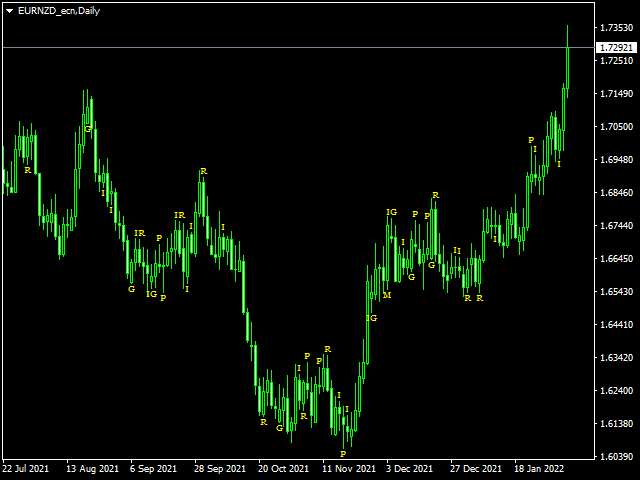
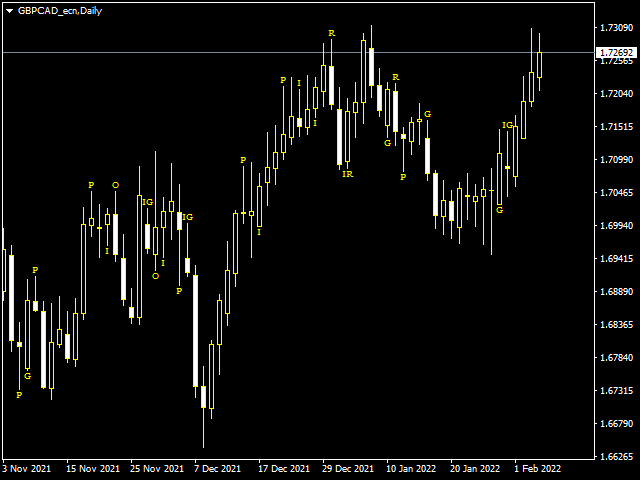
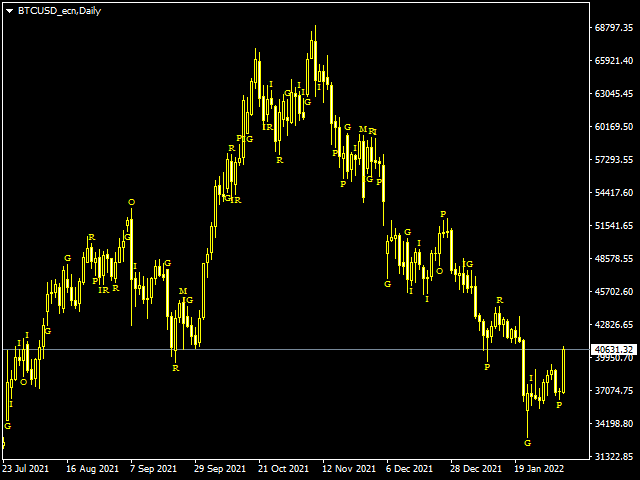
Favori şamdan fiyat hareket kalıpları için bir görselleştirme sistemi.
Eklendikten sonra, gösterge tablodaki sonraki kalıpları otomatik olarak işaretleyecektir:
- Pinokyo çubuğu - çok iyi bilinen ters desenli uzun bir 'burnu' olan küçük gövdeli bir çubuk;
- İç çubuk - aralığı önceki çubuğun aralığı içinde kalan bir çubuk. Piyasa belirsizliğini temsil eder;
- Dış çubuk - aralığı önceki çubuğun aralığını aşan bir çubuk. Piyasa belirsizliğini temsil eder;
- Ray modeli - hemen hemen eşit, daha büyük gövdeli birbirini izleyen iki zıt çubuk. Aslında daha yüksek bir zaman diliminden bir Pinokyo çubuğu modeliyle çakışan ters bir model;
- Ana mum kalıbı - mumların beşlisi, sonraki dört mumun aralıkları beşinci - Ana mum aralığındadır. Bu model, özellikle daha kısa bir zaman diliminde piyasa konsolidasyonunu temsil eder.
- Boşluk - ardışık çubukların yakın ve açık fiyatları arasındaki, göz ardı edilmemesi gereken bir boşluk.
Bu gösterge, yüksek performans gereksinimleri göz önünde bulundurularak geliştirilmiştir.