Candles Indicator for MT5
- Indikatoren
- Mikhail Gudyrin
- Version: 1.1
- Aktivierungen: 5
A machine translation from English product description was used. We apologies for possible imprecisions.
Es wurde eine maschinelle Übersetzung der englischen Produktbeschreibung verwendet. Eventuelle Ungenauigkeiten bitten wir zu entschuldigen.
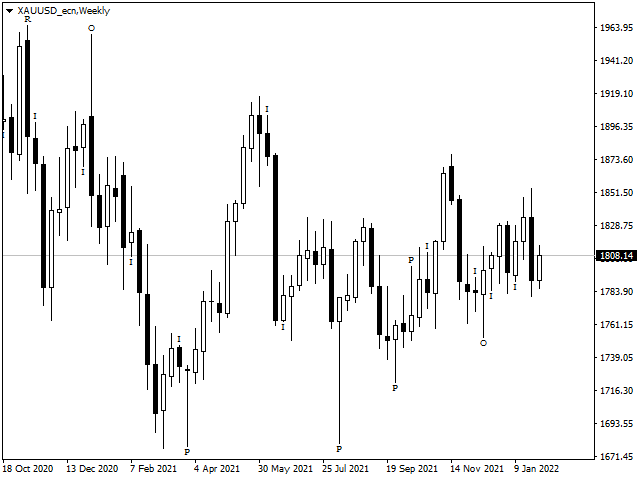
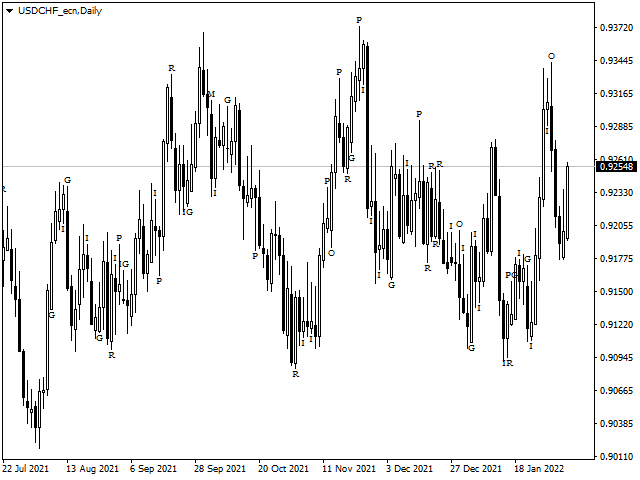
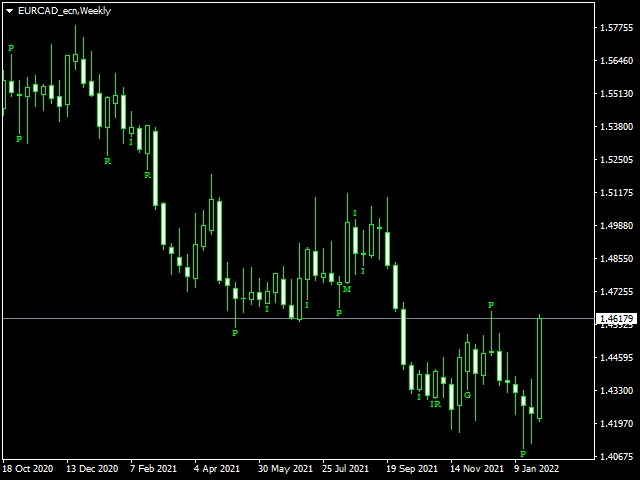
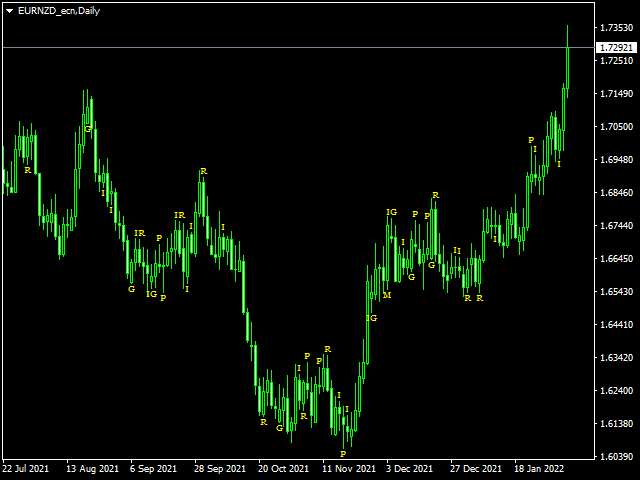
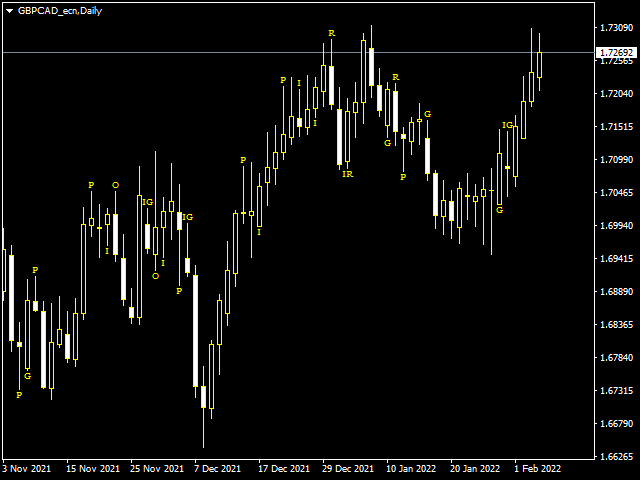
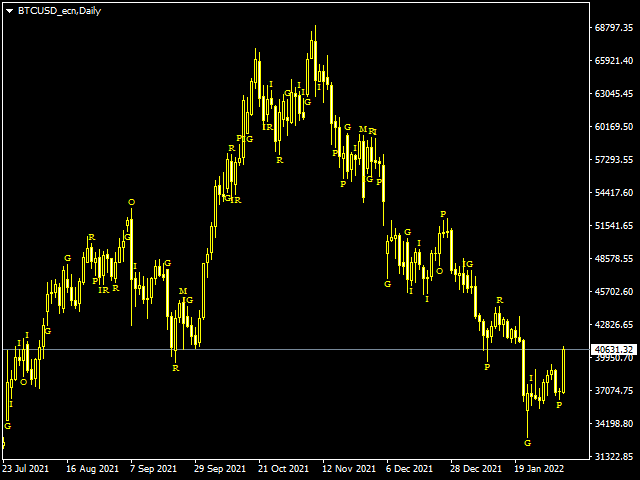
Ein Visualisierungssystem für beliebte Candlestick-Preisaktionsmuster.
Nach dem Anbringen markiert der Indikator automatisch die nächsten Muster auf dem Diagramm:
- Pinocchio Bar– ein kleiner Körperriegel mit einer langen „Nase“, einem sehr bekannten umgekehrten Muster;
- Inside Bar – eine Bar, deren Range innerhalb der Range der vorherigen Bar liegt. Es repräsentiert Marktunsicherheit;
- Outside Bar – eine Bar, deren Range die Range der vorherigen Bar übersteigt. Es repräsentiert Marktunsicherheit;
- Schienenmuster - zwei konsequente entgegengesetzte Stäbe mit fast gleichen, größeren Körpern. Ein umgekehrtes Muster, das tatsächlich mit einem Pinocchio-Balkenmuster aus einem höheren Zeitrahmen zusammenfällt;
- Master-Kerzenmuster – der Fünfer der Kerzen, bei dem vier aufeinanderfolgende Kerzen ihre Bereiche innerhalb des Bereichs der fünften haben – Master-Kerze. Dieses Muster stellt eine Marktkonsolidierung dar, insbesondere in einem kürzeren Zeitrahmen.
- Gap – eine Lücke zwischen Schluss- und Eröffnungspreisen von nachfolgenden Balken, die nicht übersehen werden sollte.
Dieser Indikator wurde im Hinblick auf hohe Leistungsanforderungen entwickelt.