Box Weis Wave
- インディケータ
- Thalles Nascimento De Carvalho
- バージョン: 2.0
- アクティベーション: 5
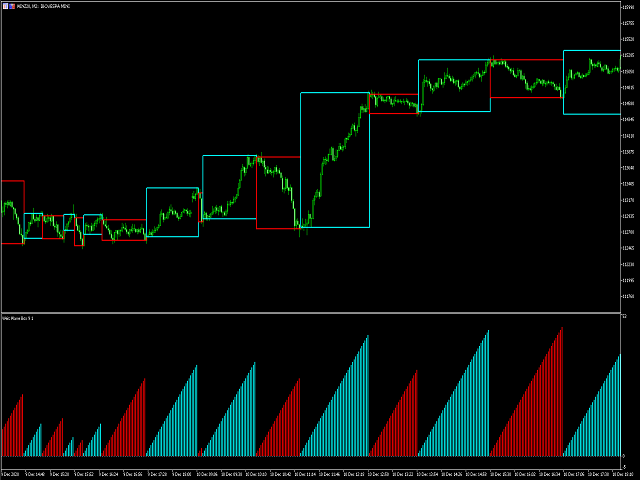
もしアクティブなトレーダーであり、市場の動きを効果的に解釈する方法を探しているなら、Weis Wave Boxを知ることはきっとお好きになるでしょう。この素晴らしいインジケーターは、明瞭で正確なボリュームの波とそれに対応するスウィングポイントのプロットを提供するために設計されています。5つのカスタマイズ可能なスウィング形状と他のユニークな機能を備えたWeis Wave Boxは、経験豊富なトレーダーや初心者にとって欠かせないツールとして際立っています。
Weis Wave Boxの注目すべき特徴の1つは、カスタムティックにおけるボリュームの波を作成できる能力です。これにより、取引の好みに合わせて適応し、戦略に精度と関連性をもたらすことができます。さらに、このインジケーターには調整可能な履歴制限があり、目的の時間帯に焦点を当てて特定のトレンドを分析することができます。
Weis Wave Boxの大きな利点の1つは、ティックボリュームと実際のボリュームに関する情報を提供できる点です。これら2つのボリュームの違いを理解することは、正確な市場分析にとって重要です。このインジケーターは、その情報を明確かつ直接的に表示するため、情報に基づいた戦略的な意思決定が可能です。
Weis Wave Boxのもう1つのハイライトは、スウィング形状の柔軟性です。totalVol、length、width、barDVol、lengthDVolなど5つの異なるオプションを含め、好みや特定の目標に合わせて分析をカスタマイズすることができます。この柔軟性は、他のテクニカル分析ツールとの重要な違いとなっています。
Weis Wave Boxを手に入れて、金融市場で一歩先を進んでください。使いやすいインターフェースと強力な機能を備えたこのインジケーターは、トレンドや転換ポイント、収益性のある取引機会を特定するのに役立ちます。戦略を向上させ、結果を新たなレベルに引き上げるチャンスを活かしてください。
* スウィングポイントボリュームインジケーターは、以下のリンクから購入できます:
https://www.mql5.com/ja/market/product/59094
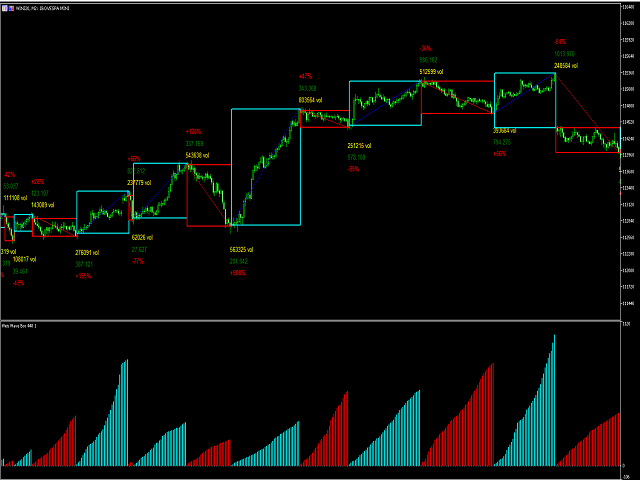


A Very good product.The Box format is very nice.The developer has said there are 5 options to print text near the boxes.The description pictures also show the Wave Distance printed next to the Boxes.However,I am not able to see any text printed near the boxes and I have tried all the options.Maybe something was missed in the update.I have sent a note to the developer and I am hoping that he would fix it soon to restore the full functionality as described.