Box Weis Wave
- 지표
- Thalles Nascimento De Carvalho
- 버전: 2.0
- 활성화: 5
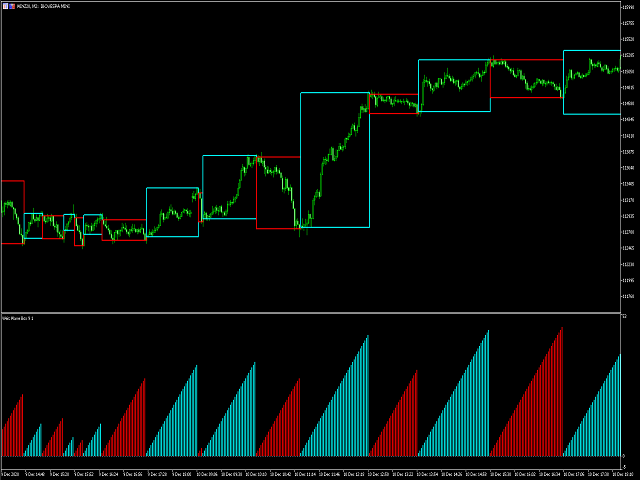
활발한 트레이더이며 금융 시장의 움직임을 효과적으로 해석하고자 한다면, Weis Wave Box에 대해 알아보시면 좋을 것입니다. 이 놀라운 인디케이터는 볼륨 웨이브와 해당 스윙 포인트의 시각적인 분석을 명확하고 정확하게 제공하기 위해 설계되었습니다. 5가지 사용자 정의 가능한 스윙 형태와 기타 독특한 기능을 갖춘 Weis Wave Box는 숙련된 트레이더와 초보자 모두에게 꼭 필요한 도구로 주목받고 있습니다.
Weis Wave Box의 주목할 만한 기능 중 하나는 사용자 정의 틱 간격에서 볼륨 웨이브를 생성할 수 있는 능력입니다. 이를 통해 거래 선호도에 맞게 적응하고 전략에 정확하고 관련성 있는 결과를 얻을 수 있습니다. 또한, 이 인디케이터는 조정 가능한 히스토리 제한을 갖고 있어 원하는 시간 범위에 초점을 맞추고 특정한 추세를 분석할 수 있습니다.
Weis Wave Box의 큰 장점 중 하나는 틱 볼륨과 실제 볼륨에 대한 정보를 제공할 수 있는 능력입니다. 이 두 가지 유형의 볼륨의 차이를 이해하는 것은 정확한 시장 분석에 중요합니다. 이 인디케이터는 이러한 정보를 명확하고 간단하게 제공하여 정보에 근거한 전략적인 결정을 할 수 있도록 도와줍니다.
Weis Wave Box의 다른 강점은 스윙 형태에 대한 유연성입니다. totalVol, length, width, barDVol 및 lengthDVol을 포함한 다섯 가지 다른 옵션을 제공하여 선호도와 특정 목표에 맞게 분석을 맞춤 설정할 수 있습니다. 이러한 유연성은 다른 기술적 분석 도구와는 크게 차별되는 특징입니다.
지금 Weis Wave Box를 구매하고 금융 시장에서 한 발 앞서 나아가 보세요. 사용자 친화적인 인터페이스와 강력한 기능으로 이 인디케이터는 트렌드, 반전 포인트 및 수익성 있는 거래 기회를 식별하는 데 도움을 줄 것입니다. 전략을 향상시키고 결과를 새로운 수준으로 끌어올리는 기회를 살펴보세요.
* Swing Point Volume 인디케이터는 다음 링크에서 구매할 수 있습니다:
https://www.mql5.com/ko/market/product/59094
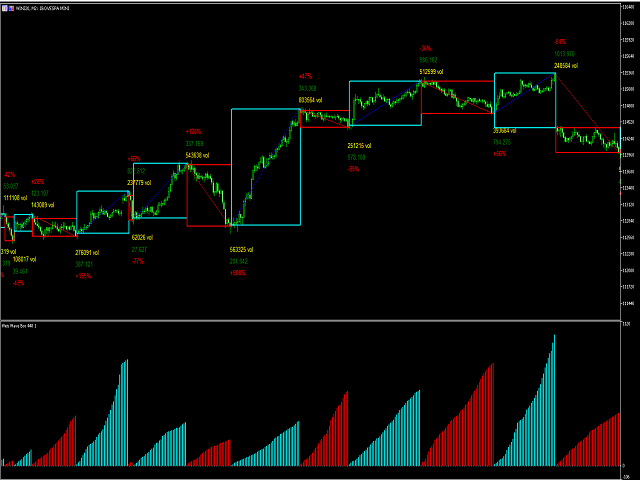


A Very good product.The Box format is very nice.The developer has said there are 5 options to print text near the boxes.The description pictures also show the Wave Distance printed next to the Boxes.However,I am not able to see any text printed near the boxes and I have tried all the options.Maybe something was missed in the update.I have sent a note to the developer and I am hoping that he would fix it soon to restore the full functionality as described.