Box Weis Wave
- Indicateurs
- Thalles Nascimento De Carvalho
- Version: 2.0
- Activations: 5
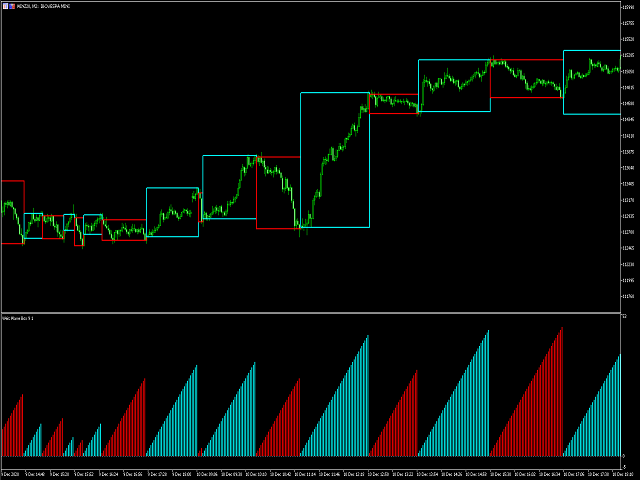
Si vous êtes un trader actif et que vous recherchez un moyen efficace d'interpréter les mouvements sur les marchés financiers, vous allez adorer découvrir Weis Wave Box. Cet incroyable indicateur a été conçu pour offrir une analyse visuelle claire et précise des vagues de volume, ainsi que la représentation des points de retournement correspondants. Avec ses cinq formes de retournement personnalisables et autres fonctionnalités uniques, Weis Wave Box se distingue comme un outil indispensable pour les traders expérimentés et les novices.
Une caractéristique notable de Weis Wave Box est sa capacité à créer des vagues de volume sur des intervalles personnalisés. Cela vous permet de vous adapter à vos préférences de trading et d'obtenir des résultats précis et pertinents pour vos stratégies. De plus, l'indicateur dispose d'une limite d'historique réglable, vous permettant de vous concentrer sur les périodes de temps souhaitées et d'analyser des tendances spécifiques.
Un des grands avantages de Weis Wave Box est sa capacité à fournir des informations sur le volume en ticks et le volume réel. Comprendre la différence entre ces deux types de volume est essentiel pour une analyse précise du marché. L'indicateur présente ces informations de manière claire et directe, vous permettant de prendre des décisions éclairées et stratégiques.
Un autre point fort de Weis Wave Box est sa flexibilité en ce qui concerne les formes de retournement. Avec cinq options différentes, incluant totalVol, length, width, barDVol et lengthDVol, vous pouvez personnaliser votre analyse en fonction de vos préférences et objectifs spécifiques. Cette polyvalence est un différenciateur significatif de Weis Wave Box par rapport à d'autres outils d'analyse technique.
Procurez-vous dès maintenant Weis Wave Box et faites un pas en avant sur les marchés financiers. Avec son interface conviviale et ses fonctionnalités puissantes, cet indicateur vous aidera à identifier les tendances, les points de retournement et les opportunités de trading rentables. Profitez de cette opportunité pour améliorer vos stratégies et élever vos résultats à un nouveau niveau.
* Vous pouvez acheter l'indicateur Swing Point Volume via le lien suivant :
https://www.mql5.com/fr/market/product/59094
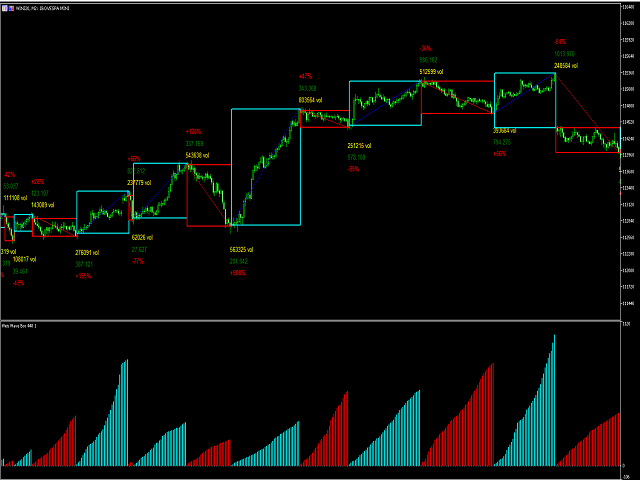


A Very good product.The Box format is very nice.The developer has said there are 5 options to print text near the boxes.The description pictures also show the Wave Distance printed next to the Boxes.However,I am not able to see any text printed near the boxes and I have tried all the options.Maybe something was missed in the update.I have sent a note to the developer and I am hoping that he would fix it soon to restore the full functionality as described.