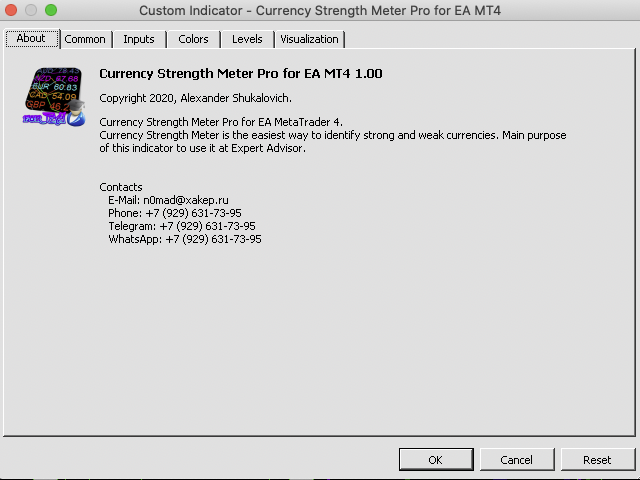
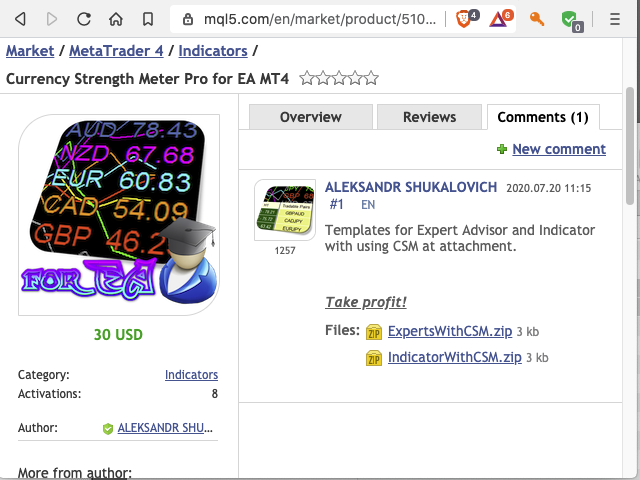
Currency Strength Meter Pro for EA MT4
- インディケータ
- ALEKSANDR SHUKALOVICH
- バージョン: 4.0
- アップデート済み: 18 12月 2023
- アクティベーション: 8
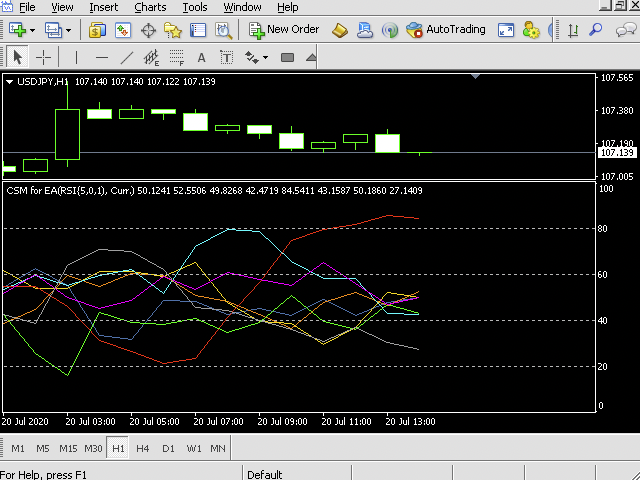
Currency Strength Meter is the easiest way to identify strong and weak currencies. The indicator shows the relative strength of 8 major currencies: AUD, CAD, CHF, EUR, GBP, JPY, NZD, USD.
By default the strength value is normalised to the range from 0 to 100 for RSI algorithm:
- The value above 60 means strong currency;
- The value below 40 means weak currency;
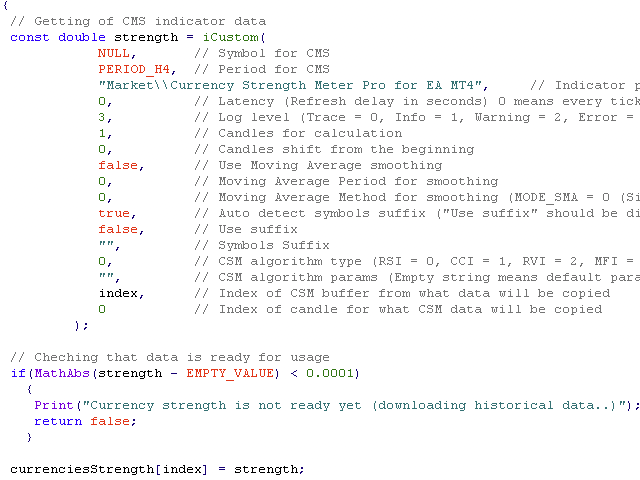
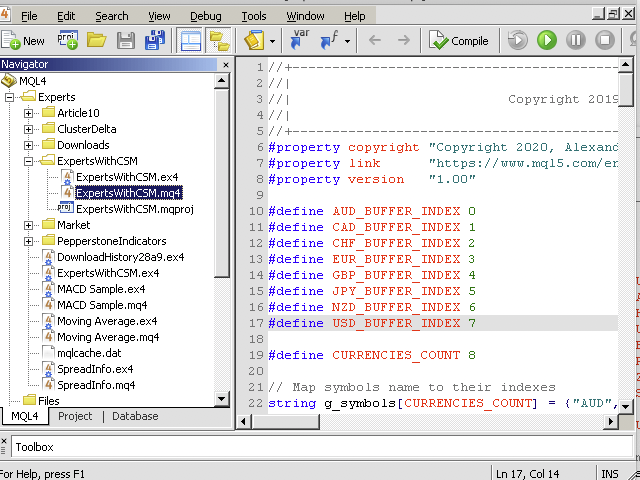
The indicator is created and optimized for using it externally at an Expert Advisors or as a Custom Indicator inside your programs.
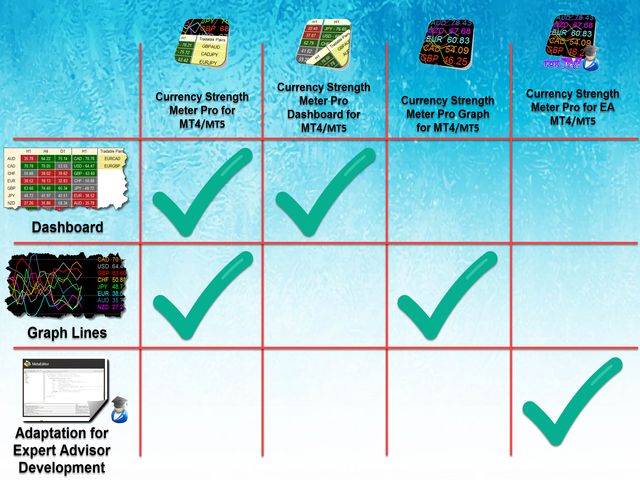
For direct usage as an indicator there are several special versions for it:
- Currency Strength Meter Pro for MT4
- Currency Strength Meter Pro Dashboard for MT4
- Currency Strength Meter Pro Graph for MT4
- Currency Strength Meter Graph (shows strength of currencies with graphic lines);
- Allows to calculate average currency strength from specified timeframes;
- Many algorithms for calculation of currencies strength (MACD, RSI, CCI, RVI, MFI, Stochastic, DeMarker, Momentum);
- Moving average smoothing (allowed to smooth result with specific algorithms);
- Latency (allowed to calculate currency strength with specified interval, thus it takes less time for calculation);
The indicator needs history data of all 28 major currency pairs and 9 timeframe.
Use the Expert Adviser DownloadHistory28a9.ex4 to download market history data automatically: https://www.mql5.com/en/blogs/post/728216.
Relative links:
- Read this article to get more knowledge How to use Currency Strength Meter Pro to write your own Expert Advisor for MT4
Communication:
- Join Take Profit Channel to get latest news and updates.
- Join Take Profit Group to discuss products of author.
- If you want new feature contact me please.