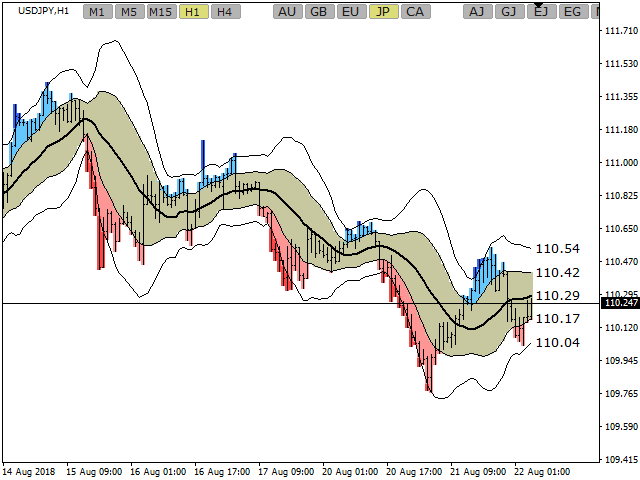
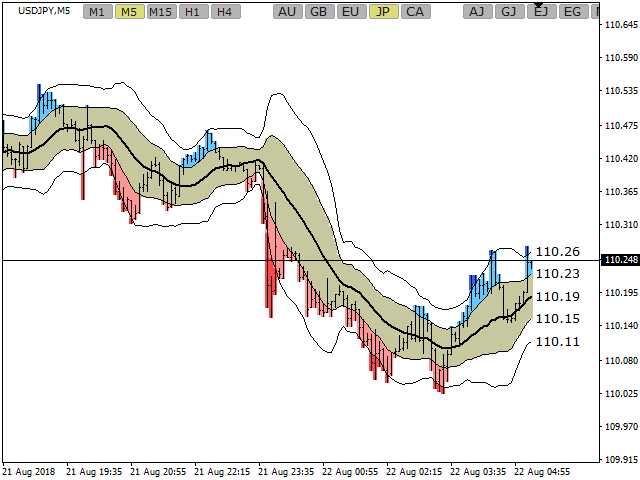
• 概要
  • レビュー (3)
  • コメント (2)

SDX Chart

4.5

The SDX Chart is a free additional indicator which can be used in combination with SDX Dashboard.

Features

  • Ability to review the history of each symbol and time frame.
  • Ability to change symbols and time frames with one click.
  • Works perfectly in combination with SDX Dashboard and helps you to understand the system better.

Settings

  • MA Period - number of periods for the calculation of the moving average and the standard deviation.
  • Number of Bars - how far back to draw the indicator.
  • Buttons Size Multiplier - increase or decrease the size of the buttons.
  • Font Size Multiplier - increase or decrease the size of the font.
  • Horizontal Distance - horizontal position of the buttons.
  • Vertical Distance - vertical position of the buttons.
  • Chart Auto Set - enable or disable the automatic chart configuration.
  • Inputs for the 10 symbols and their short names.
  • Select the 5 time frames.

Note! You can test SDX Dashboard by downloading the free limited version from here.

If you have some questions, or if you need help, contact me via PM.

レビュー 3
topline8000
1144
topline8000 2022.05.03 14:35 
 

BEST YET

sunnychow
8902
sunnychow 2018.11.25 08:31 
 

User didn't leave any comment on rating.

おすすめのプロダクト
Reversal Monster Mini
Abdulfattah Yahya Mohammed Alhazmi
The Most advanced and comprehensive EA to trade Trend Reversals/Pullbacks It is a very profitable EA, to trade trends breakout, and manage trades, takeprofit, stoploss, move to breakeven, and trailing stop. The   “Reversal Monster EA”   trades Reversal/Pullbacks when the current price of the pair pullback to a predefined horizontal level or trendline on the currency chart. The opening of the position can be immediate after pullback to the drawn trendline or after closing the candle below/abov
FREE
The CAP Channel Trading is a volatility-based indicator that makes use of the “advanced envelope theory”. These envelopes consist of two outer lines. Envelope theory states that the market price will generally fall between the boundaries of the envelope (or channel). If prices move outside the envelope, it is a trading signal or trading opportunity. Benefits of the Channel Trading Indicator CAP Channel Trading works with any asset It can be applied to any financial assets: forex, cryptocu
FREE
MASi Three Screens is based on the trading strategy by Dr. Alexander Elder. This indicator is a collection of algorithms. Algorithms are based on the analysis of charts of several timeframes. You can apply any of the provided algorithms. List of versions of algorithms:     ThreeScreens v1.0 - A simple implementation, with analysis of the MACD line;     ThreeScreens v1.1 - A simple implementation, with analysis of the MACD histogram;     ThreeScreens v1.2 - Combines the first two algorithms
FREE
We present you the indicator "Candle closing counter", which will become your indispensable assistant in the world of trading. That’s why knowing when the candle will close can help: If you like to trade using candle patterns, you will know when the candle will be closed. This indicator will allow you to check if a known pattern has formed and if there is a possibility of trading. The indicator will help you to prepare for market opening and market closure. You can set a timer to create a p
Spread Monitoring is a unique product for analyzing a spread. Unlike most similar indicators, Spread Monitoring uses ticks rather than bars allowing you to detect abnormal spread expansions. Features Works on ticks rather than bars. Simple and easy indicator configuration. Works on all timeframes. Works on any financial instrument. No repainting. Parameters Total - number of displayed ticks. clrSpread - indicator line color.
FREE
The indicator shows the potential trend direction by cyclical-wave dependence. Thus, all the rays of the intersection will be optimal rays, in the direction of which the price is expected to move, taking into account the indicator period. Rays can be used as a direction for potential market movement. But we must not forget that the approach must be comprehensive, the indicator signals require additional information to enter the market.
Gemini EA
Peter Roy Sorenson
4.5 (2)
NEW VERSION of Gemini:   Changes with signal combinations, SL/TP values and amount of pairs and TF’s available.   Please make sure you download V 1.1 and ONLY use set files for each pair and TF given!   Signal has been updated with this new version. Gemini  is a complex Expert Advisor that uses Awesome Oscillator closing bar price, ATR Ranges and Bar Pattern combinations for opening trades with managing and closing trades based on Bollinger Band Width Ratio’s.   Though the algorithms are consta
FREE
HFT KING EA のご紹介 - トレーディングの究極の HFT KING!この完全に自動化された高頻度取引システムは、高度なアルゴリズムと最先端の機能により、お客様の取引体験に革命をもたらすように設計されています。 HFT King は、テクニカル分析、人工知能、高頻度取引、機械学習を独自に組み合わせて、トレーダーに信頼性が高く収益性の高い取引シグナルを提供します。 HFT King の最先端テクノロジーは、取引機会の特定、市場動向の分析、取引の正確な実行に非常に効果的です。 EA の強力なエントリーおよびエグジット ロジックはバークローズのみで動作し、市場ノイズを排除し、スピードを最適化し、ストップロスハンティングを回避し、将来的に信頼性が高く安定した利益を保証します。 高頻度取引の究極の王様の次の高レベルに挑戦する準備をしてください!最先端のテクノロジーと高度な取引機能のパワーを体験してください。 推奨事項: 通貨ペア: XAUUSD 時間枠: M15 最低入金額 : $1000 ブローカー アカウント タイプ: ECN、Raw、またはスプレッドが非常に低い Razor を
Scalping Snake Proは、トレーダーに価格逆転の瞬間を示し、再描画しないユニークなスキャルピングインジケーターです。このインジケーターは、インターネット上の他の多くのインジケーターとは異なり、その値を再描画しません。それはあなたが取引を開くのに遅れないことを可能にする最初のバーにシグナルを描きます。このインジケーターは、シグナルが表示されたときに電話と電子メールでトレーダーに通知を送信します。このすべての機能をたったの147ドルで手に入れることができます。 この指標と取引する方法は? H1タイムフレームを開きます。通貨ペアGBPUSDまたはEURUSD。インジケーターが青い線を引く最初のバーを待っています。 TakeProfitを購入して+20ポイントを設定する取引を開始します。 StopLossは反対方向のシグナル、つまり赤い線になります。売り取引を開始するには、インジケーターが赤い線を引く最初のバーを待ちます。その後、販売取引を開始します。利益を20ポイント獲得します。 StopLossは反対方向、つまり青い線の信号になります。 このインジケーターは再描画されて
The Comparison indicator can be used as an independent trading system. It is based on the idea that some currency pairs follow each other. The indicator allows you to simultaneously display another chart on the chart of one currency pair, which allows you to anticipate some movements and quite accurately determine the beginning of trends. The principle of trading by indicator signals is also simple: a currency pair, the chart of which is above, should be sold, and the one below, should be bou
トレーディング ゲームをターボチャージする準備はできましたか? Bullish Wave は、収益性の高いトレーダーになるために必要な優位性を提供する、完全に自動化された取引ソフトウェアです。 強力な分析、リアルタイムの市場データ、直感的なツールを備えています。 Bullish Wave を使用すると、プロのように外国為替市場で楽に取引することができます。 当社の完全に自動化された EA は、業界をリードする 2 つのインジケーター、Bears Power インジケーターと ADX インジケーターで動作します。 統合されたストップロス機能とテイクプロフィット機能を使用して、これまで以上に迅速かつ安全にポジションを開きます。 間違いを犯すのをやめて、Bullish Wave でプロのように取引を始めましょう! エキスパートは、2020 年 1 月 1 日から 2023 年 1 月までの EURUSD M15 履歴データでテストされました (MT4 での 3 年間のバックテスト)。 MT4 プラットフォームで EUR USD - M15 時間枠の履歴を正しくダウンロードし
FREE
Aristocrat EA is a sophisticated grid bot designed to navigate the the harsh and unforgiving market with precision and agility. This AI-driven software embodies the essence of efficiency, reliability, and adaptability, making it stand out as one of the best grid bots in the trading scene. This EA stands out from other grid systems by its risk management system and multi-currency trading on one chart. Advantages of Aristocrat EA : Advanced grid trading system with AI optimizing the strategy
Before you buy a Project Profit please be aware of the risks involved: Past performance is no guarantee of future profitability (the EA could also make losses).  The backtests shown (e.g. in screenshots) are highly optimized to find the best parameters but therefore results cannot be transferred to live trading. Any mean reversion can get caught on the wrong side of a fast movements due to unexpected news or flash crashes. This strategy will always use a stop loss, but still execution of the St
Elite Ranger
Amirhossein Heydarijokani
マーチンゲールなし アンチマーチンゲールなし グリッドなし HFTなし ダブリングなし すべてのポジションにはストップロスがあります このEAの推奨事項 EURCHF を強くお勧めしますが、EURJPYとEURCADの通貨ペアも良い結果が得られます。 EURCHFの場合 、M30を使用することをお勧めしますが、M5、M15、H1も適切な時間枠です。 EAは良い ECN アカウントで動作する必要があります。 平均 スペアは 10ポイント を超えてはなりません。 ゼロ ストップレベル が最適です。 このEAは、危険な突然 のスリッページ が高いブローカーには使用しないでください。 EURCHFの平均スプレッドが10ポイント、ロットあたりの手数料が低く、スリッページが低く、ストップレベルがゼロ、スワップフリーのオプションがある Alpari Pro-ECN アカウントのEAを使用することをお勧めします。 パラメータの概要 デフォルト設定は、EURCHF(Alpariブローカー)用にテストおよび最適化されています 時代   インジケーターの左側のバー履歴を設定できます。値が大きいほど
This indicator has been created for finding the probable reversal points of the symbol price. A small candlestick reversal pattern is used it its operation in conjunction with a filter of extremums. The indicator is not redrawn! If the extremum filter is disabled, the indicator shows all points that have a pattern. If the extremum filter is enabled, the condition works – if the history Previous bars 1 candles back contains higher candles and they are farther than the Previous bars 2 candle, such
FREE
トレンドキャッチャー: アラートインジケーター付きのトレンドキャッチャーストラテジーは、市場トレンドやポテンシャルなエントリーポイントやエグジットポイントを特定するのに役立つ多目的な技術分析ツールです。動的なトレンドキャッチャーストラテジーを備えており、市場状況に適応してトレンドの方向を明確に視覚化します。トレーダーは、自身の好みやリスク許容度に合わせてパラメーターをカスタマイズできます。このインジケーターはトレンドの識別を支援し、ポテンシャルなリバーサルをシグナルし、トレイリングストップのメカニズムとして機能し、市場への迅速な対応のためのリアルタイムアラートを提供します。 特徴: - トレンドの識別:上昇トレンドと下降トレンドをシグナルします。 - トレンドのリバーサル:ローソク足の色が上昇から下降に変わった場合やその逆の場合に、ポテンシャルなリバーサルを警告します。 - リアルタイムアラート:新しいトレンドの識別に対するアラートを生成します。 推奨事項: - 通貨ペア:EURUSD、AUDUSD、XAUUSDなど... - タイムフレーム:H1。 - アカウン
FREE
Shark Deal Book
Philip Pankaj Suthagar
4 (3)
Term  "shark"  in the business world denotes a high volume investor who just made a good investment in a highly Potential business deal.So, sharks are the ones who make the market move. In our case, if an American shark bought a Japanese company, he/she has to convert American dollars into Japanese yen to make the deal. So, the demand for the Japanese yen will increase sharply. Thus USD/JPY will go short rapidly if the deal was from the shark. Another example, In the case of forex, if fed increa
Smart Trade and Order Manager: An Essential Tool for Precision Trading Smart Trade and Order Manager is your trusted trading assistant, meticulously designed to simplify and streamline your trading operations. It empowers traders by enabling swift order execution and effortless order management, allowing you to dedicate your valuable time to in-depth market analysis and decision-making. With just a few clicks, you can initiate various order types, ensuring you are always in control of your tradi
FREE
CyberZingFx Trend Reversal Indicator - your go-to solution for accurate and reliable trend reversal signals. With its unique trading strategy, the indicator offers you Buy and Sell Arrow signals that do not repaint, making it a reliable tool for catching Swing Highs and Swing Lows. SCROLL DOWN TO VIEW SCREENSHOTS AND WATCH VIDEO ________________________________________________________________ Trading using CyberZingFx Trend Reversal is Simple Using the CyberZingFx Trend Reversal Indicator is e
FREE
Free automatic Fibonacci is an indicator that automatically plots a Fibonacci retracement based on the number of bars you select on the BarsToScan setting in the indicator. The Fibonacci is automatically updated in real time as new highest and lowest values appears amongst the selected bars. You can select which level values to be displayed in the indicator settings. You can also select the color of the levels thus enabling the trader to be able to attach the indicator several times with differe
FREE
Project IG MT4
Ruslan Pishun
1.78 (9)
The EA is not a scalper. The EA uses a strategy based on the breakdown of local support and resistance levels, also uses the reverse and rebound from support and resistance levels.  The EA is based on the original author's strategy. Real monitoring:   https://www.mql5.com/en/signals/author/profi_mql Detailed description of the strategy here:  https://www.mql5.com/ru/blogs/post/728430 This is a link for general discussion of the EA:  https://www.mql5.com/ru/blogs/post/728430 Hidden Take profit,
Indicator for binary options arrow is easy to use and does not require configuration works on all currency pairs, cryptocurrencies buy signal blue up arrow sell signal red down arrow tips do not trade during news and 15-30 minutes before their release, as the market is too volatile and there is a lot of noise it is worth entering trades one or two candles from the current period (recommended for 1 candle) timeframe up to m 15 recommended money management fixed lot or fixed percentage of the depo
Taurusは、当社独自の実際の取引量データを活用し、すでに効果的であったMean Reversion戦略を改良するための献身的な努力の頂点を象徴しています。各シンボルを独自のベストな設定で取引し、卓越したリスク・リワード・レシオとバランスの取れたストレスのない取引体験をユーザーに提供します。 主要データ 独自のリアル出来高データに基づく平均回帰戦略 グリッド、マーチンゲール、平均化を使用しない本格的なリスク管理 28の主要なFXシンボルすべてを、それぞれの最適な設定で処理 シンボルごとに最大1トレード、常にストップロスを固定 すべてのトレーダーに適した、取引ごとに100%調整可能なリスク 100%FIFO対応 100%プロップファーム対応 リンク タウラスFAQ - クリック Taurus Chat - クリック 取引シグナル - クリック テクニカル要件 1.お願い 以下のURL をターミナルのプロパティで許可されたURLのリストに 追加して ください。 - 出来高データ用 -> https://stein.investments - ニュースモジュール -> h
Scalping indicator. It takes into account volatility, price movement in the local interval and the direction of the current trend. Recommended timeframe - M5. Advantages: Low volatility when a signal appears ensures minimal movement against an open position. The indicator does not redraw its signals. There are alert signals. It is a great tool for day trading. Settings: Name Description Period Indicator period Range of each bar in the period (pp.) The maximum size of each candle in the indicat
FREE
Simple RSI Forex Trading Strategy
Victor Manuel Valderrama Zamora
4 (1)
Diversify the risk in your trading account by combining our Expert Advisors. Build your own custom trading system here:   Simple Forex Trading Strategies The expert advisor opens trades when RSI indicator enter in oversold or overbought areas. The Stop Loss, Take Profit, and Trailing Stop are calculated based on the ATR indicator. The recommended currency pair is EURGBP and the recommended timeframe to operate and to do backtests is H4. This Expert Advisor can be profitable in any TimeFrame a
FREE
インジケーターは、古典的なガンの角度と同様に、(特定のキャンドルをクリックした後)トレンドラインのファンを構築します。インジケーターの特徴は、固定スケールで角度を作成するだけでなく、特定の数のバーの平均価格を使用することです(オプション)。 インジケーターの角度の平均価格を計算する方法は2つあります(オプション)。 1)高値から安値への(特定の数のバーの)平均価格の動きの計算。 2)平均価格の計算はオープンからクローズに移動します。 オプション: 1.Method -コーナーを構築する方法。 2. FixedScale-固定スケール(メソッドでFixed_Scaleが選択されている場合)。 3.SecondaryAngles-二次角度を描画するための許可を制御します。 4.RayRight-トレンドラインの光線を設定します。 5.DrawBackground-背景として線を描画します。 6.AnglesQuantity-角度の数。 7. Bars_To_Process-期間、バーの数、これに基づいて平均価格が決定され
MACD Color for GOLD  Use for looking moving-way of graph and checking will be buy or sell  Easy for looking by see the color of trand. Red is down / Blue is up.  Can to use it with every time-frame by 1. Long Trade : Use it with time-frame H1 /  H4 /  Daily  2.Short Trade : Use it with  time-frame  M5 / M15  / M 30 /  H1 and you can see when you will open or close the orders by see this indicator by well by see signal line cut with color line again in opposite. and you can use this indicator for
Are you tired of drawing trendlines every time you're analyzing charts? Or perhaps you would like more consistency in your technical analysis. Then this is for you. This indicator will draw trend lines automatically when dropped on a chart. How it works Works similar to standard deviation channel found on mt4 and mt5. It has 2 parameters: 1. Starting Bar 2. Number of bars for calculation The   starting bar   is the bar which drawing of the trend lines will begin, while the   number of bars for c
FREE
TrendPlus
Sivakumar Subbaiya
4.08 (12)
Trend Plus   Trendplus  Indicator   Time Frame: Suitable for any time frame.  Purpose: Trend Prediction. Blue and red candle indicate the buy and sell call respectively. Buy: When the blue candle is formed buy call is initiated. close the buy trades when the next red candle will formed.   Sell: When the Red candle is formed Sell call is initiated. close the Sell trades when the next blue candle will formed.   Happy trade!!
FREE
QuantumAlert RSI Navigator is a free indicator available for MT4/MT5 platforms, its work is to provide "alerts" when the market is inside "overbought and oversold" regions in the form of "buy or sell" signals. This indicator comes with many customization options mentioned in the parameter section below, user can customise these parameters as needful. Join our   MQL5 group , where we share important news and updates. You are also welcome to join our private channel as well, contact me for the pri
FREE
このプロダクトを購入した人は以下も購入しています
Gann Made Easy は、ミスター・ギャンの理論を使用した取引の最良の原則に基づいた、プロフェッショナルで使いやすい外国為替取引システムです。 W・D・ガン。このインジケーターは、ストップロスとテイクプロフィットレベルを含む正確な買いと売りのシグナルを提供します。 PUSH通知を利用して外出先でも取引可能です。 購入後はご連絡ください!私の取引のヒントと素晴らしいボーナスインジケーターを無料で共有します! おそらく、ギャンの取引手法についてはすでに何度も聞いたことがあるでしょう。通常、ギャンの理論は初心者のトレーダーだけでなく、すでにある程度の取引経験がある人にとっても非常に複雑なものです。なぜなら、ギャンの取引手法は理論的にはそれほど簡単に適用できるものではないからです。私はその知識を磨き、最良の原則を私の外国為替インジケーターに組み込むために数年を費やしました。 このインジケーターは非常に簡単に適用できます。必要なのは、それをチャートに添付し、簡単な取引推奨事項に従うだけです。このインジケーターは常に市場分析の仕事を行い、取引の機会を探します。適切なエントリーポイントを検出
最初のパルスレベルを反転 (RFI)     指示する     ロシア     -        utilizar con   el indicador の ESP 推奨事項 -   TPSpro トレンド プロフェッショナル版 -   MT5のバージョン 最も重要なことは、将来においても最も重要なことです。 機能のプリンシパル: ゾーンのほとんどは、ベンダーとコンプラドールによってアクティブ化されます。 状況を直感的に把握できるよう、初期の衝動を修正します。 LOGIC AI: MUESTRA zonas (círculos) parabuscar puntos de entrada cuando se activa una plantilla 視覚的に優れた視覚効果があり、最も重要な機能がすべて揃っていることに注意してください。 優れたニベレス/ゾーンの視覚化 (modo MTF) 世界で最も人気のある場所/ゾーンです。これを使用するのに最適な方法です (   TPSproTREND PRO   )。 アルゴリズム プロフェッショナル セパラド パソ ア パソ パラ オペラ それは
Gold Stuff
Vasiliy Strukov
4.89 (238)
Gold Stuff は、金専用に設計されたトレンド指標であり、あらゆる金融商品にも使用できます。 インジケーターは再描画せず、遅れません。 推奨時間枠 H1. それインディケータでフルオートExpert Advisor EA Gold Stuffが動作します。 あなたは私のプロフィールでそれを見つけることができます. 設定と個人的なボーナスを得るために、購入後すぐに私に連絡してください! トレンド スキャナーの強力なサポートを利用して、無料のインジケーターを入手し、プライバシーを守ります。あーみー!   設定 矢印を描く - オンオフ。 チャートに矢印を描く。 アラート - 可聴アラートのオンオフ。 メール通知 - オンオフ。 電子メール通知。 プチ通知 - オンオフ。 プッシュ通知。 次に、色域を調整します。 Gold Stuff は、金専用に設計されたトレンド指標であり、あらゆる金融商品にも使用できます。 インジケーターは再描画せず、遅れません。 推奨時間枠 H1. それインディケータでフルオートExpert Advisor EA Gold Stuff
まず第一に、この取引インジケーターは再描画されず、再描画されず、遅延しないことを強調する価値があります。これにより、手動取引とロボット取引の両方に理想的なものになります。 ユーザーマニュアル:設定、入力、戦略。 アトミックアナリストは、価格の強さとモメンタムを利用して市場でより良いエッジを見つけるためのPA価格アクションインジケーターです。ノイズや誤ったシグナルを除去し、取引ポテンシャルを高めるための高度なフィルターを備えています。複雑なインジケーターの複数のレイヤーを使用して、アトミックアナリストはチャートをスキャンし、複雑な数学的計算をシンプルなシグナルと色に変換します。これにより、どのような初心者トレーダーでも理解して使用し、一貫した取引の決定を行うことができます。 「アトミックアナリスト」は、新規および経験豊富なトレーダー向けにカスタマイズされた包括的な取引ソリューションです。プレミアムインジケーターとトップノッチの機能を1つの取引戦略に組み合わせ、すべてのタイプのトレーダーにとって汎用性のある選択肢にします。 デイリートレーディングとスキャルピング戦略:高
Trend Punch
Mohamed Hassan
4.95 (19)
This indicator is unstoppable when combined with our other indicator called  Support & Resistance . After purchase, send us a message and you will get it   for  FREE as a BONUS! Introducing Trend Punch , the revolutionary forex trend indicator that will transform the way you trade! Trend Punch is uniquely designed to provide precise buy and sell arrows during strong market trends, making your trading decisions clearer and more confident. Whether you're trading major currency pairs or exotic sym
TPSpro TREND PRO は 、市場を自動的に分析し、トレンドとその各変化に関する情報を提供し、再描画せずに取引に参加するためのシグナルを提供するトレンド指標です。 インディケータは各ローソク足を使用し、個別に分析します。さまざまなインパルス(アップまたはダウンインパルス)を指します。通貨、仮想通貨、金属、株、指数の取引への正確なエントリーポイント! バージョンMT5                   インジケーターの完全な説明   インジケーター -   RFI LEVELS と併用することをお勧めします。 主な機能: レンダリングなしで正確な入力信号! シグナルが表示された場合、それは関連性を維持します。これは、シグナルを提供してからそれを変更する可能性があり、入金時の資金の損失につながる可能性があるリドローインジケーターとの重要な違いです。より高い確率と精度で市場に参入できるようになりました。矢印が表示された後、ターゲットに達する (利益確定) か反転シグナルが表示されるまで、ローソク足を色付けする機能もあります。 STOP LOSS / TAKE PROFIT
Trend Screener
STE S.S.COMPANY
4.8 (87)
トレンドインジケーター、1つのツールに組み込まれたすべての重要なトレンド機能を備えたトレンドトレーディングとフィルタリングのための画期的なユニークなソリューション! これは、すべてのシンボル/商品(外国為替、商品、暗号通貨、インデックス、株式)で使用できる100%再描画されていないマルチタイムフレームおよびマルチ通貨インジケーターです。 期間限定オファー: サポートおよびレジスタンス スクリーナー インジケーターは、たった 50 ドルで永久的にご利用いただけます。(元の価格 250 ドル) (オファー延長) トレンドスクリーナーは、チャート内のドットで矢印トレンドシグナルを提供するインジケーターに続く効率的なインジケーターです。 トレンド分析インジケーターで使用できる機能: 1.トレンドスキャナー。 2.最大利益分析を備えたトレンドライン。 3.トレンド通貨強度メーター。 4.アラート付きのトレンド反転ドット。 5.アラート付きの強いトレンドドット。 6.トレンド矢印 毎日の分析例、毎日のシグナルパフォーマンス...など、トレンドスクリーナーインジケーターを使用して、ここで見つけること
mql5と Telegramの モーニング・ブリーフィングで、詳細とスクリーンショットを含む毎日のマーケット・アップデートをご覧 ください! FX Power MT4 NGは 、長年の人気を誇る通貨強度計FX Powerの次世代モデルです。 この次世代ストレングスメーターは何を提供するのでしょうか?初代FXパワーの魅力すべて プラス GOLD/XAUの強さ分析 より正確な計算結果 個別に設定可能な分析期間 カスタマイズ可能な計算上限値により、さらに優れたパフォーマンスを実現 もっと見たい人のための特別なマルチインスタンス設定 すべてのチャートでお好みの色を無限に設定可能 数え切れないほどの通知オプションにより、重要なことを見逃すことはありません。 Windows 11とmacOSのスタイルで角を丸くした新しいデザイン 魔法のように動くインジケーターパネル FXパワーの主な機能 すべての主要通貨の強さの完全な履歴 すべての時間枠における通貨の強さの履歴 すべてのブローカーとチャートで同一の計算結果 100%信頼できるリアルタイム計算 -> リペイントなし ドロップダウン・リストから
FX Volume
Daniel Stein
4.58 (33)
mql5と Telegramの モーニング・ブリーフィングで、詳細とスクリーンショットを含む毎日のマーケット・アップデートをご覧 ください! FX Volumeは、ブローカーの視点から市場のセンチメントをリアルに洞察する、最初で唯一の出来高インジケーターです。 ブローカーのような機関投資家が外国為替市場でどのようなポジションをとっているか、COTレポートよりもはるかに速く、素晴らしい洞察を提供します。 この情報をチャート上で直接見ることは、あなたの取引にとって真のゲームチェンジャーであり、画期的なソリューションです。 以下のようなユニークなマーケットデータ洞察から利益を得てください。 比率は 、通貨のロングポジションとショートポジションの比率をパーセントで表示します。 比率の変化は 、選択した期間内のロング比率とその変化率を表示します。 Volumes Totalは 、通貨の取引量(ロングとショート)の合計をロット単位で表示します。 Volumes Long :全通貨のロングポジションの取引量を表示します。 Volumes(ショート )は、全通貨のショートポジションの取引量を表示
An exclusive indicator that utilizes an innovative algorithm to swiftly and accurately determine the market trend. The indicator automatically calculates opening, closing, and profit levels, providing detailed trading statistics. With these features, you can choose the most appropriate trading instrument for the current market conditions. Additionally, you can easily integrate your own arrow indicators into Scalper Inside Pro to quickly evaluate their statistics and profitability. Scalper Inside
- Real price is 80$ - 40% Discount ( It is 49$ now ) Contact me for instruction, add group and any questions! Related EA Product: Bitcoin Expert Introduction The breakout and retest strategy is traded support and resistance levels. it involves price breaking through a previous level.  The break and retest strategy is designed to help traders do two main things, the first is to avoid false breakouts. Many false breakouts start with a candlestick that breaks out of a level but ends with an immedi
Enigmera
Ivan Stefanov
5 (3)
エニグメラ:市場の中核 https://www.enigmera.com はじめに このインディケータと取引システムは、金融市場に対する驚くべきアプローチです。ENIGMERAは、フラクタルサイクルを使用して、サポートとレジスタンスレベルを正確に計算します。本格的な蓄積局面を示し、方向性と目標を示します。 トレンド中でも調整中でも機能するシステムです。 どのように作動するのか? ENIGMERAは、支持線・抵抗線、目標線、乖離線の3つのラインで構成されています。このシステムは、過去のデータを現在と未来に外挿する典型的な市場指標とは異なり、現在の完全な画像を提供します。支持線上にある場合、それは本当の支持を意味し、抵抗線上にある場合、それは本当の抵抗を意味する。ある水準が破られた場合、それはトレンドの変化を意味する。再描画はしない。 市場は常に進化しているため、ENIGMERAはその評価ツールを適応させ、定期的に戦略を修正しています。  これにより、すべてのシナリオが徹底的に評価されることが保証されます。この市場指標の独自性は、その能力を見れば明らかです。  ENIGM
Chart Patterns All-in-One インジケーターは、トレーダーがテクニカル分析で一般的に使用されるさまざまなチャートパターンを視覚化するのに役立ちます。このインジケーターは市場の潜在的な動きを特定するのに役立ちますが、収益性を保証するものではありません。購入前にデモモードでテストすることをお勧めします。 現在のオファー : 「Chart Patterns All in One」インジケーターが50%割引。 含まれるパターン : 1-2-3 パターン : 3つの主要なポイント(高値または安値)を使用して市場の反転を検出します。 買い : 2つの連続する安値の後に、前の高値よりも低い高値が出現。 売り : 2つの連続する高値の後に、前の安値よりも高い安値が出現。 可視化 : 特定されたポイントを線と矢印で接続。 ダブルトップとダブルボトム : 価格がほぼ同じ2つの連続した高値(ダブルトップ)または安値(ダブルボトム)を形成したときに、反転の可能性を示します。 ダブルトップ : ベアリッシュな反転。 ダブルボトム : ブルリッシュな反転。 可視化 : ピークまたは谷を線で接
MetaBands M4
Vahidreza Heidar Gholami
5 (2)
MetaBandsは、強力でユニークなアルゴリズムを使用してチャンネルを描画し、トレンドを検出して、トレーダーに取引の入出ポイントを提供することができます。チャンネル指標に加えて、強力なトレンド指標でもあります。入力パラメータを使用して新しいチャンネルを作成するために、異なるタイプのチャンネルを統合することができます。MetaBandsは、市場のイベントについてユーザーに通知するために、すべてのタイプのアラートを使用します。 特徴 ほとんどのチャンネルアルゴリズムをサポート 強力なトレンド検出アルゴリズム 異なるタイプのチャンネルを統合する能力 マルチタイムフレームおよびマルチカレンシー(シグナルマトリックス) すべてのタイプのアラート機能(サウンド、画面フラッシャー、プッシュ通知、メール、ポップアップ、矢印) 再描画しない トレンド検出 MetaBandsは、チャネル内を振動する青いラインを使用してトレンドを検出します。ラインがチャネルの上部バンドに達すると、下降トレンドの開始を示し、下部バンドに達すると上昇トレンドの開始を示します。青いラインが中心ラインに近づくと、市場はコンソ
ブレーカートレーダーになり、価格が反転すると市場構造からの利益が変化します。 注文ブロックブレーカーインジケーターは、トレンドまたは価格の動きが枯渇に近づいており、逆転の準備ができていることを識別します。通常、反転または大規模なプルバックが発生しようとしているときに発生する市場構造の変化について警告します。 この指標は、ブレイクアウトと価格の勢いを識別する独自の計算を使用します。使い果たされる可能性のあるポイントの近くで新しい高値が形成されるたびに、インディケーターはその高値の作成を担当する最後の注文ブロックを描きます。次に、移動する価格とともに注文ブロックを追跡します。その後、価格が反対方向にシフトし、その注文ブロックを突破すると、新しい市場構造を作成し、トレンドまたは大きな後退の可能性のある反転の開始を警告します。 注文ブロックは、高値/安値が作成される前の最後の反対色のろうそくであり、価格がこれらの重要な領域を下抜けすると、トレンドの短期的ま​​たは長期的な反転の兆候です。 特徴 重要な枯渇点での市場構造の変化を警告します 価格が使い果たされるレベルに近づくと、
現在20%OFF! 初心者やエキスパートトレーダーのためのベストソリューション! このダッシュボードソフトウェアは、28の通貨ペアで動作しています。それは私達の主要な指標(高度な通貨の強さ28と高度な通貨インパルス)の2に基づいています。それは全体の外国為替市場の大きい概観を与えます。それは、すべての(9)時間枠で28の外国為替ペアのための高度な通貨の強さの値、通貨の動きの速度と信号を示しています。チャート上で1つのインディケータを使用して市場全体を観察し、トレンドやスキャルピングの機会をピンポイントで見つけることができたら、あなたのトレードがどのように改善されるか想像してみてください。 このインディケータには、強い通貨と弱い通貨の識別、潜在的な取引の識別と確認がより簡単になるような機能が搭載されています。このインディケータは、通貨の強さや弱さが増加しているか減少しているか、また、すべての時間枠でどのように機能しているかをグラフィカルに表示します。 新機能として、現在の市場環境の変化に適応するダイナミックなマーケットフィボナッチレベルが追加され、すでに当社のAdvan
Bomb Bank Signal
Igor Pereira Calil
5 (1)
Bomb Bank シグナル: MetaTrader 4 の信頼度インジケーター Bomb Bank Signal は、金融市場で最も関連性の高いトレンドを特定するように設計された MetaTrader 4 の強力なインジケーターです。動きを正確に予測するツールをお探しなら、Bomb Bank が最適です。 仕組み: このインジケーターは、出来高分析、ローソク足終値、対称トレンドという 3 つの異なる方法を組み合わせて、売買の機会を検出してシグナルを送ります。 Bomb Bank は、買いの機会を特定するときは「爆弾」のようなものであり、売りシグナルを検出するときは「ドクロ」のようなものです。 ボムバンクはなぜ違うのですか? 完全な信頼性: Bomb Bank Signal は信号を削除しません。一度シグナルが発せられると、シグナルは残り続けるので、チャンスを逃すことはありません。 極めて高い精度: Bomb Bank は誤った信号を送信しません。リアルタイムで最新情報を更新し、市場の進化に合わせて調整しながら、以前のシグナルの透明性を維持します。 ライブアップデ
トレンドカッターは、M1 や M5 などの下位時間枠を含むあらゆる時間枠で使用できるトレンド指標です。このインジケーターは日中取引を好むトレーダーにとって理想的であり、長期取引を好むトレーダーにも役立ちます。このインジケーターは、取引システムの基礎として、またはスタンドアロンの取引ソリューションとして使用できます。 このインジケーターは、PUSH 通知を含むあらゆるタイプのアラートを提供します。 インジケーターの使い方はとても簡単です。信号に従えばいいだけです。また、このインジケーターのすべてのユーザーに、このメソッドをできるだけ効率的に使用するのに役立つ追加のインジケーターも無料で提供します。 取引のヒントと素晴らしいボーナスを入手するには、購入後にご連絡ください。
通貨強さウィザードは、取引を成功させるためのオールインワン ソリューションを提供する非常に強力な指標です。このインジケーターは、複数の時間枠のすべての通貨のデータを使用して、このまたはその外国為替ペアのパワーを計算します。このデータは、使いやすい通貨インデックスと通貨パワーラインの形式で表され、特定の通貨のパワーを確認するために使用できます。 必要なのは、取引したいチャートにインジケーターを接続することだけです。インジケーターは、取引する通貨の実際の強さを示します。このインジケーターは、トレンドに合わせて取引するときに有利に利用できる売買高の圧力の極値も示します。このインジケーターには、フィボナッチに基づく可能なターゲットも表示されます。 このインジケーターは、PUSH 通知を含むあらゆるタイプのアラートを提供します。 購入後ご連絡下さい。私の取引のヒントをあなたと共有し、素晴らしいボーナスインジケーターを無料で提供します! 幸せで有益な取引をお祈りします。
TakePropips Donchian Trend Pro
Eric John Pajarillaga Aldana
4.44 (16)
TakePropips Donchian Trend Pro   (MT4) は、ドンチャン チャネルを使用してトレンドの方向を自動的に検出し、エントリーとエグジットの取引シグナルを提供する強力で効果的なツールです! この多機能インジケーターには、トレンド スキャナー、取引シグナル、統計パネル、スクリーナー、取引セッション、およびアラート履歴ダッシュボードが含まれます。取引シグナルを提供し、チャートを分析する時間を節約するように設計されています! ユーザー マニュアルとインストール ガイドは、ブログ投稿 (   https://www.mql5.com/en/blogs/post/751368   ) からダウンロードできます。 今日は 50% オフ! 98ドルから49ドルに値下げ! このインジケーターは、ストラテジー テスターでテストできます (ビジュアル モードを有効にします)。 詳細については、説明の下にあるビデオ チュートリアルも利用できます。 ご不明な点やサポートが必要な場合は、私に連絡してください。 TakePropips Donchian Trend Pro イン
現在20%OFF! このダッシュボードは、複数のシンボルと最大9つのタイムフレームで動作するソフトウェアの非常に強力な部分です。 このソフトは、弊社のメインインジケーター(ベストレビュー:Advanced Supply Demand)をベースにしています。    Advanced Supply Demand ダッシュボードは、素晴らしい概要を提供します。それは示しています。  ゾーン強度評価を含むフィルタリングされた需給値。 ゾーン内/ゾーンへのPips距離。 ネストされたゾーンがハイライトされます。 選択されたシンボルの4種類のアラートを全ての(9)時間枠で提供します。 それはあなたの個人的なニーズに合わせて高度に設定可能です。 あなたの利益! すべてのトレーダーにとって最も重要な質問です。 市場に参入するのに最適なレベルはどこか? 成功のチャンスとリスク/リターンを得るために、強力な供給/需要ゾーン内またはその近くで取引を開始します。 損切りの最適な位置はどこですか? 最も安全なのは、強力な供給/需要ゾーンの下/上にストップを置くことで
現在26%オフ 初心者やエキスパートトレーダーに最適なソリューション! このインジケーターは、独自の機能と新しい計算式を取り入れた、ユニークで高品質、かつ手頃な価格のトレーディングツールです。たった1枚のチャートで28の為替ペアの通貨強度を読み取ることができます。新しいトレンドやスキャルピングチャンスの引き金となるポイントを正確に特定することができるので、あなたのトレードがどのように改善されるか想像してみてください。 ユーザーマニュアルはこちら  https://www.mql5.com/en/blogs/post/697384 これが最初の1本、オリジナルだ! 価値のないクローンを買わないでください。 特別な サブウィンドウの矢印で強い通貨の勢いを表示 GAPがあなたのトレードを導く! 基準通貨や気配値が売られすぎ・買われすぎのゾーン(外相フィボナッチレベル)にあるとき、個別チャートのメインウィンドウに警告表示。 通貨がレンジの外側から反落した場合、プルバック/リバーサルのアラート。 クロスパターンの特別なアラート 複数の時間枠を選択可能で、トレンドを素早く
現在31%オフ! 初心者やエキスパートトレーダーに最適なソリューション! このインジケータは、独自の機能と秘密の数式を組み込んだ、ユニークで高品質かつ手頃な価格のトレーディングツールです。たった1枚のチャートで28の通貨ペアのアラートを表示します。新しいトレンドやスキャルピングチャンスの引き金となるポイントを正確に把握することができるので、あなたのトレードがどのように改善されるか想像してみてください! 新しい基本的なアルゴリズムに基づいて構築されているため、潜在的な取引の特定と確認がより簡単になります。これは、通貨の強さや弱さが加速しているかどうかをグラフィカルに表示し、その加速のスピードを測定するためです。加速すると物事は明らかに速く進みますが、これはFX市場でも同じです。つまり、反対方向に加速している通貨をペアにすれば、利益を生む可能性のある取引を特定することができるのです。 通貨の勢いを示す縦の線と矢印は、あなたの取引の指針となるでしょう。 ダイナミックマーケットフィボナッチ23レベルはアラートトリガーとして使用され、市場の動きに適応します。もしインパルスが黄色
IX Powerは 、FX Powerの無敵の精度をついにFX以外のシンボルにも提供します。 お気に入りの指数、株式、コモディティ、ETF、さらには暗号通貨の短期、中期、長期のトレンドの強さを正確に判断します。 お使いの端末が提供する すべてを分析する ことができます。ぜひお試しいただき、取引 タイミングが大幅に改善 されることをご体験ください。 IXパワーの主な特徴 100%正確で再描画されない計算結果 - ターミナルで利用可能なすべての取引シンボルに対して 予め設定され、さらに個別に設定可能な強度分析期間のドロップダウン選択 Eメール、メッセージ、モバイル通知による無数の通知オプション EAリクエストのためのアクセス可能なバッファ カスタマイズ可能な計算制限により、さらに優れたパフォーマンスを実現 もっと見たい人のための特別なマルチインスタンス設定 すべてのチャートでお好みの色を無限に設定可能 Windows 11とmacOSのスタイルで角を丸くした新しいパネルデザイン サブ・ウィンドウとメイン・チャートの間をシームレスに移動する、魔法のように動く
Stratos Pali Indicator   is a revolutionary tool designed to enhance your trading strategy by accurately identifying market trends. This sophisticated indicator uses a unique algorithm to generate a complete histogram, which records when the trend is Long or Short. When a trend reversal occurs, an arrow appears, indicating the new direction of the trend. Important Information Revealed Leave a review and contact me via mql5 message to receive My Top 5 set files for Stratos Pali at no cost! D
支持線と抵抗線、そしてローソク足のギャップをチャート上に自動的に表示するため、価格が次に向かう可能性のある場所や反転する可能性のある場所を確認することができます。 このインジケーターは、私のウェブサイト(The Market Structure Trader)で教えているポジショントレード手法の一部として使用するように設計されており、ターゲットとエントリーの可能性のための重要な情報を表示します。 このインジケーターには、2つのコア機能と4つの追加機能があります: コア機能1 - 日足、週足、月足のサポートラインとレジスタンスラインの自動表示 このインジケーターは、直近2日間、最大6週間前、数ヶ月前のサポートレベルとレジスタンスレベルを自動的に引き込みます。これらのレベルの見た目は完全にカスタマイズすることができ、いくつ表示されるかを表示することもできます。これらの重要な水準は、しばしば主要な支持線と抵抗線として機能し、価格が転換して引き戻されたり反転したりする場所です。また、価格が向かうターゲットでもあるため、価格が転換する前に、取引に利用できる潜在的な距離を素早く確認するこ
このダッシュボードは、市場構造反転インジケーターで使用するためのアラートツールです。主な目的は、特定の時間枠での取消の機会と、インジケーターと同様にアラートの再テスト(確認)についてアラートを出すことです。ダッシュボードは、それ自体でチャート上に配置され、バックグラウンドで動作して、選択したペアと時間枠でアラートを送信するように設計されています。多くの人々が1つのMT4の複数のチャートで市場反転インジケーターを実行するのではなく、一度に複数のペアと時間枠を監視するためにダッシュを要求した後に開発されました。 M5、M15、M30、H1、H4、およびD1の時間枠でアラートを出します。もちろん、取引の場合と同様に、より高い時間枠が最も効果的です。 このダッシュボードは、市場構造反転インジケーターのアドオンとして設計されています。それは独立して機能し、マーケットリバーサルアラートインジケーターによって与えられたパターンと信号にアラートを出します。 ここでマーケットリバーサルアラートインジケーターを取得します:https:// www.mql5.com/en/market/produ
Gold Channel is a volatility-based indicator, developed with a specific timing algorithm for the XAUUSD pair, which consists of finding possible corrections in the market. This indicator shows two outer lines, an inner line (retracement line) and an arrow sign, where the theory of the channel is to help identify overbought and oversold conditions in the market. The market price will generally fall between the boundaries of the channel. If prices touch or move outside the channel it is a tra
PRO Renko Systemは、特別にRENKOチャートを取引するために設計された高精度の取引システムです。 これは、様々な取引商品に適用することができる普遍的なシステムです。 システムは効果的に正確な逆転信号へのアクセスを与えるいわゆる市場の騒音を中和する。 表示器は非常に使いやすく、信号の生成に責任がある1つの変数だけがあります。 あなたは簡単にお好みの任意の取引ツールとレンコバーのサイズにツールを適応させることができます。 私はいつもあなたが私のソフトウェアで収益性の高い取引を支援するために余分なサポートを提供する準備ができています! 私はあなたに幸せで収益性の高い取引をしたいです! ご購入後にご連絡ください! 私はあなたに私のレンコチャートジェネレータを送信します。 私はまた、私の個人的な推奨事項やシステムの他のモジュールを無料で共有します!
まず第一に、この取引ツールはノンリペイント、ノンリドロー、ノンラグの指標であり、プロの取引に理想的ですことを強調する価値があります。 オンラインコース、ユーザーマニュアル、デモ。 スマートプライスアクションコンセプトインジケーターは、新米から経験豊富なトレーダーまで、非常 に強力なツールです。Inner Circle Trader AnalysisやSmart Money Concepts Trading Strategiesなど、20以上の有用な指標を1つに組み合わせています。このインジケーターはスマートマネーコンセプトに焦点を当て、大手機関の取引方法を提供し、彼らの動きを予測するのに役立ちます。 特に、流動性分析に優れており、機関がどのように取引しているかを理解しやすくしています。市場のトレンドを予測し、価格の動きを慎重に分析するのに優れています。機関の戦略とトレードを合わせることで、市場の動向についてより正確な予測ができます。このインジケーターは多目的であり、市場構造を分析し、重要な注文ブロックを特定し、さまざまなパターンを認識するのに優れています。 このインジケー
作者のその他のプロダクト
DFGX Dashboard
Tsvetan Tsvetanov
5 (2)
Take your trading to the next level with DFGX - our second generation Dynamic Fibonacci Grid. This new, powerful and easy to use application is specially designed and optimized for contrarian intraday trading, scalping and news trading on the Forex market. This system is the ideal solution for active professional traders and scalpers who are looking for innovative ways to optimize their strategy. The system also provides excellent opportunity for new traders who want to learn to trade in a syste
FX28 Trader
Tsvetan Tsvetanov
5 (1)
FX28 Trader Dashboardをご紹介します - あなたの究極のトレードマネージャー FX28 Trader Dashboardは、あなたの外国為替(Forex)取引を新たな高みに押し上げるために設計された包括的で直感的なトレードマネージャーです。経験豊富なトレーダーでも、まだ金融の旅を始めたばかりの方でも、この強力なツールは取引活動を効率化し、意思決定プロセスを向上させるために開発されました。 主な特徴: ユーザーフレンドリーなインターフェース: FX28 Trader Dashboardは、あらゆるレベルのトレーダーに適したユーザーフレンドリーなインターフェースを備えています。さまざまな機能やツールを簡単にナビゲートし、わずか数クリックでトレードを完全にコントロールできます。 リアルタイムマーケットデータ: リアルタイムのマーケットデータフィードで先を見越してください。通貨ペア、トレンド、マーケットの変動に関する最新の情報を提供し、情報を元に自信を持ってトレードを実行できます。 高度なトレードアナリティクス: FX28 Trader Dashboardでは、高度なアナ
Pivots Points are significant levels traders can use to determine directional movement, support and resistance. Pivot Points use the prior period's high, low and close to formulate future support and resistance. In this regard, Pivot Points are predictive and leading indicators. Pivot Points were originally used by floor traders to set key levels. Floor traders are the original day traders. They deal in a very fast moving environment with a short-term focus. At the beginning of the trading day,
Custom Pivots
Tsvetan Tsvetanov
4 (4)
Pivots Points are significant levels traders can use to determine directional movement, support and resistance. Pivot Points use the prior period's high, low and close to formulate future support and resistance. In this regard, Pivot Points are predictive and leading indicators. Pivot Points were originally used by floor traders to set key levels. Floor traders are the original day traders. They deal in a very fast moving environment with a short-term focus. At the beginning of the trading day,
The Dynamic Fibonacci Grid Dashboard ( DFG-360 ) is a multi functional trading app designed for work primarily in the Forex market. The app combines several modules and tools into one complete trading system. The unique interface of the app is optimized for active day trading, scalping, news trading, short term trend following as well as counter trend and grid trading. Main features Advanced Multi Time Frame and Multi Market analysis. Quick and efficient position management. Semi-Automated tra
Custom Market Watch
Tsvetan Tsvetanov
3.33 (3)
The Custom Market Watch ( CMW ) is a professional grade trading application which allows you to operate effortlessly with large number of symbols and multiple open positions simultaneously from one chart. The Custom Market Watch shows the most essential daily technical information for each symbol in combination with very simple and easy to use trading interface where you can monitor the net exposure for each symbol and you can open and close positions with one click. The app is automatically syn
This indicator shows the current RSI values for multiple symbols and multiple timeframes and allows you to switch between timeframes and symbols with one click directly from the matrix. With this indicator, you can analyze large number of symbols across multiple timeframes and detect the strongest trends in just a few seconds. Features Shows RSI values for multiple symbols and timeframes simultaneously. Colored cells with progressive color intensity depending on the RSI values. Ability to chan
This indicator is using the Central Limit Theorem in combination with historical volatility and Fibonacci ratios in order to create unique type of chart tool called Projected Volatility Distribution. This tool allows you to perform highly accurate intraday technical analysis where in a split second you can detect overbought and oversold conditions as well as strong trends. In addition you have at your disposal multi-functional panel which shows signals in real time and gives you the ability to o
SDX is our latest and most advanced dashboard for manual trading. The app is based on our proven grid platform and offers unique trading opportunities for both experienced and new traders. This unique combination of innovative tools is designed to simplify the trading process and to give you real advantage. The system is ideal for short term trend following, counter-trend trading and scalping on the Forex market. Main Features Ability to work simultaneously with 10 pairs from one screen. Abili
This indicator displays Bollinger Bands signals for multiple symbols and multiple time frames. The signals are created as a simple ratios which represent the distance between the current price and the moving average measured in standard deviations. This way we create a very versatile and easy to use indicator which helps us to identify not only the strongest trends but also the most overbought and oversold conditions. Features Accurate signals in real time for multiple time frames and multiple
This indicator is based on the classic Pivot Points concept combined with additional optimizations and advanced features.  The levels of support and resistance are calculated by taking into account the average historical volatility.  The added multi-symbol scanner allows you to detect the best conditions and trade setups.  You can see in real time the current situation for all of your favorite symbols and you can switch the chart to any symbol with one click. The build in alert system allows you
This indicator allows you to analyze the hidden trends and correlations between the 8 most traded currencies via unique strength meter which creates multiple charts in a single window based on the price action of each currency in relation to all other currencies. The indicator also includes interactive panel where you can see the trends for all 28 pairs as well as the distance to the highest and the lowest price for the selected period. With this panel you can switch between currency pairs with
This indicator shows the current RSI values for multiple symbols and multiple timeframes and allows you to switch between timeframes and symbols with one click directly from the matrix. With this indicator, you can analyze large number of symbols across multiple timeframes and detect the strongest trends in just a few seconds. Features Shows RSI values for multiple symbols and timeframes simultaneously. Colored cells with progressive color intensity depending on the RSI values. Ability to chan
FX28 Trader Dashboardをご紹介します - あなたの究極のトレードマネージャー FX28 Trader Dashboardは、あなたの外国為替(Forex)取引を新たな高みに押し上げるために設計された包括的で直感的なトレードマネージャーです。経験豊富なトレーダーでも、まだ金融の旅を始めたばかりの方でも、この強力なツールは取引活動を効率化し、意思決定プロセスを向上させるために開発されました。 主な特徴: ユーザーフレンドリーなインターフェース: FX28 Trader Dashboardは、あらゆるレベルのトレーダーに適したユーザーフレンドリーなインターフェースを備えています。さまざまな機能やツールを簡単にナビゲートし、わずか数クリックでトレードを完全にコントロールできます。 リアルタイムマーケットデータ: リアルタイムのマーケットデータフィードで先を見越してください。通貨ペア、トレンド、マーケットの変動に関する最新の情報を提供し、情報を元に自信を持ってトレードを実行できます。 高度なトレードアナリティクス: FX28 Trader Dashboardでは、高度なアナ
フィルタ:
Gavin Rissetto
283
Gavin Rissetto 2022.08.19 05:00 
 

A handy tool very useful

topline8000
1144
topline8000 2022.05.03 14:35 
 

BEST YET

sunnychow
8902
sunnychow 2018.11.25 08:31 
 

User didn't leave any comment on rating.

レビューに返信