Horizontal Channel Alert with Custom Fibo
- インディケータ
- Yurij Izyumov
- バージョン: 1.91
- アップデート済み: 11 7月 2022
- アクティベーション: 20
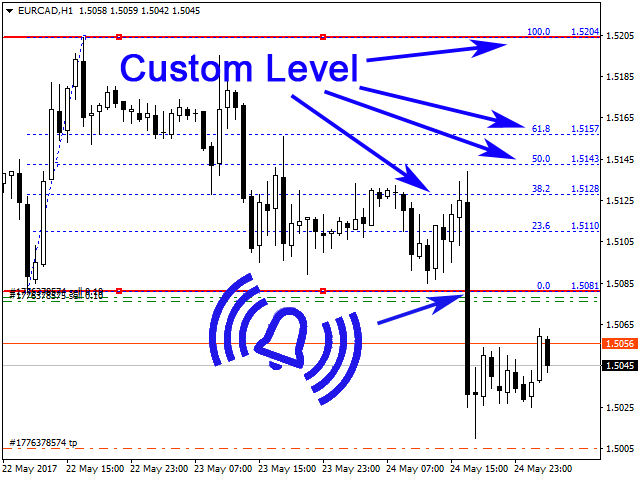
The indicator trades during horizontal channel breakthroughs. It searches for prices exceeding extreme points or bouncing back, monitors night flat and defines targets using customizable Fibo levels with a sound alert, which can be disabled if necessary.
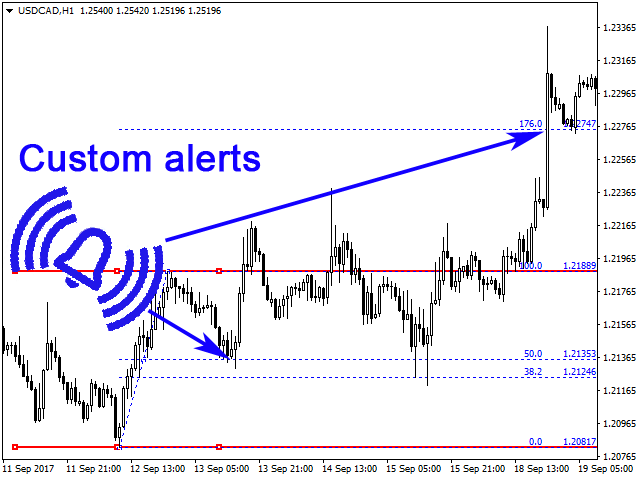
The indicator allows you to create a horizontal channel between the necessary extreme points in visual mode quickly and easily. It automatically applies your selected Fibo levels to these extreme points (if the appropriate option is enabled in the settings). Besides, when one of the Fibo levels enabled in settings is exceeded, the indicator activates a sound alert and shows a message or sends a push notification to your mobile terminal (if the appropriate option is enabled in the settings). It is possible to monitor the market using the Fibonacci levels for semiautomatic search for a rebound, as well as to reverse the levels.
Now it is also possible to automatically build night flat levels in the time specified in settings, for example from 11:00 pm to 9:00 am. Levels are automatically moved to the next day.
Version for MetaTrader 5: https://www.mql5.com/en/market/product/18855.
Horizontal Channel Alert with Custom Fibo is able to plot channels both at High/Low and Open/Close prices. The channel is automatically attached to prices. The channel area (Channel Length) can be expanded or reduced directly on a chart. It is also possible to draw horizontal and Fibo levels successively on timeframes that you need without erasing the levels of the previous timeframes.
Important!
- To move the channel to the left or right without changing its size, drag the central segment of the channel's upper or lower part.
- To lengthen or shorten the channel, drag the left or right edge of its top or bottom part to the desired location and release the line.
- If you drag the channel edge and the line is visually distorted, simply click anywhere on the chart to straighten the channel and the Fibo levels.
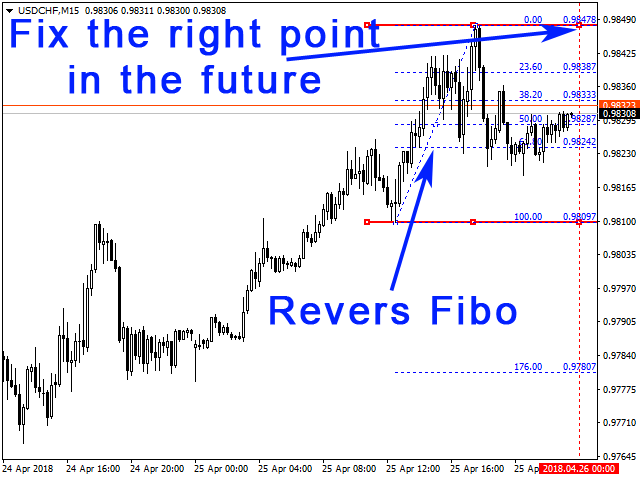
- If it is necessary to reverse the grid of Fibonacci levels, enable the Reverse Fibo option.
- To capture the rebounds of currency pair movements automatically, enable both options - Reverse Fibo and Fix the right point in the future.
- If you enable sending Push notifications, setting a high for Limit Alerts or removing its limit is not recommended, as numerous push notifications sent from one address may lead to further notifications being disabled by the MetaTrader service.
- "Auto build Fibo by time range" and "Fix the right point in the future" cannot be used together!
Settings
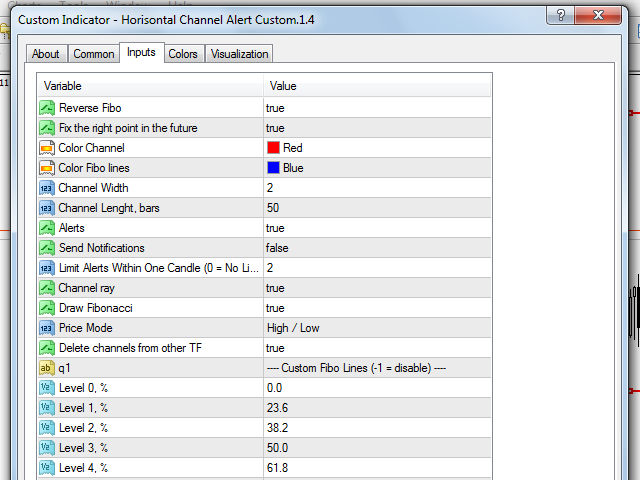
- Reverse Fibo - deploy the grid of Fibonacci levels.
- Fix the right point in the future - fix the right point of the levels in the future area. With each new candle, the right point will be shifted forward in time.
- Auto build Fibo by time range - Fibonacci lines are built simultaneously in the time interval for monitoring the night flat. Time range must be specified correctly.
- Time range - time interval.
- Color Channel - horizontal channel color;
- Color Fibo lines - color of Fibonacci lines;
- Channel Width - horizontal channel line width;
- Channel Length, bars - channel length (default - in bars);
- Alerts – enable/disable all sound alerts;
- Send Notifications - enable/disable sending push notifications to your mobile terminal. Make sure to configure MetaQuotes ID in the terminal settings (details);
- Limit Alerts - limit the number of signals on one candle. After reaching the limit, the signals are stopped. To remove the limits, set = 0;
- Channel ray - plot the channel as rays;
- Draw Fibonacci - attach Fibo levels to the channel automatically;
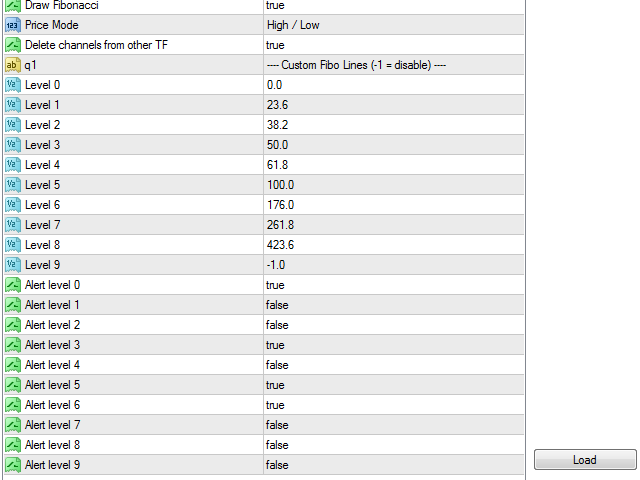
- Price Mode - channel plotting mode: High/Low or Open/Close;
- Delete channels from other TF - delete channels and Fibo levels of the previous timeframe when switching to another one.
- Custom Fibo Lines (-1 = disable) - below are settings of 10 levels: to disable a level set it to = -1.
- Level 0..... Level 9 - numerical values of levels in percentage, for example 0 or 176.
- Alert level 0..... Alert level 9 - enable/disable sound alerts to notify of intersection of the specified levels.
- Level 0 name..... Level 9 name - names for levels.
If Delete channels from other TF=false, previous channels remain, while the new one is added to a selected timeframe when switching timeframes. If Delete channels from other TF=true (default), previous channels are removed and the new one is plotted on a new timeframe during the timeframes switching.

Just bought looks good, but 1 request Author please check comment can you please add option to allow us set the width of the Fibo line so we can increase the width to make it into a zone, because sometime price very close almost touching the fibo level line but the line very thin, we need to adjust increase the width so that it will touch the fibo line and send us alert, please help add this fibo width option ok please?