ACB Trade Filter MT4
- インディケータ
- KEENBASE SOFTWARE SOLUTIONS
- バージョン: 2.1
- アップデート済み: 31 10月 2018
- アクティベーション: 5
The ACB Trade Filter indicator provides a solution for filtering out the low probability trading setups in a trading strategy. The indicator uses a sophisticated filtration algorithm based on the market sentiment and trend.
Applications
- Works great with our indicator "ACB Breakout Arrows".
- Filter out low probability signals from any indicator.
- Avoid overtrading and minimize the losses.
- Trade in the direction of market sentiment and trend.
- Avoid the choppiness in the market.
How to use
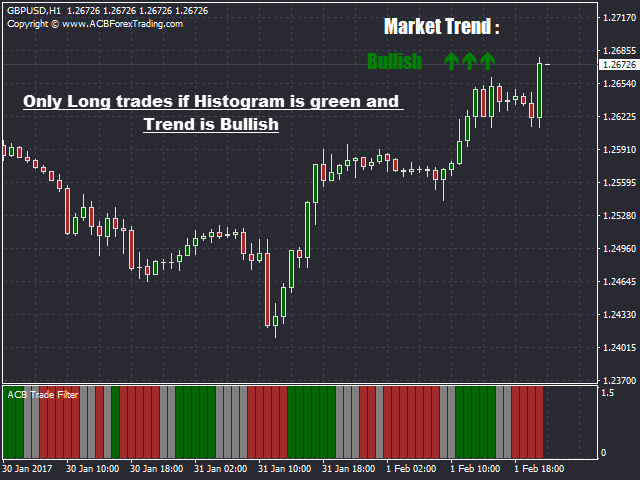
- Only Long Trades if Histogram is green and Trend is bullish.
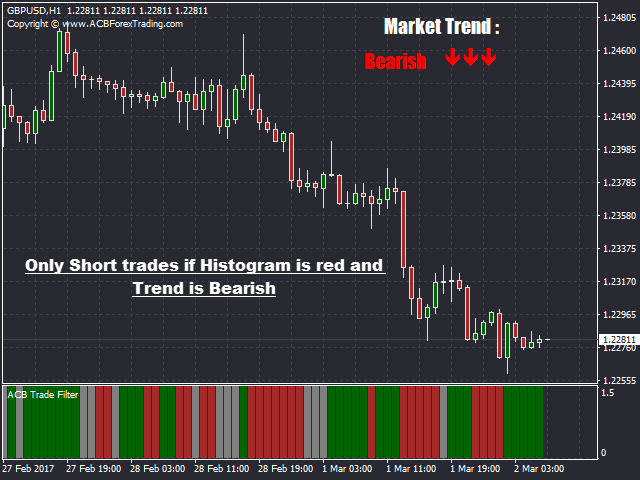
- Only Short Trades if Histogram is red and Trend is bearish.
- Avoid trading if the Histogram is gray or Trend is sideways.
Input Parameters
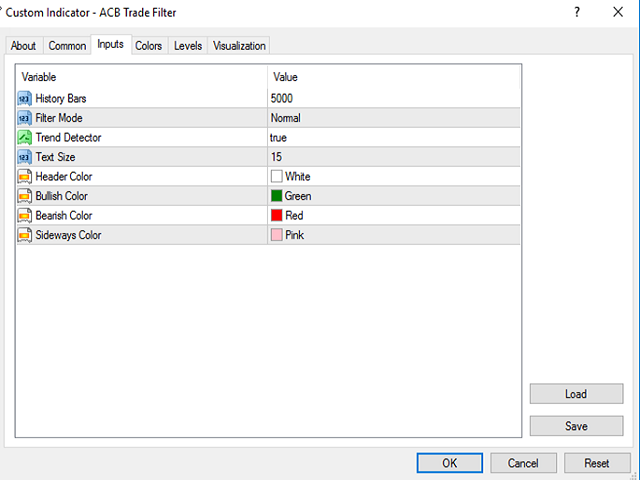
- History Bars: The no. of bars on the chart to consider for indicator's data and calculation.
- Filter mode: Normal filtration or Hard filtration.
- Trend Detector: Show/Hide the trend direction.
- Trend_Corner: Chart corner to display the trend direction.
For EA developers
Use the following code to import this indicator into your EA.
#define val 1.5

// Reading the histogram

if(iCustom(NULL,0,"Market/ACB Trade Filter",0,1)==val) // Histogram is green
if(iCustom(NULL,0,"Market/ACB Trade Filter",1,1)==val) // Histogram is red
if(iCustom(NULL,0,"Market/ACB Trade Filter",2,1)==val) // Histogram is gray

// Reading the trend direction

if(iCustom(NULL,0,"Market/ACB Trade Filter",3,1)==1) // Trend is bullish
if(iCustom(NULL,0,"Market/ACB Trade Filter",3,1)==-1) // Trend is Bearish
if(iCustom(NULL,0,"Market/ACB Trade Filter",3,1)==0) // Trend is Sideways


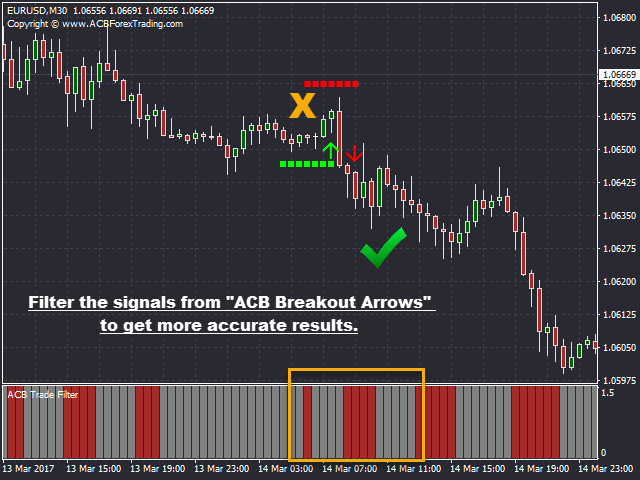


A must have indicator to filter out bad signals from any entry indicator specially the ACB Breakout Arrows.