AURUM Chart Patterns
- インディケータ
-
Pieter Van Aswegen
 I am an investment risk professional with over 15 years of experience in global financial markets, specialising in risk management, portfolio analytics, and systematic trading oversight. My work has focused on developing quantitative models, stress testing, and governance frameworks to strengthen
- バージョン: 1.1
- アクティベーション: 20
AURUM Chart Patterns (XAUUSD)
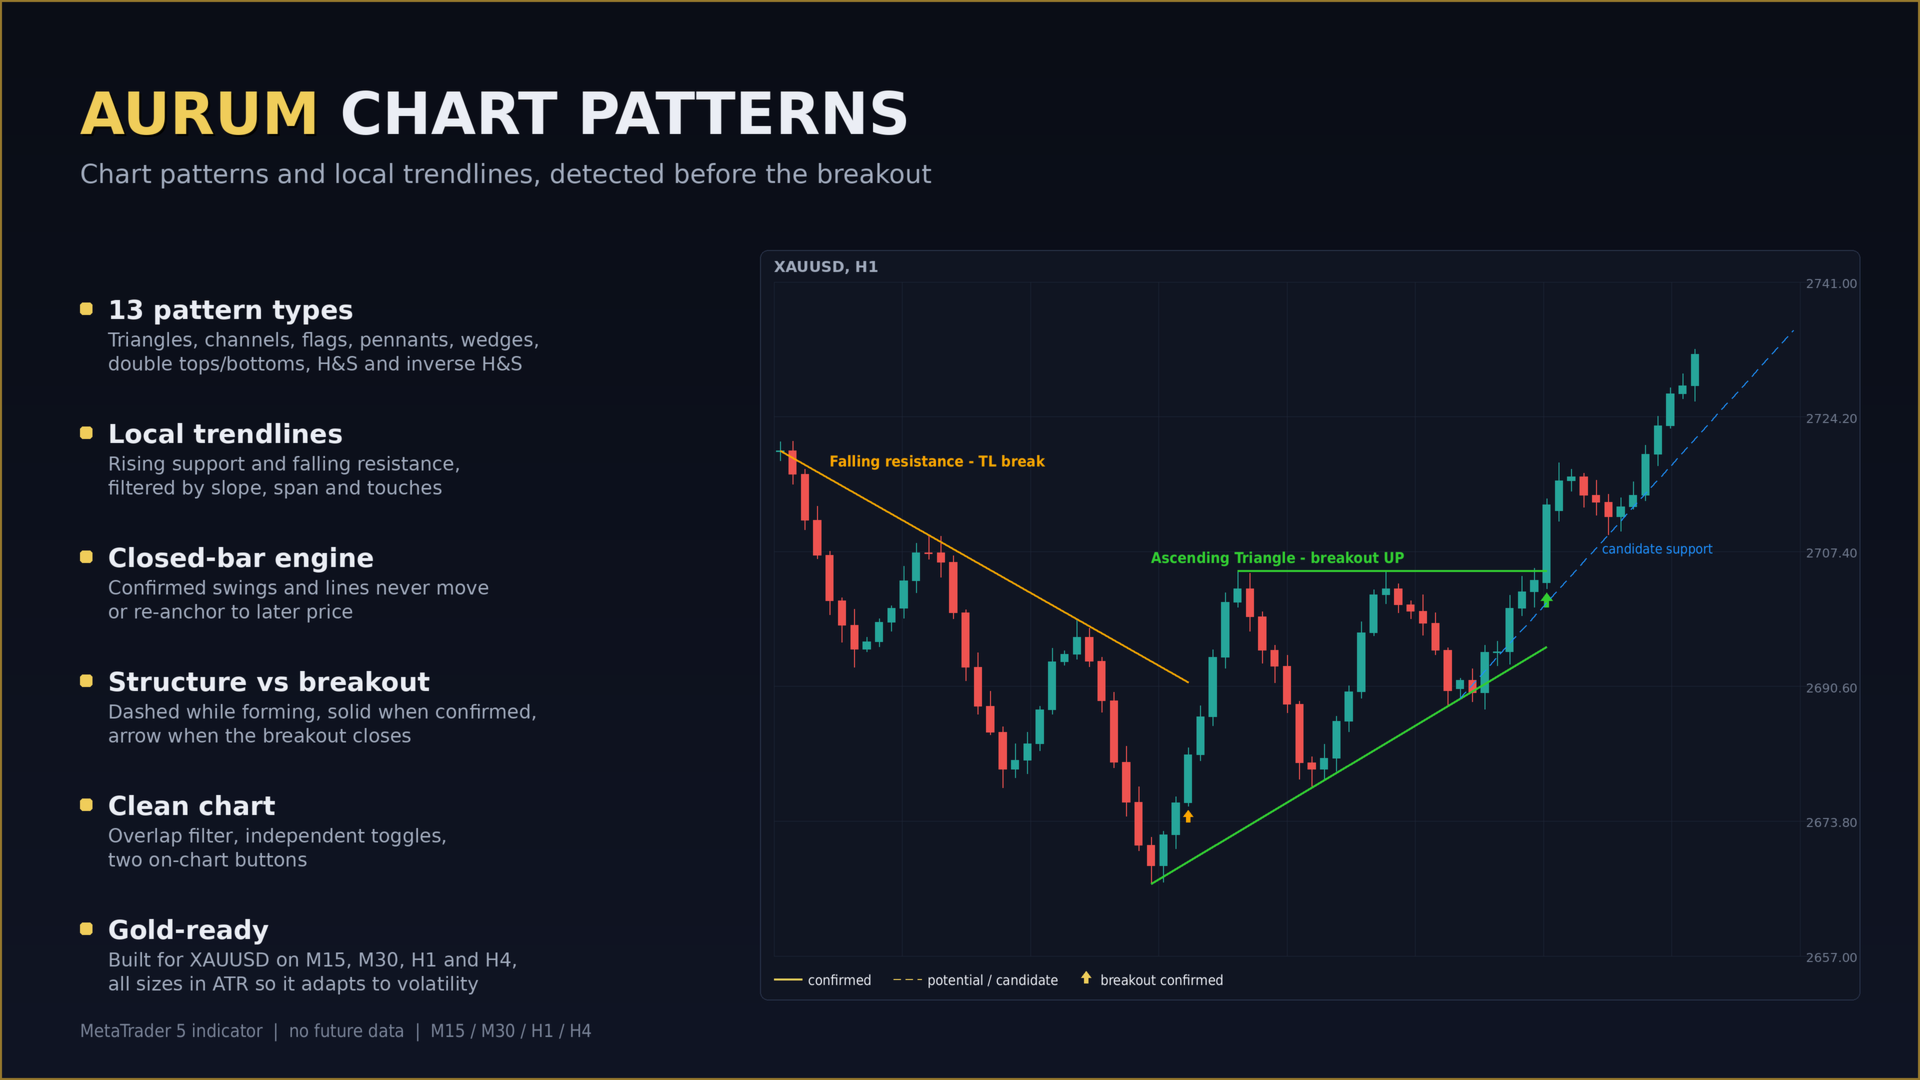
Chart pattern and local trendline indicator for gold. It finds 13 classic patterns and draws rising support and falling resistance lines while they are still forming, before the breakout. Confirmed swing points and lines are fixed and never move to fit later price.
[Please leave a review if you find the indicator useful and how we can improve it further]Patterns (each with its own on/off switch)
- Ascending, descending and symmetrical triangles
- Ascending and descending channels
- Bull and bear flags
- Bull and bear pennants
- Rising and falling wedges
- Double tops and double bottoms
- Head and shoulders and inverse head and shoulders
Local Trendlines
- Rising support through progressively higher swing lows
- Falling resistance through progressively lower swing highs
- Lines extend to the right until price breaks them
- Price between the anchors must respect the line; small wick deviations are allowed
- Flat, short and duplicate lines are filtered out
- New lines keep being found as the market moves
No Future Data
- All logic runs on closed bars only, in time order
- A swing candidate needs 3 closed bars to its right (adjustable)
- A swing is fixed once price moves 1 ATR away from it (adjustable)
- A developing swing may still extend; a confirmed swing never moves
- Broken or invalidated lines are never repositioned
- A pattern that had already broken out before it could be confirmed is never added afterwards
Structure and Breakout, Shown Separately
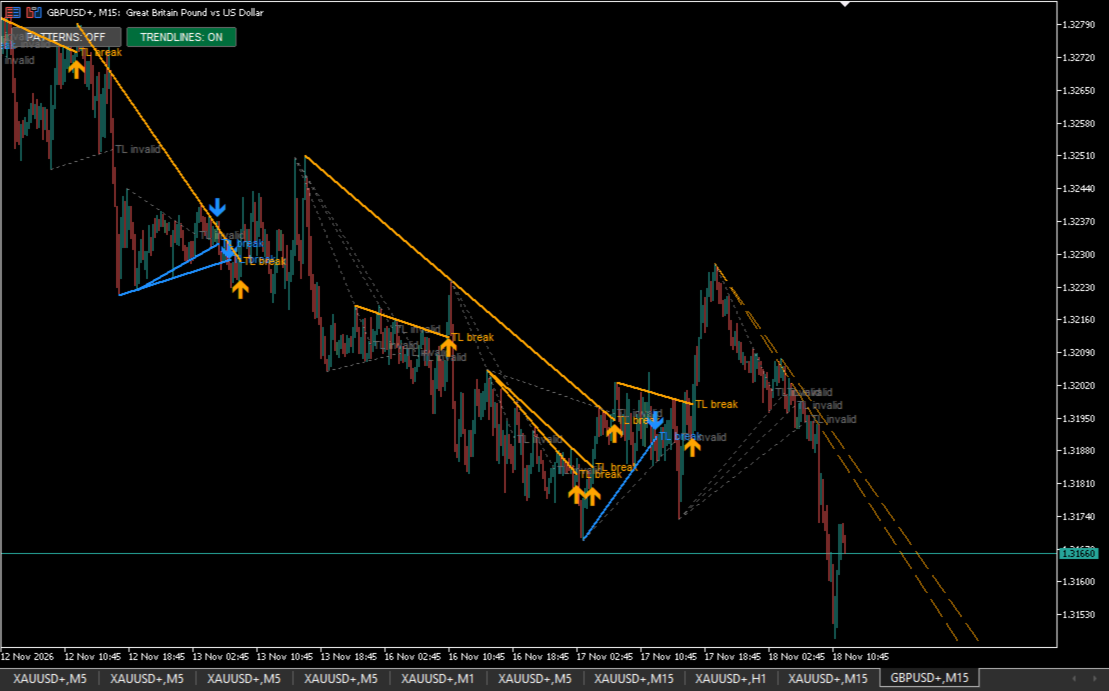
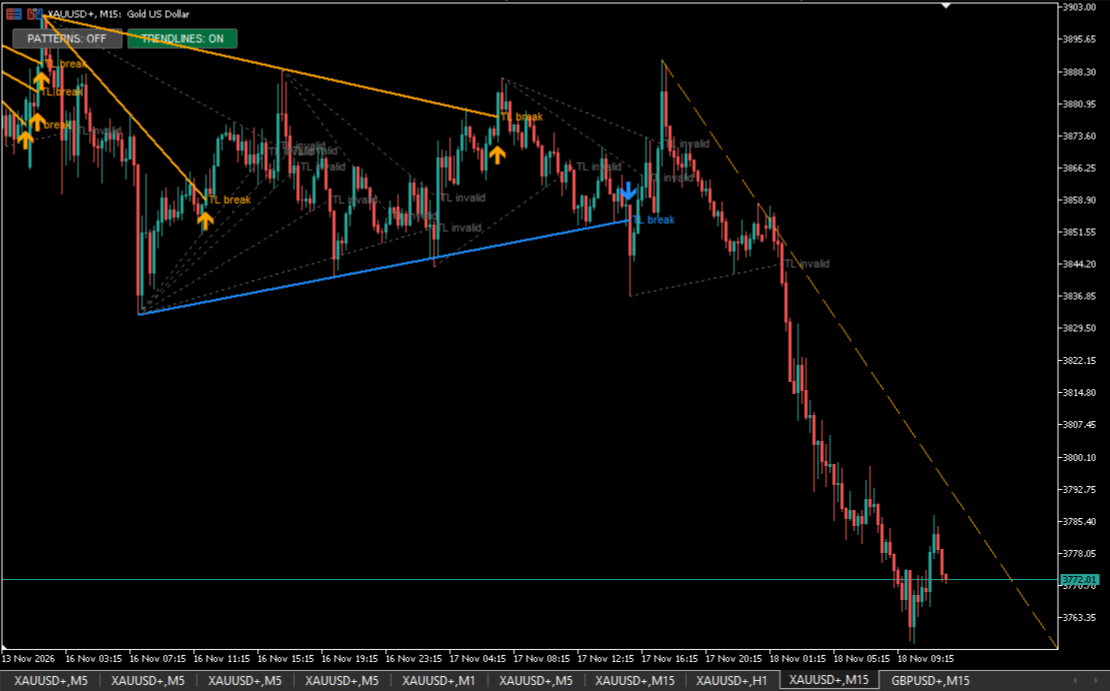
- Dashed lines: potential pattern or candidate trendline (still forming)
- Solid lines: structure confirmed
- Arrow and label: breakout confirmed by a close beyond the line
- Lines stop extending at the breakout bar
- Invalidated structures stay on the chart in grey with a label, or are hidden (your choice)
- Triangles and wedges that reach the apex without a breakout are marked invalid
Clean Chart
- Multiple patterns can coexist
- Overlap filter removes duplicate and heavily overlapping results
- Limits on active trendlines per side and patterns kept on the chart
- Two on-chart buttons: PATTERNS and TRENDLINES show or hide each group with one click
- Buttons scale with screen DPI
Adapts to Volatility
Every size is measured in ATR: swing size, price tolerance, breakout distance and trendline slope. Slope is measured in ATR per 10 bars, so detection does not depend on chart zoom.
Timeframes
Designed for XAUUSD on M15, M30, H1 and H4. Scans the last 1000 candles. Other timeframes and symbols can be switched on in the inputs.
Key Settings
- Sensitivity: bars left of a swing (5) and closed bars right to confirm (3)
- Minimum swing size: 1.0 ATR
- Pattern length: 12 to 250 bars
- Price tolerance: 0.25 ATR
- Breakout distance: 0.25 ATR beyond the line
- Trendline slope: 0.15 to 3.0 ATR per 10 bars
- Trendline span: 15 to 300 bars
- Touches to confirm a trendline: 3
- Flag pole: at least 3 ATR within 15 bars
How to Use
- Attach to an XAUUSD chart on M15, M30, H1 or H4.
- Dashed shapes show structures that are still forming. Watch them for a solid confirmation.
- An arrow marks a confirmed breakout. Use it with your own entry and risk rules.
- Use the PATTERNS and TRENDLINES buttons to declutter the chart.
The indicator does not trade and does not send alerts.
Risk Disclaimer
Trading involves substantial risk of loss. Chart patterns show structure, not certainty, and past behaviour does not guarantee future results. Use proper risk management.