ADX Multi Pair Timeframe Trend Scanner Dashboard
- インディケータ
- バージョン: 1.0
- アクティベーション: 5

ADX Multi Pair Timeframe Trend Scanner Dashboard
Overview:
ADX Scanner Dashboard Pro is a multi-symbol and multi-timeframe technical analysis indicator and market scanner designed for the MetaTrader 4 platform. The software continuously monitors Average Directional Index (ADX) directional movement across user-selected financial instruments and chart periods simultaneously. All detected trade setups, dynamic Average True Range (ATR) risk management levels, directional strength readings, and multi-indicator confluence statuses are consolidated into a single interactive on-chart table. By centralizing cross-market scanning into one terminal window, the tool eliminates the operational need to manually switch between dozens of individual charts while maintaining transparent, rule-based technical criteria.
Operating Principle and Signal Logic:
* Base Calculation Engine: The scanner utilizes the native MetaTrader 4 iADX algorithm to measure directional movement (+DI and -DI components) combined with the native iATR indicator to evaluate prevailing market volatility across historical price bars.
* Strict Non-Repainting Architecture: Signal evaluation strictly begins from Bar 1 (the most recently closed candlestick) and scans backward up to the user-defined lookback limit. Active unclosed candle data (Bar 0) is excluded from signal triggers. Once a valid signal is confirmed upon candle close, its signal timestamp, entry price reference, Stop Loss, and Take Profit coordinates remain permanently locked for that bar and do not repaint or shift retroactively.
* Bullish (BUY) Condition: A bullish setup is registered when the +DI line crosses above the user-specified threshold level on a closed bar, provided the directional mode permits long signals and all active secondary confirmation filters validate the setup.
* Bearish (SELL) Condition: A bearish setup is registered when the -DI line crosses above the user-specified threshold level on a closed bar, provided the directional mode permits short signals and all active secondary confirmation filters validate the setup.
* Dynamic ATR Risk and Target Levels: Upon signal validation, the indicator measures the ATR value at the signal bar and multiplies it by the configured Stop Loss factor to establish the baseline risk distance. Entry price is referenced at the closing price of the signal bar. Take Profit 1 (TP 1) and Take Profit 2 (TP 2) are automatically projected using configurable Risk-to-Reward (RR) multipliers relative to the calculated Stop Loss distance.
* Modular 15-Filter Confluence Framework: Traders can optionally activate any combination of 15 built-in technical filters (including RSI, secondary ADX trend strength, Single Moving Average, Double Moving Average, Ichimoku Senkou Span B, Awesome Oscillator, Parabolic SAR, Heiken Ashi, CCI, RVI, MACD, Support/Resistance zones, Fibonacci retracement zones, and ATR-based Supertrend). When multiple filters are enabled, a signal is displayed only when every active filter confirms alignment in the same trade direction.
Dashboard Table Structure and Interactive Controls:
* Column Definitions:
- PAIR: Displays the broker symbol name where the signal was detected.
- TF: Displays the chart timeframe of the detected setup (such as M5, M15, M30, H1, H4).
- DIR: Indicates the confirmed trade direction (BUY in green or SELL in red).
- TIME: Displays the exact broker server date and timestamp of the closed signal candle.
- ENTRY: Displays the reference entry price normalized to the symbol decimal digits.
- SL: Displays the ATR-derived Stop Loss price level.
- TP 1: Displays the first Risk-to-Reward Take Profit price target.
- TP 2: Displays the second Risk-to-Reward Take Profit price target.
- DI VAL: Displays the exact numerical reading of the triggering +DI or -DI line at signal confirmation.
- AGE: Displays the elapsed time since the signal candle closed, formatted dynamically in seconds (s), minutes (m), hours (h), or days (d).
- OPEN Button: Interactive action button on each valid signal row. Clicking OPEN switches the current chart symbol and timeframe directly to the selected signal and automatically renders the entry arrow and horizontal price levels.
* Header Control Buttons and Interactive Features:
- REFRESH Button: Forces an immediate full re-scan across all configured symbols and timeframes, reloading Market Watch lists and updating active filter states.
- CLEAR Button: Removes dashboard graphical objects from the chart interface when a clean chart view is needed.
- MIN / MAX Button: Collapses the full table into a compact title status bar to preserve chart workspace, or expands it back to full view.
- Interactive Column Sorting: Clicking the PAIR, TF, DIR, or TIME column headers dynamically sorts the displayed signal rows in ascending or descending order.
- Drag-and-Drop Positioning and State Persistence: Users can click and drag the dashboard header bar anywhere across the chart window. The panel X/Y coordinates and minimized state are saved in MetaTrader Global Variables so layout preferences persist across timeframe changes.
Key Technical Features:
* Simultaneous Multi-Pair and Multi-Timeframe scanning engine operating on a configurable timer interval independent of incoming tick frequency.
* Automatic symbol list loading from either the MT4 Market Watch window or a custom comma-separated symbol list.
* Automated on-chart visual plotting featuring directional Wingdings entry arrows and horizontal trendline projections with text labels for Entry, SL, TP 1, and TP 2.
* Comprehensive multi-channel alert manager supporting terminal pop-up dialogs, custom WAV sound playback, MetaQuotes ID mobile push notifications, and SMTP email alerts with duplicate-alert suppression per bar.
* DPI and screen resolution scaling control allowing proportional resizing of panel dimensions, row heights, and fonts from 70% to 180%.
Operation and Setup Recommendations:
* Supported Instruments: Compatible with all major, minor, and exotic Forex pairs, precious metals (such as XAUUSD and XAGUSD), equity indices, energies, and CFDs available in the broker Market Watch.
* Recommended Timeframes: Adaptable across intraday scalping timeframes (M1, M5), day trading timeframes (M15, M30, H1), and swing trading timeframes (H4, D1).
* Historical Data Synchronization: Because multi-pair scanners read price arrays from background symbols and timeframes, ensure that historical chart data is downloaded in your MT4 terminal (via Tools -> History Center or by opening the target charts briefly) so at least 100 bars are available per scanned timeframe.
* CPU and Memory Management: Scanning a large matrix of symbols and timeframes consumes terminal CPU cycles during each timer update. To maintain smooth platform performance on standard hardware, keep InpMaxSymbols between 10 and 20, set InpBarsCopy between 100 and 150, and set InpScanSec to 5 seconds or higher. Avoid running multiple heavy scanner instances on separate charts simultaneously.
* Interface Color Guide: Green labels and arrows denote bullish BUY setups and Take Profit levels; red labels and arrows denote bearish SELL setups and Stop Loss levels; blue accents denote entry price lines, active sort headers, and primary interface titles; neutral gray text denotes secondary metadata and inactive rows.
Input Parameters Documentation:
[1.1] Scanner Configuration:
* InpSymbols (Default: "EURUSD,GBPUSD,USDJPY,AUDUSD,USDCAD,USDCHF,NZDUSD,EURJPY,GBPJPY,XAUUSD") - Comma-separated list of instrument tickers scanned when InpUseWatch is set to false (automatically appends or matches broker symbol names present in Market Watch).
* InpTimeframes (Default: "M5,M15,M30,H1,H4") - Comma-separated list of timeframes evaluated for each symbol (supports M1, M5, M15, M30, H1, H4, D1, W1, MN1).
* InpUseWatch (Default: true) - When true, automatically scans all visible symbols currently listed in the MT4 Market Watch window up to InpMaxSymbols.
* InpMaxSymbols (Default: 15) - Upper limit on the total number of symbols loaded into the scanner matrix to control CPU load.
* InpScanSec (Default: 7) - Timer refresh interval in seconds between consecutive background market scans (minimum enforced value is 3 seconds).
* InpBarsCopy (Default: 100) - Number of historical bars copied per symbol and timeframe for indicator and filter buffer calculation (minimum 30 bars required).
* InpLookback (Default: 60) - Maximum number of closed bars searched backward from Bar 1 to find the most recent valid signal.
* InpDirection (Default: 0) - Global signal direction filter (0 = Both BUY and SELL signals, 1 = BUY signals only, 2 = SELL signals only).
[1.2] ADX Entry Signal Logic:
* InpADXPeriod (Default: 5) - Averaging period in bars used by the native MT4 ADX indicator for +DI and -DI calculation.
* InpADXLevel (Default: 25.0) - Threshold level that +DI (for BUY) or -DI (for SELL) must cross above on a closed bar to trigger a primary signal.
[1.3] ATR SL and TP Settings:
* InpATRPeriod (Default: 14) - Averaging period in bars for the ATR volatility indicator used in risk distance calculation.
* InpATRMultSL (Default: 1.5) - Multiplier applied to the ATR value to calculate the Stop Loss distance from the entry price.
* InpTP1_RR (Default: 1.0) - Risk-to-Reward ratio multiplier relative to Stop Loss distance for calculating Take Profit 1 (1.0 equals 1:1 RR).
* InpTP2_RR (Default: 2.0) - Risk-to-Reward ratio multiplier relative to Stop Loss distance for calculating Take Profit 2 (2.0 equals 1:2 RR).
[2.1] Alerts and Notifications:
* InpAlertPopup (Default: false) - Enables or disables standard MetaTrader desktop pop-up alert windows when a signal is detected.
* InpAlertSound (Default: false) - Enables or disables audible WAV sound alerts on signal detection.
* InpSoundFile (Default: "alert2.wav") - Name of the audio file located inside the MetaTrader 4 Sounds folder.
* InpAlertPush (Default: false) - Enables or disables push notifications sent to the mobile MetaTrader app via MetaQuotes ID.
* InpAlertEmail (Default: false) - Enables or disables email notifications sent through the terminal configured SMTP server.
* InpEmailSubject (Default: "ADX Scanner Signal") - Custom subject line prefix for outgoing alert emails.
* InpAlertOnlyNew (Default: true) - When true, triggers alerts strictly for signals occurring on newer closed bars than the previous alert per symbol/timeframe slot.
[2.2] Display and UI Position:
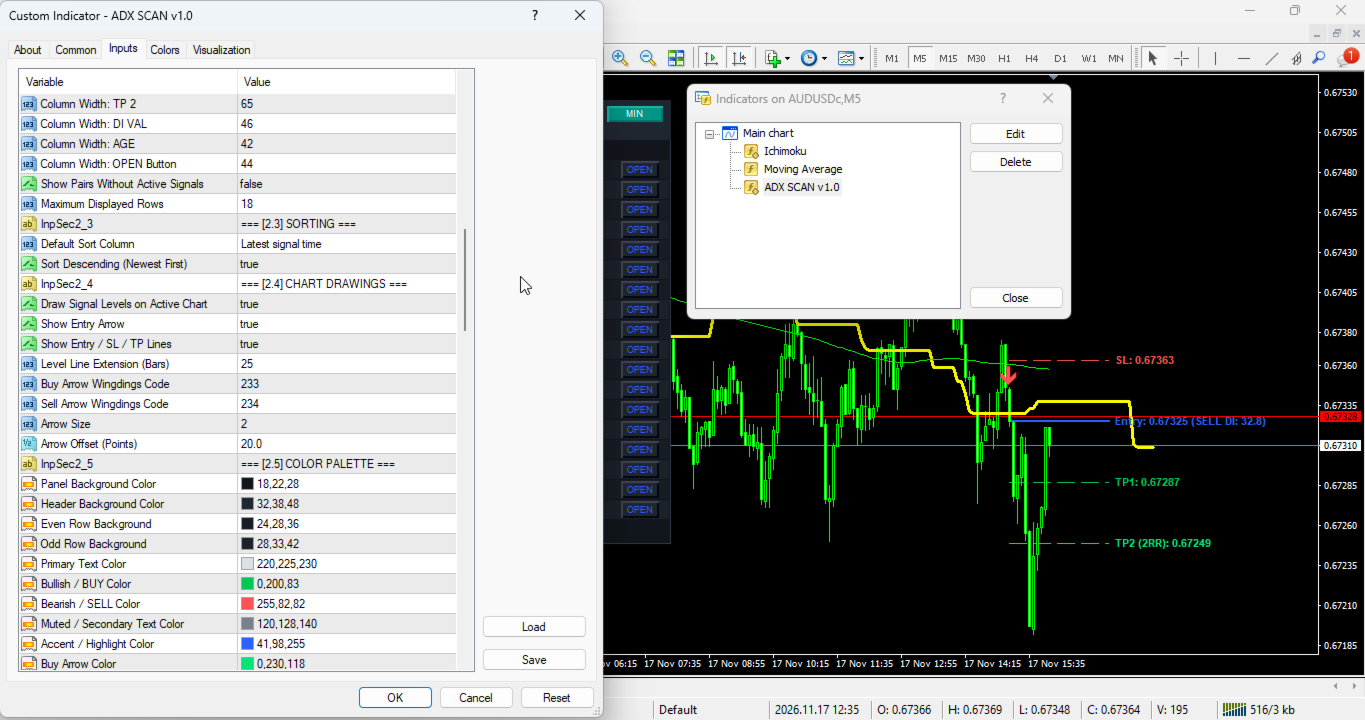
* InpX (Default: 15) - Default horizontal distance in pixels from the upper-left corner of the chart to the dashboard panel.
* InpY (Default: 25) - Default vertical distance in pixels from the upper-left corner of the chart to the dashboard panel.
* InpScale (Default: 100) - Overall UI scaling factor in percent (clamped between 70% and 180% for high-DPI displays).
* InpRowH (Default: 20) - Base height of each signal table row in pixels.
* InpFont (Default: 8) - Base font size in points for dashboard text elements.
* InpPadX (Default: 8) - Horizontal inner margin padding in pixels on the left and right sides of the table.
* InpWPair (Default: 68) - Width in pixels allocated to the PAIR symbol column.
* InpWTF (Default: 36) - Width in pixels allocated to the TF timeframe column.
* InpWArah (Default: 44) - Width in pixels allocated to the DIR direction column.
* InpWTime (Default: 95) - Width in pixels allocated to the TIME signal timestamp column.
* InpWEntry (Default: 65) - Width in pixels allocated to the ENTRY price column.
* InpWSL (Default: 65) - Width in pixels allocated to the SL Stop Loss price column.
* InpWTP1 (Default: 65) - Width in pixels allocated to the TP 1 target price column.
* InpWTP2 (Default: 65) - Width in pixels allocated to the TP 2 target price column.
* InpWVal (Default: 46) - Width in pixels allocated to the DI VAL numeric reading column.
* InpWUmur (Default: 42) - Width in pixels allocated to the AGE signal duration column.
* InpWOpen (Default: 44) - Width in pixels allocated to the interactive OPEN button column.
* InpShowEmpty (Default: false) - When true, displays rows for scanned symbol/timeframe pairs even when no active signal is present.
* InpMaxRows (Default: 18) - Maximum number of rows rendered simultaneously in the dashboard table.
[2.3] Sorting:
* InpSortBy (Default: SORT_TIME) - Default column used for sorting signal rows (SORT_TIME = 0, SORT_PAIR = 1, SORT_TF = 2, SORT_DIR = 3).
* InpSortNewest (Default: true) - When true, sorts rows in descending order (most recent signals first).
[2.4] Chart Drawings:
* InpDrawOnChart (Default: true) - Master toggle to draw signal arrows and horizontal risk/reward lines on the active chart.
* InpShowArrow (Default: true) - Enables or disables plotting directional Wingdings arrows at the signal candle.
* InpShowLevels (Default: true) - Enables or disables plotting Entry, SL, TP 1, and TP 2 horizontal trendlines and price labels.
* InpExtendBars (Default: 25) - Number of chart bars to extend the horizontal Entry, SL, and TP lines to the right of the signal candle.
* InpArrowCodeBuy (Default: 233) - Wingdings character code used for bullish BUY entry arrows.
* InpArrowCodeSell (Default: 234) - Wingdings character code used for bearish SELL entry arrows.
* InpArrowSize (Default: 2) - Visual size/width of plotted signal arrows.
* InpArrowDistance (Default: 20) - Vertical gap in broker points between the signal bar price and the plotted arrow.
[2.5] Color Palette:
* InpColBg (Default: C'18,22,28') - Background color of the main dashboard container.
* InpColHead (Default: C'32,38,48') - Background color of the top title bar and column header row.
* InpColRow (Default: C'24,28,36') - Background color for even-numbered signal rows.
* InpColRow2 (Default: C'28,33,42') - Background color for odd-numbered signal rows.
* InpColText (Default: C'220,225,230') - Primary foreground text color for symbols, timeframes, timestamps, and entry values.
* InpColBull (Default: C'0,200,83') - Text color for bullish BUY direction and DI strength values.
* InpColBear (Default: C'255,82,82') - Text color for bearish SELL direction and DI strength values.
* InpColMute (Default: C'120,128,140') - Muted gray color for status text, column headers, and footer hints.
* InpColAccent (Default: C'41,98,255') - Accent color for panel title, active sort indicator, and OPEN buttons.
* InpColArrowBuy (Default: C'0,230,118') - Color of bullish BUY arrows drawn on the price chart.
* InpColArrowSell (Default: C'255,82,82') - Color of bearish SELL arrows drawn on the price chart.
* InpColEntry (Default: C'41,98,255') - Color of the Entry price trendline and text label.
* InpColSL (Default: C'255,82,82') - Color of the Stop Loss trendline, text label, and dashboard SL column.
* InpColTP1 (Default: C'0,200,83') - Color of the Take Profit 1 trendline, text label, and dashboard TP 1 column.
* InpColTP2 (Default: C'0,230,118') - Color of the Take Profit 2 trendline, text label, and dashboard TP 2 column.
[3] Multi-Filter Suite Parameters:
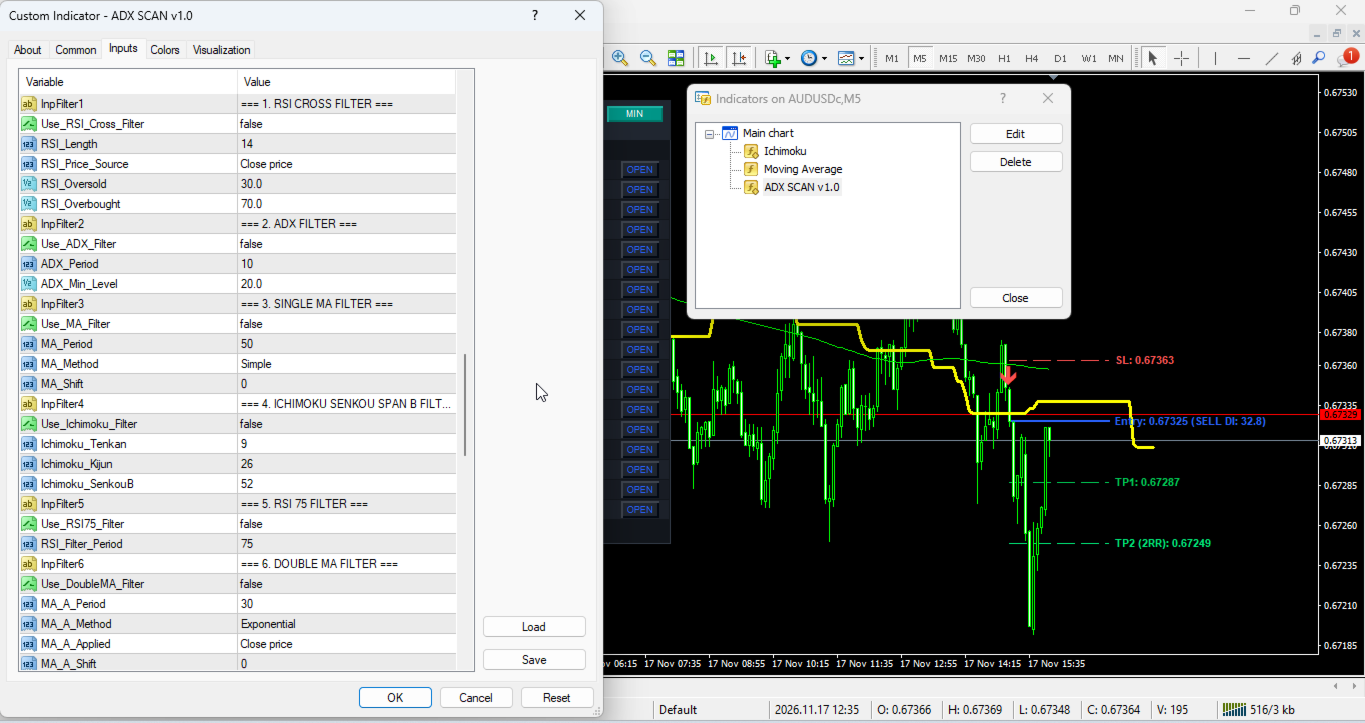
* Use_RSI_Cross_Filter (Default: false) - Enables Relative Strength Index threshold crossover confirmation.
* RSI_Length (Default: 14) - Averaging period in bars for the RSI crossover filter.
* RSI_Price_Source (Default: PRICE_CLOSE) - Applied candle price source for RSI calculation.
* RSI_Oversold (Default: 30.0) - Lower RSI threshold level used to validate bullish momentum recovery.
* RSI_Overbought (Default: 70.0) - Upper RSI threshold level used to validate bearish momentum reversal.
* Use_ADX_Filter (Default: false) - Enables secondary ADX main line trend strength validation.
* ADX_Period (Default: 10) - Averaging period in bars for the secondary ADX filter.
* ADX_Min_Level (Default: 20.0) - Minimum main ADX value required to confirm active trend strength.
* Use_MA_Filter (Default: false) - Enables Single Moving Average price-position trend filter.
* MA_Period (Default: 50) - Averaging period in bars for the Single Moving Average.
* MA_Method (Default: MODE_SMA) - Moving Average smoothing method (SMA, EMA, SMMA, LWMA).
* MA_Shift (Default: 0) - Horizontal bar shift applied to the Single Moving Average.
* Use_Ichimoku_Filter (Default: false) - Enables Ichimoku Kinko Hyo Senkou Span B cloud boundary trend filter.
* Ichimoku_Tenkan (Default: 9) - Tenkan-sen conversion line period in bars.
* Ichimoku_Kijun (Default: 26) - Kijun-sen base line period in bars.
* Ichimoku_SenkouB (Default: 52) - Senkou Span B leading span period in bars.
* Use_RSI75_Filter (Default: false) - Enables long-period RSI 50-midline directional bias filter.
* RSI_Filter_Period (Default: 75) - Averaging period in bars for the long-period RSI filter.
* Use_DoubleMA_Filter (Default: false) - Enables fast-versus-slow Moving Average trend alignment filter.
* MA_A_Period (Default: 30) - Averaging period in bars for fast Moving Average A.
* MA_A_Method (Default: MODE_EMA) - Smoothing method for fast Moving Average A.
* MA_A_Applied (Default: PRICE_CLOSE) - Applied price type for fast Moving Average A.
* MA_A_Shift (Default: 0) - Horizontal bar shift for fast Moving Average A.
* MA_B_Period (Default: 140) - Averaging period in bars for slow Moving Average B.
* MA_B_Method (Default: MODE_EMA) - Smoothing method for slow Moving Average B.
* MA_B_Applied (Default: PRICE_CLOSE) - Applied price type for slow Moving Average B.
* MA_B_Shift (Default: 0) - Horizontal bar shift for slow Moving Average B.
* Use_AO_Filter (Default: false) - Enables Bill Williams Awesome Oscillator (AO) momentum filter.
* Use_AO_Volume_Filter (Default: false) - Requires AO value to exceed user-defined positive or negative amplitude limits.
* AO_Buy_Min (Default: 4.0) - Minimum positive AO reading required for bullish confirmation.
* AO_Sell_Max (Default: -4.0) - Maximum negative AO reading required for bearish confirmation.
* Use_AO_Color_Filter (Default: false) - Requires bar-over-bar AO histogram slope alignment in the signal direction.
* Use_AO_Zero_Filter (Default: false) - Requires AO histogram to be positioned above zero for BUY or below zero for SELL.
* Use_SAR_Filter (Default: false) - Enables Parabolic SAR trailing trend direction filter.
* SAR_Step (Default: 0.02) - Acceleration factor step increment for Parabolic SAR.
* SAR_Maximum (Default: 0.2) - Maximum acceleration factor ceiling for Parabolic SAR.
* Use_HeikenAshi_Filter (Default: false) - Enables smoothed Heiken Ashi candle body polarity filter.
* Use_CCI_Filter (Default: false) - Enables Commodity Channel Index (CCI) zero-line directional filter.
* CCI_Period (Default: 50) - Averaging period in bars for the trend CCI filter.
* CCI_Applied (Default: PRICE_CLOSE) - Applied price type for the trend CCI filter.
* Use_CCI_OBOS_Filter (Default: false) - Enables CCI momentum breakout threshold filter.
* CCI_OBOS_Period (Default: 14) - Averaging period in bars for the OB/OS CCI filter.
* CCI_OBOS_Applied (Default: PRICE_CLOSE) - Applied price type for the OB/OS CCI filter.
* CCI_Overbought (Default: 100.0) - Upper CCI threshold level for bullish momentum breakout.
* CCI_Oversold (Default: -100.0) - Lower CCI threshold level for bearish momentum breakout.
* Use_RVI_Filter (Default: false) - Enables Relative Vigor Index (RVI) zero-line directional filter.
* RVI_Period (Default: 75) - Averaging period in bars for the main RVI trend filter.
* Use_RVI_Signal_Filter (Default: false) - Enables RVI main-line versus signal-line crossover alignment filter.
* RVI_Signal_Period (Default: 20) - Averaging period in bars for the RVI signal comparison filter.
* Use_MACD_Filter (Default: false) - Enables MACD histogram polarity momentum filter.
* MACD_FastEMA (Default: 12) - Fast EMA period in bars for MACD calculation.
* MACD_SlowEMA (Default: 26) - Slow EMA period in bars for MACD calculation.
* MACD_SignalSMA (Default: 9) - Signal line SMA period in bars for MACD calculation.
* MACD_Applied (Default: PRICE_CLOSE) - Applied price type for MACD calculation.
* Use_MACD_Zero_Filter (Default: false) - Enables MACD main line alignment above or below the zero axis.
* Use_SR_Filter (Default: false) - Enables dynamic Support and Resistance swing zone proximity filter.
* SR_Period (Default: 50) - Lookback window in bars used to identify recent swing highs and lows.
* SR_Zone_Points (Default: 80) - Proximity tolerance buffer in broker points around detected Support/Resistance levels.
* Use_Fib_Filter (Default: false) - Enables automated swing-based Fibonacci retracement zone filter.
* Fib_Level_1 (Default: 0.382) - First Fibonacci retracement ratio boundary defining the pullback zone.
* Fib_Level_2 (Default: 0.618) - Second Fibonacci retracement ratio boundary defining the pullback zone.
* ZigZag_Depth (Default: 12) - Minimum bar depth used to detect swing high and swing low anchor points.
* ZigZag_Deviation (Default: 5) - Minimum price movement in points required to validate a swing point.
* ZigZag_Backstep (Default: 3) - Minimum bar separation between consecutive swing pivots.
* Use_Supertrend_Filter (Default: false) - Enables ATR-based Supertrend directional trend filter.
* ST_AtrPeriod (Default: 10) - ATR averaging period in bars for Supertrend band calculation.
* ST_Factor (Default: 3.0) - Volatility multiplier factor applied to ATR for Supertrend band width.
Risk Disclaimer:
Trading foreign exchange, commodities, indices, and other leveraged financial instruments carries a high level of risk and may not be suitable for all investors. Past performance or historical signal behavior does not guarantee future trading results. ADX Scanner Dashboard Pro is a technical analysis and market monitoring indicator designed strictly to assist traders in visualizing market conditions; it does not execute automated orders and does not guarantee financial profit. Always test the indicator thoroughly on a demo account to understand its operational behavior and resource usage before applying it to live trading decisions.