Adler Dax
- エキスパート
-
Tamara Garcia Infantes
 Welcome to QuantEdgeSys, an algorithmic trading studio focused on MetaTrader 4 and MetaTrader 5.
I develop Expert Advisors, indicators and trading utilities, both custom projects for clients and my own systems.
What I offer:
Custom Expert Advisors built exactly from your rules - バージョン: 1.1
- アップデート済み: 15 11月 2026
- アクティベーション: 5
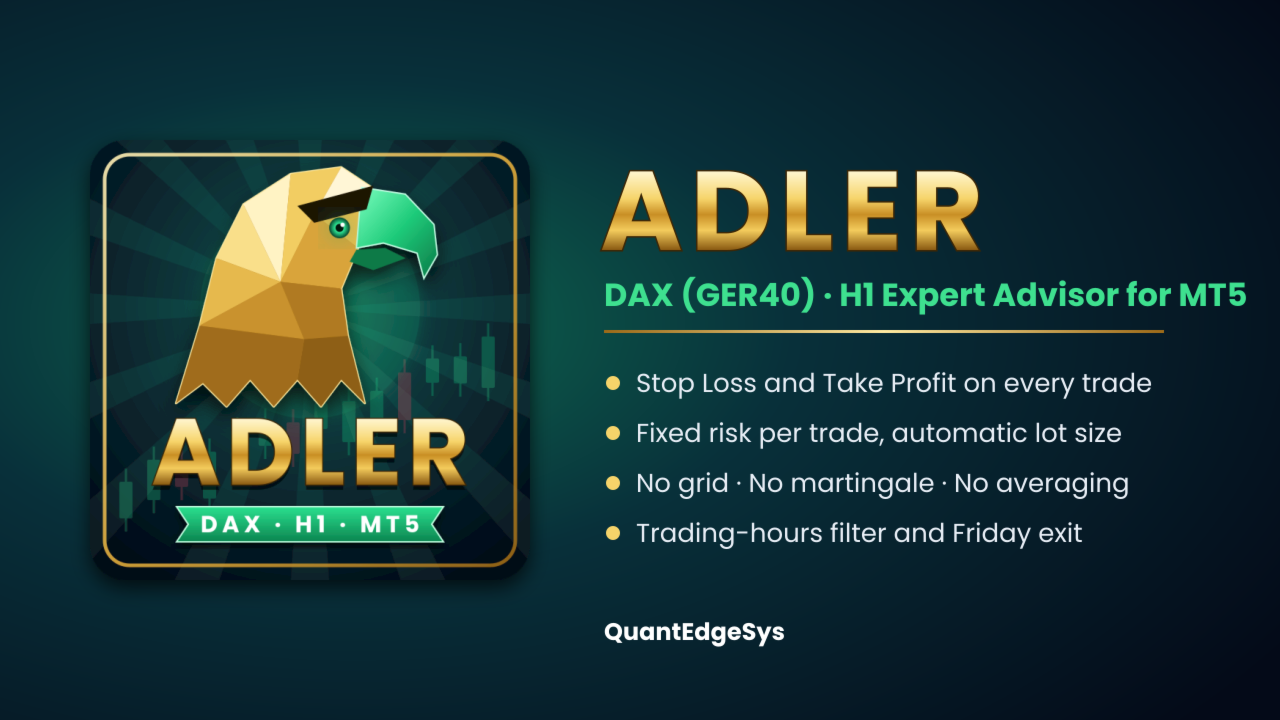
Adler is a fully automated Expert Advisor for the DAX index (GER40 / DE40) on the H1 timeframe. It was built with a systematic, quantitative process and is part of the QuantEdgeSys family of market-specific systems, each one named after a bird of prey. Adler enters the market with pending stop orders, sends every trade with a Stop Loss and a Take Profit, risks a fixed amount of money per trade and closes all positions before the weekend. No grid, no martingale, no averaging down.
IMPORTANT: Adler was designed, optimized and tested only for the DAX index on the H1 timeframe. It can be attached to any chart, but on other symbols or timeframes it shows a warning and its behaviour has not been tested. No responsibility is accepted for results on other symbols or timeframes. Always test it on a demo account before trading live.
Key features
- Built for DAX H1
Designed and tested exclusively on the DAX index, H1 timeframe. No parameter tuning needed.
- Stop Loss and Take Profit on every trade
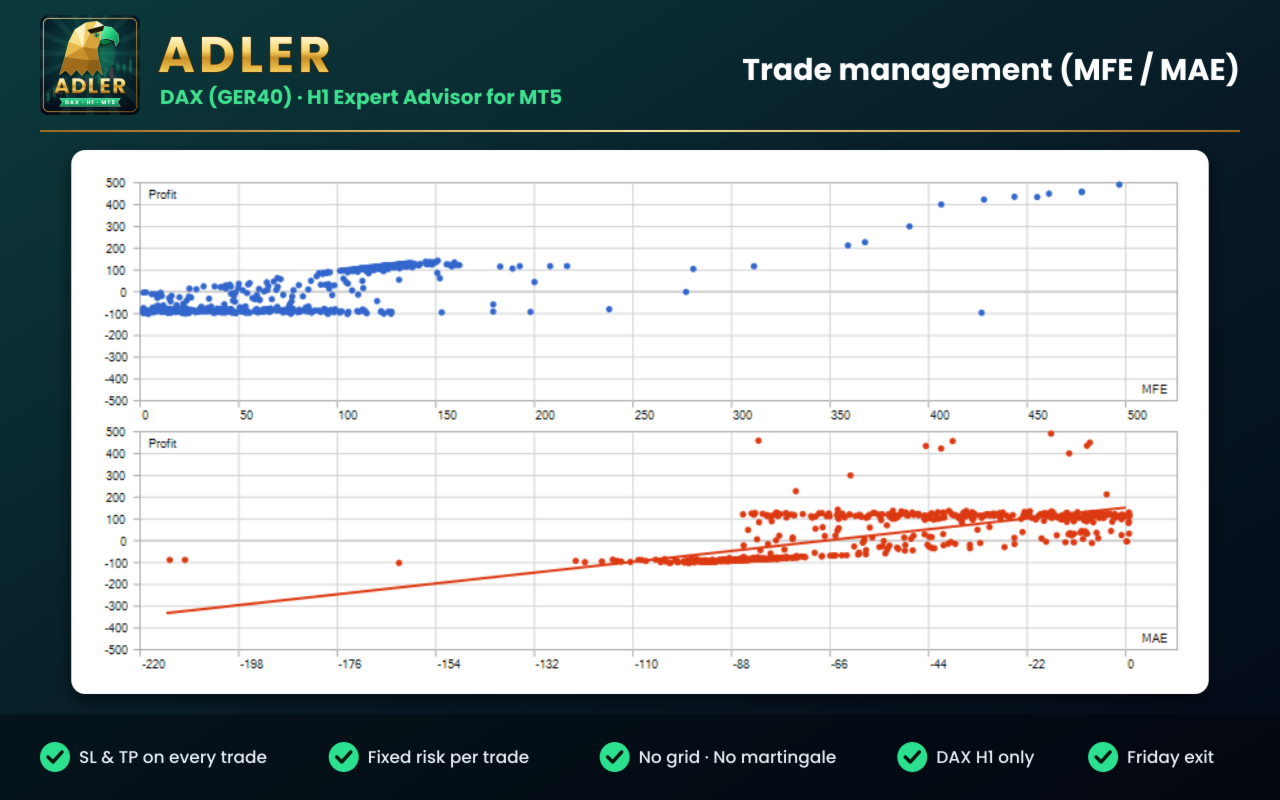
Both are sent with the order and adapt to the current volatility of the index.
- Fixed risk per trade
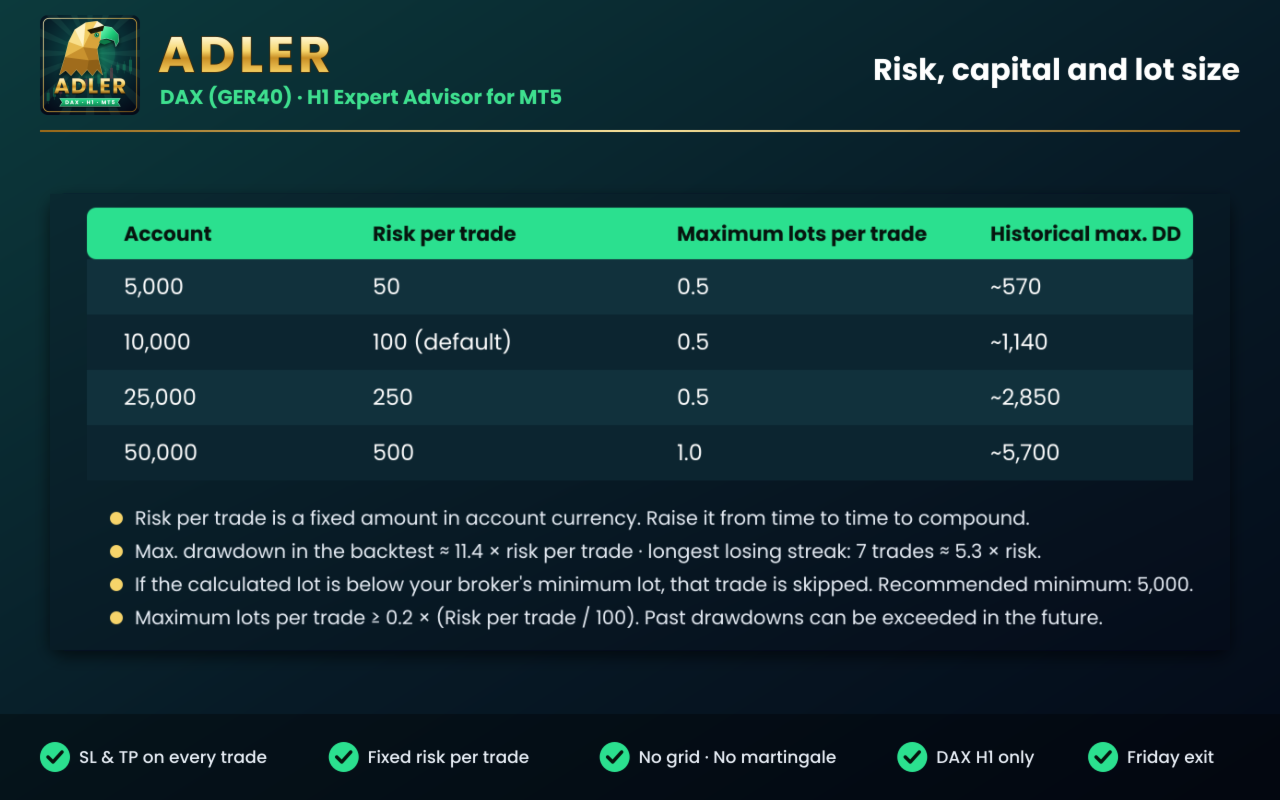
You choose the amount of money to risk; the lot size is calculated automatically for each trade.
- Trading schedule
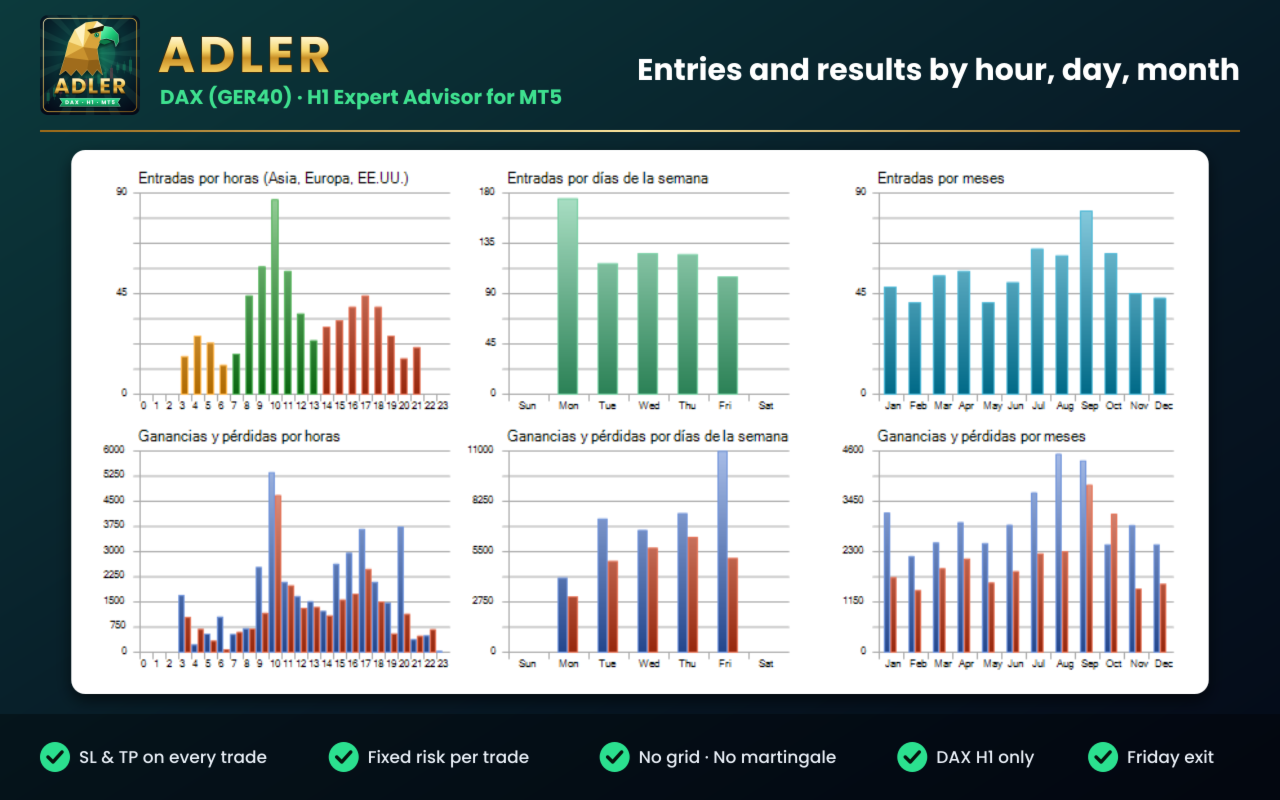
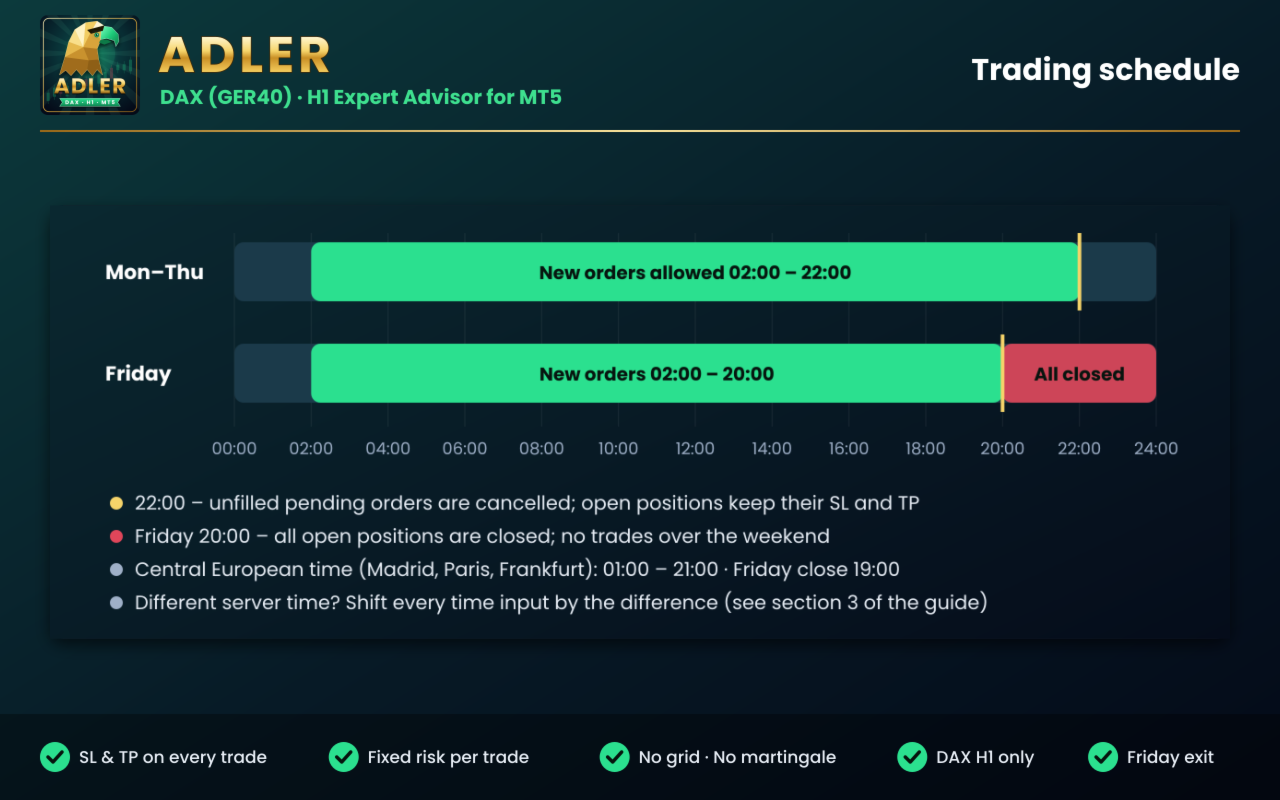
New orders from Monday to Friday, 02:00-22:00 server time. Unfilled pending orders are cancelled at 22:00.
- Weekend protection
All open positions are closed on Friday at 20:00 server time.
- Direction control
Long and short trades can be enabled or disabled from the inputs or from the chart panel.
- Broker-safe execution
Lot size, volume limits and freeze levels are checked before every order.
- Single file
No external indicators, no DLLs.
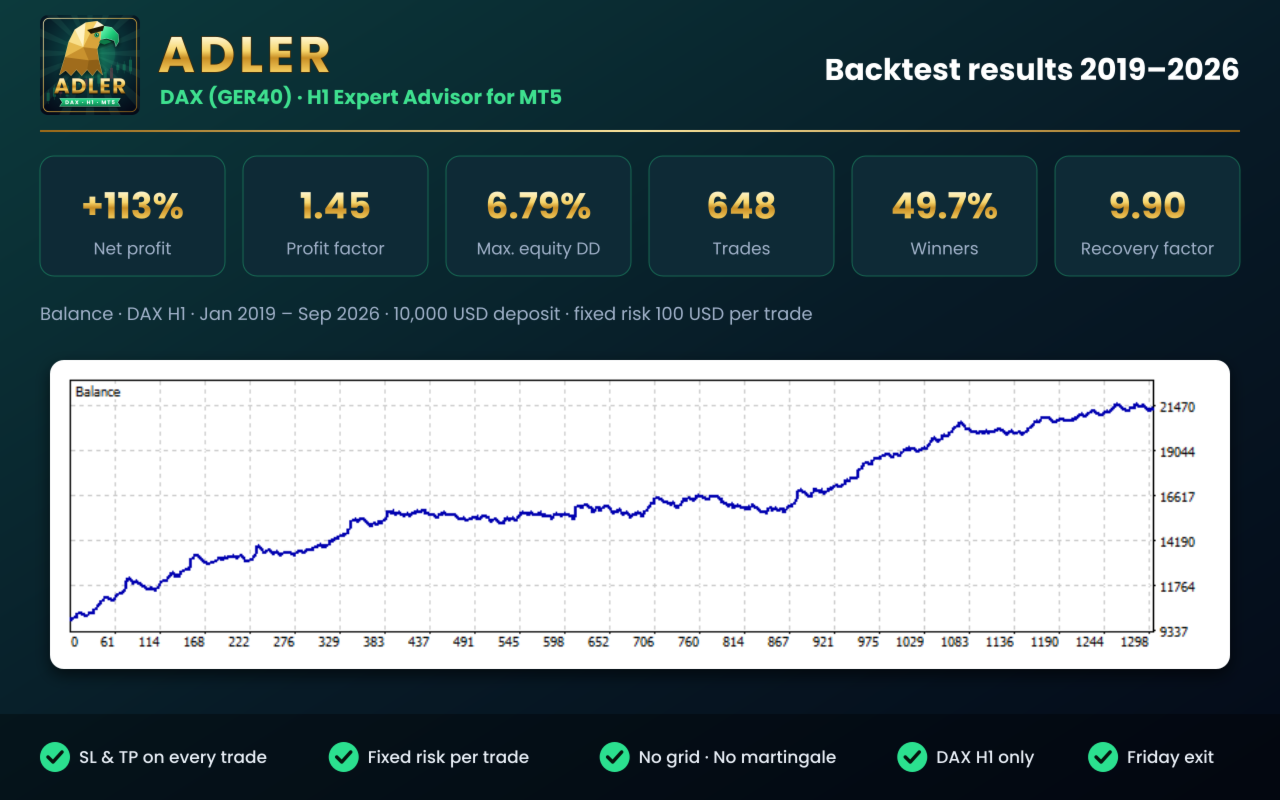
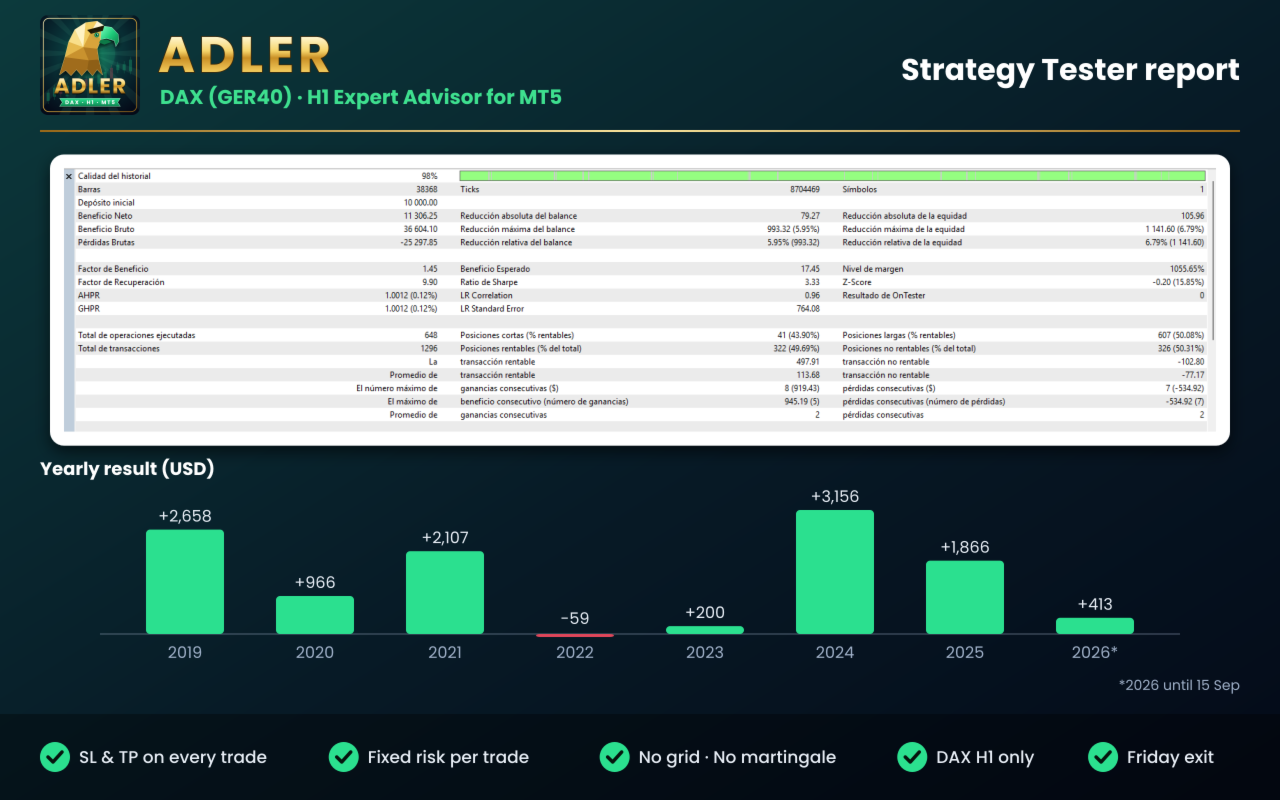
Backtest results (DAX H1, Jan 2019 - Sep 2026, 10,000 USD deposit, fixed risk of 100 USD per trade)
- Net profit: +11,306 USD (+113%)
- Profit factor: 1.45
- Maximum equity drawdown: 6.79%
- Recovery factor: 9.90
- Trades: 648 (49.7% winners; average win 113.68 USD, average loss 77.17 USD)
- Mostly long trades. Expect flat periods: 2022 and 2023 ended close to break-even.
Requirements
- MetaTrader 5, hedging account.
- DAX / GER40 / DE40 CFD on an H1 chart.
- Trading hours are set in broker server time = New York time + 7 hours (GMT+2 in winter / GMT+3 in summer), the most common MT5 setting. If your broker uses a different server time, adjust the times as explained step by step in the user guide.
- Recommended capital: 5,000 or more with 1% risk per trade.
- A VPS is recommended for 24/5 operation.
FAQ
1. Which symbol and timeframe can I use?
Adler was designed and tested only for DAX (GER40, DE40, DAX40, GDAXI...) on H1. It runs on other charts, but its behaviour there has not been tested.
2. Does it use grid, martingale or averaging down?
No. Every trade has its own Stop Loss and Take Profit.
3. What is the minimum capital?
5,000 with 1% risk per trade. With less capital, some trades may be skipped because the lot would be below your broker's minimum.
4. My broker uses a different server time. What do I do?
Shift the time inputs by the difference. The user guide explains how to check it and gives an example.
5. Can I change the strategy parameters?
No. You set risk, schedule and execution options. The strategy logic is fixed and optimized for DAX H1.
6. Does it hold trades overnight or over the weekend?
Overnight, yes, always with Stop Loss and Take Profit. Over the weekend, never.
7. Can I test it before buying?
Yes. Download the free demo and test it in the Strategy Tester on your broker's DAX symbol, H1, using real ticks.
What you receive
- Adler for MetaTrader 5, with free updates.
- A full user guide in English (Comments tab): schedule, risk, capital, lot size and every input explained.
- Support through MQL5 private messages.
Risk warning
Trading CFDs involves a high risk of losing money. Backtest results are hypothetical and do not guarantee future results. Test Adler on a demo account before trading live and only trade with capital you can afford to lose. The user is responsible for the settings, symbol and timeframe used.
IMPORTANT: Adler was designed, optimized and tested only for the DAX index on the H1 timeframe. It can be attached to any chart, but on other symbols or timeframes it shows a warning and its behaviour has not been tested. No responsibility is accepted for results on other symbols or timeframes. Always test it on a demo account before trading live.
Key features
- Built for DAX H1
Designed and tested exclusively on the DAX index, H1 timeframe. No parameter tuning needed.
- Stop Loss and Take Profit on every trade
Both are sent with the order and adapt to the current volatility of the index.
- Fixed risk per trade
You choose the amount of money to risk; the lot size is calculated automatically for each trade.
- Trading schedule
New orders from Monday to Friday, 02:00-22:00 server time. Unfilled pending orders are cancelled at 22:00.
- Weekend protection
All open positions are closed on Friday at 20:00 server time.
- Direction control
Long and short trades can be enabled or disabled from the inputs or from the chart panel.
- Broker-safe execution
Lot size, volume limits and freeze levels are checked before every order.
- Single file
No external indicators, no DLLs.
Backtest results (DAX H1, Jan 2019 - Sep 2026, 10,000 USD deposit, fixed risk of 100 USD per trade)
- Net profit: +11,306 USD (+113%)
- Profit factor: 1.45
- Maximum equity drawdown: 6.79%
- Recovery factor: 9.90
- Trades: 648 (49.7% winners; average win 113.68 USD, average loss 77.17 USD)
- Mostly long trades. Expect flat periods: 2022 and 2023 ended close to break-even.
Requirements
- MetaTrader 5, hedging account.
- DAX / GER40 / DE40 CFD on an H1 chart.
- Trading hours are set in broker server time = New York time + 7 hours (GMT+2 in winter / GMT+3 in summer), the most common MT5 setting. If your broker uses a different server time, adjust the times as explained step by step in the user guide.
- Recommended capital: 5,000 or more with 1% risk per trade.
- A VPS is recommended for 24/5 operation.
FAQ
1. Which symbol and timeframe can I use?
Adler was designed and tested only for DAX (GER40, DE40, DAX40, GDAXI...) on H1. It runs on other charts, but its behaviour there has not been tested.
2. Does it use grid, martingale or averaging down?
No. Every trade has its own Stop Loss and Take Profit.
3. What is the minimum capital?
5,000 with 1% risk per trade. With less capital, some trades may be skipped because the lot would be below your broker's minimum.
4. My broker uses a different server time. What do I do?
Shift the time inputs by the difference. The user guide explains how to check it and gives an example.
5. Can I change the strategy parameters?
No. You set risk, schedule and execution options. The strategy logic is fixed and optimized for DAX H1.
6. Does it hold trades overnight or over the weekend?
Overnight, yes, always with Stop Loss and Take Profit. Over the weekend, never.
7. Can I test it before buying?
Yes. Download the free demo and test it in the Strategy Tester on your broker's DAX symbol, H1, using real ticks.
What you receive
- Adler for MetaTrader 5, with free updates.
- A full user guide in English (Comments tab): schedule, risk, capital, lot size and every input explained.
- Support through MQL5 private messages.
Risk warning
Trading CFDs involves a high risk of losing money. Backtest results are hypothetical and do not guarantee future results. Test Adler on a demo account before trading live and only trade with capital you can afford to lose. The user is responsible for the settings, symbol and timeframe used.