Zone Risk Planner MT4
- インディケータ
-
Tamara Garcia Infantes
 Welcome to QuantEdgeSys, an algorithmic trading studio focused on MetaTrader 4 and MetaTrader 5.
I develop Expert Advisors, indicators and trading utilities, both custom projects for clients and my own systems.
What I offer:
Custom Expert Advisors built exactly from your rules - バージョン: 1.0
- アクティベーション: 5
Zone Risk Planner — support and resistance zones turned into a complete trade plan
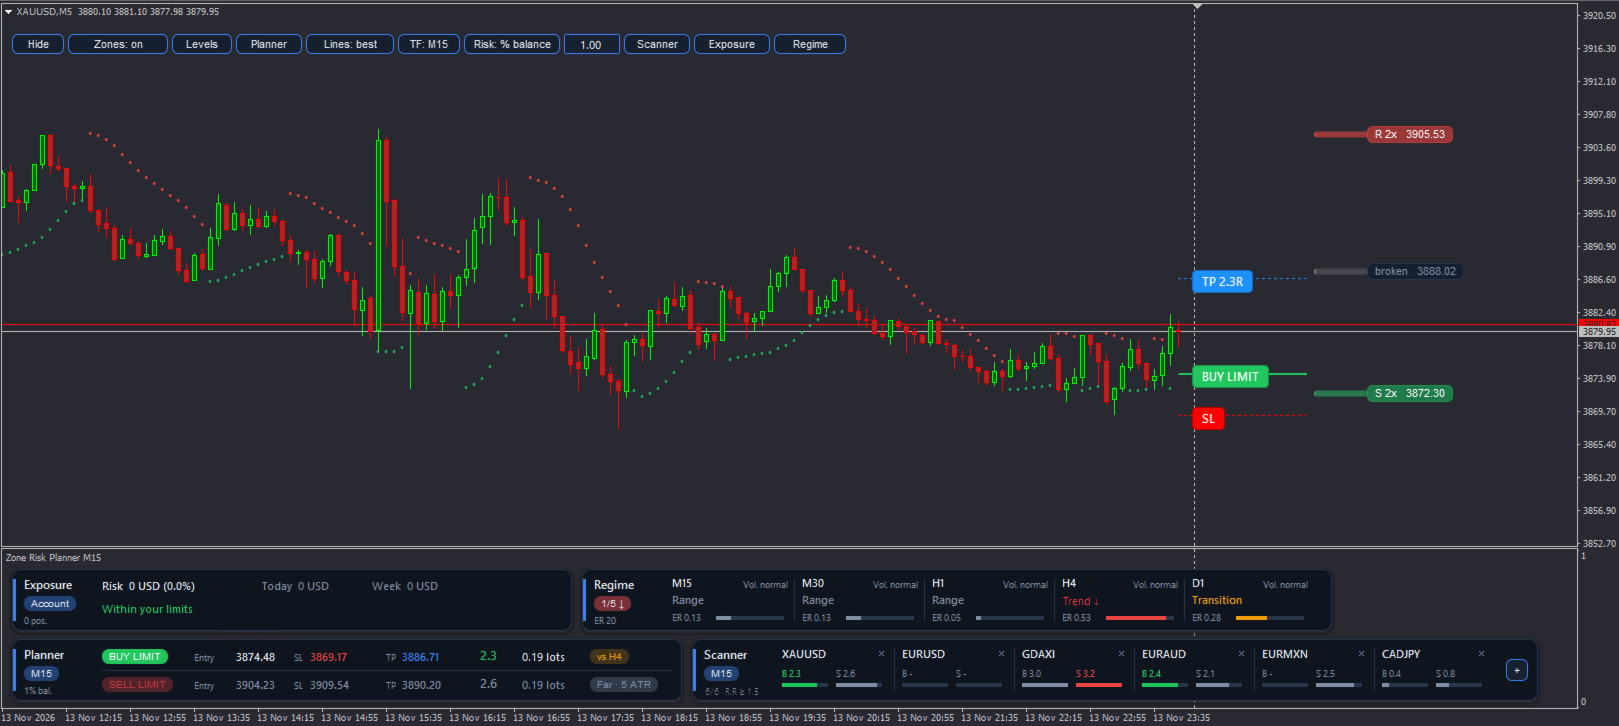
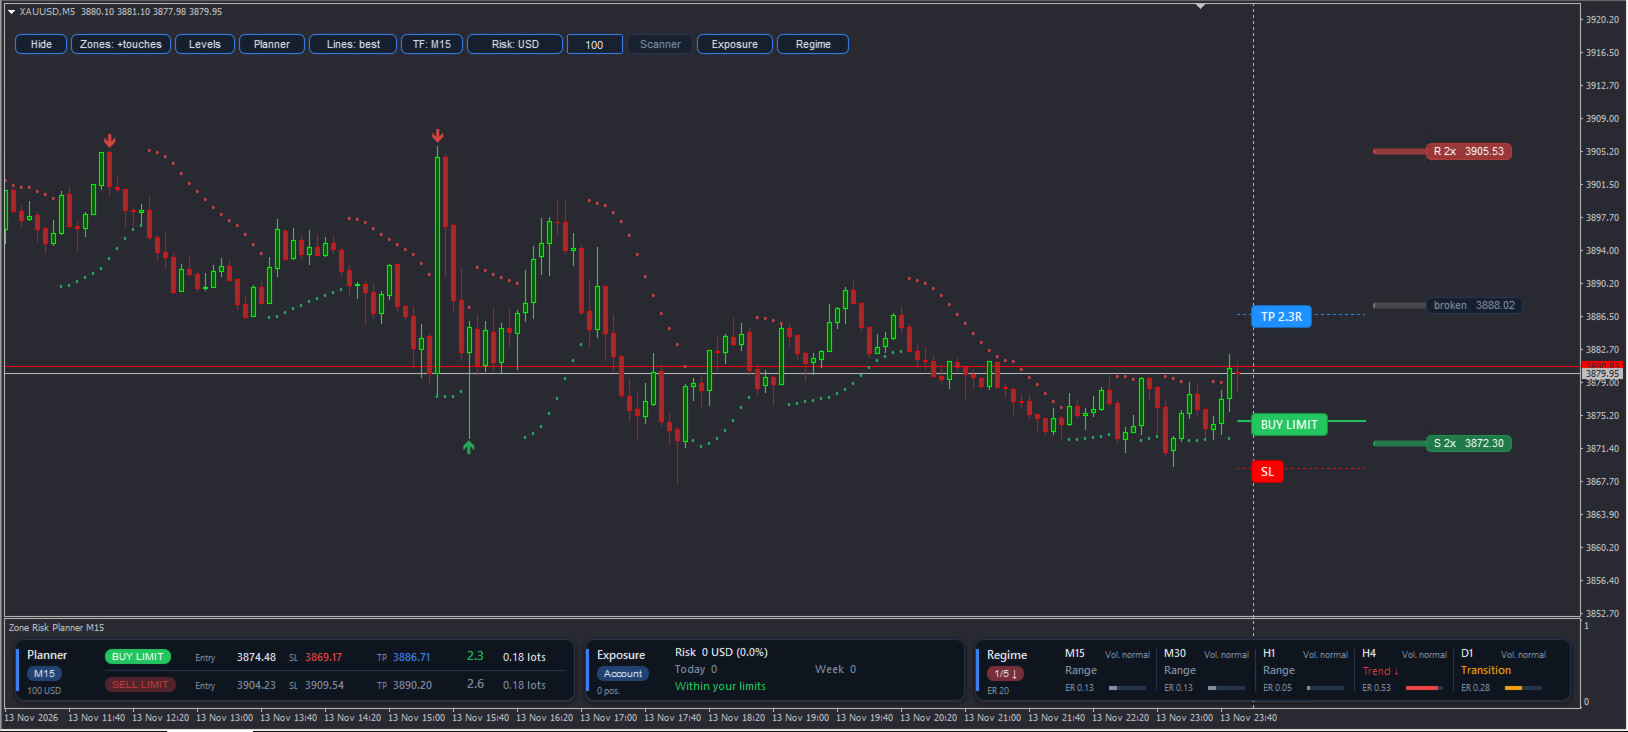
Before placing a trade you need the zone, the entry, the stop loss (SL), the take profit (TP), the lot size for your risk, and a look at the higher timeframes and your other symbols. Doing that by hand on every chart takes time and leads to sizing mistakes. Zone Risk Planner draws the zones and turns them into a plan with lot size and reward-to-risk ratio (R:R), and shows the market context and your account risk in panels under the chart.
What it shows
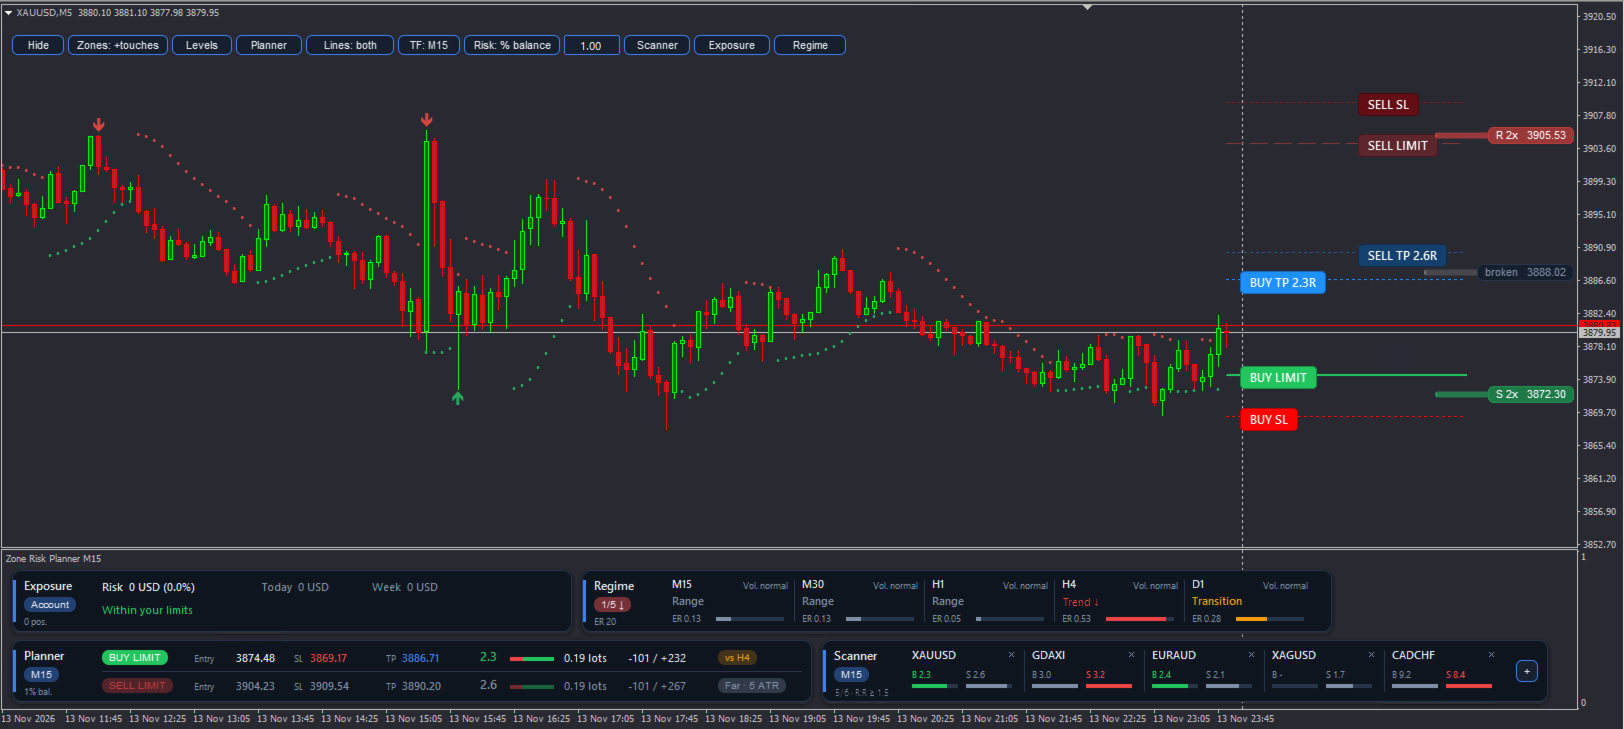
• Support and resistance zones from the timeframe you choose (M5 to D1), with the number of touches, broken zones in grey and confluence with the next higher timeframe ("+H1").
• A buy and a sell plan: entry at the zone edge (or now, if price is already inside), SL beyond the zone with an Average True Range (ATR) buffer, and TP at the next zone visible on the chart.
• Net R:R after spread and commission, and a status: Valid, Not worth it, against a higher-timeframe trend, or Far (limit entry more than 3 ATR away).
• Lot size for your risk, capped at the broker maximum, with a warning when free margin is not enough or when the minimum lot already risks more than you set.
• Trailing dots in the style of the Parabolic SAR that restart at the nearest zone when the trend turns.
• Market regime on up to 6 timeframes: trend up, trend down, range or transition, and high, normal or low volatility.
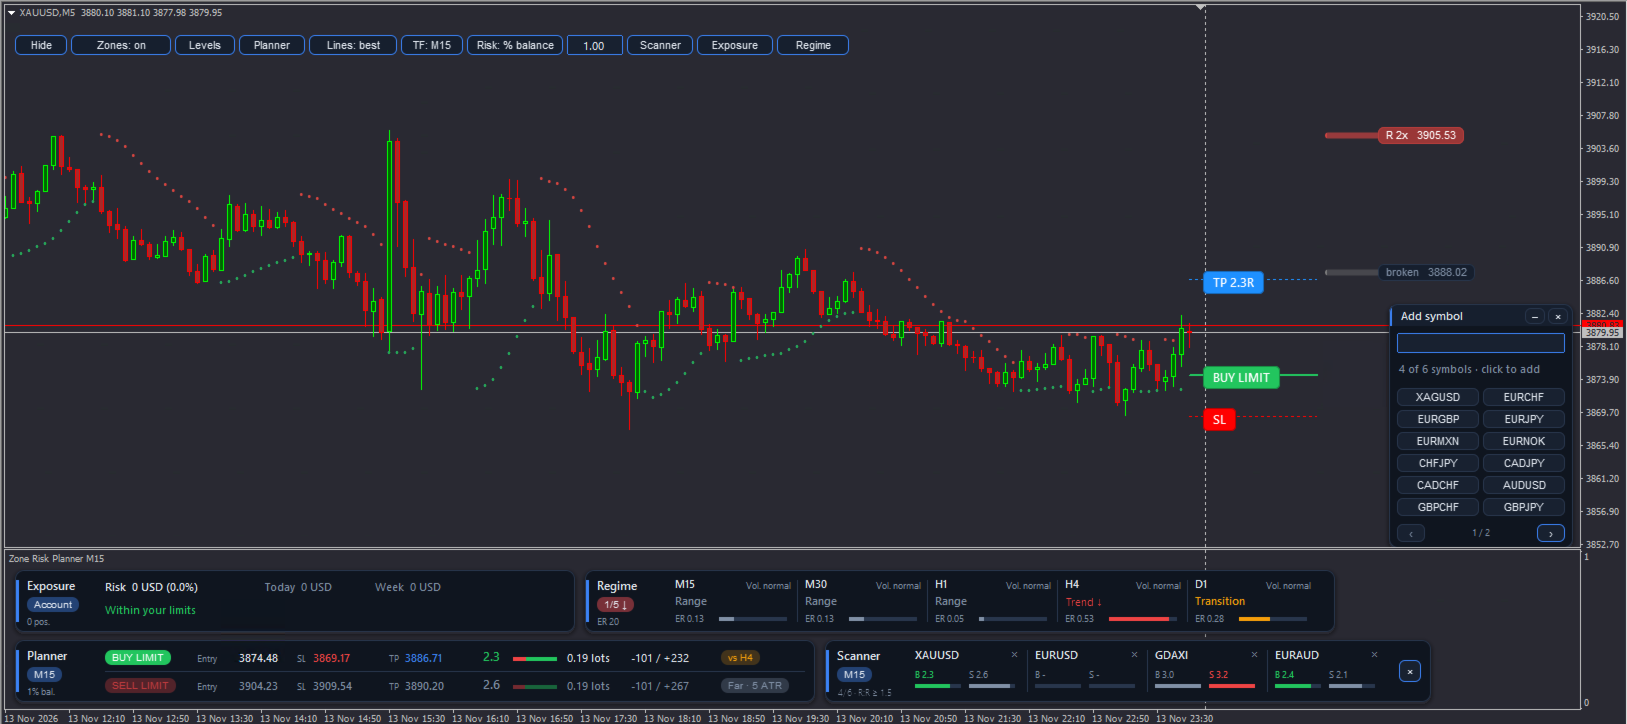
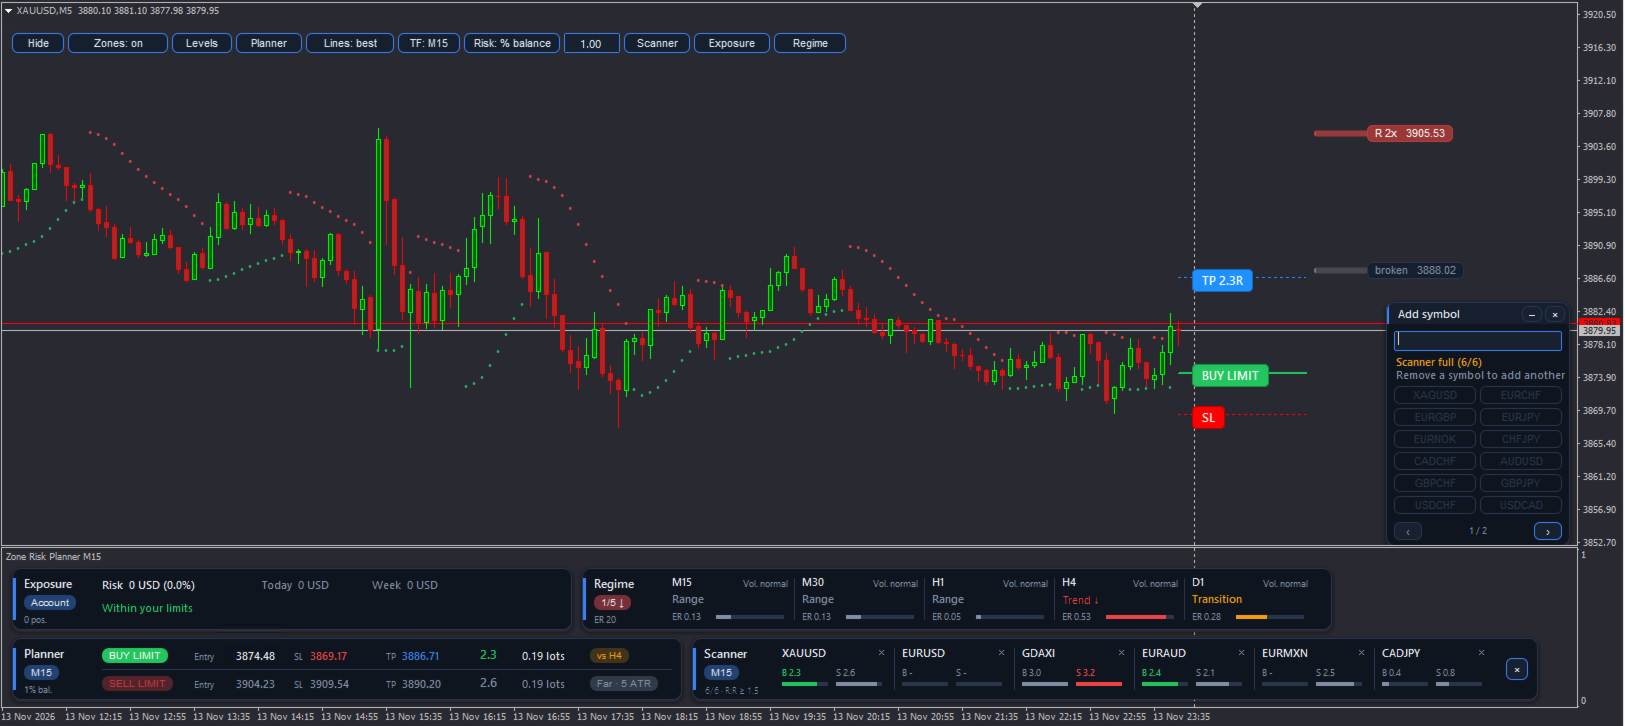
• A scanner with up to 6 symbols showing the buy and sell R:R of each one.
• Account exposure: open risk of all positions, positions without SL, and today's and this week's result against your limits.
What you can do
• Switch zones, trailing dots, planner, scanner, exposure and regime on and off with the buttons on the chart.
• Change the zone timeframe with one click, and type your risk as % of balance, % of equity or a fixed amount.
• Show the lines of the best plan, both plans or none.
• Add symbols to the scanner from a searchable list, and click a symbol to open its chart.
• Follow open trades: with a position on the symbol, the planner shows its entry, SL, TP, real R:R, money at risk and whether a zone stands before the TP.
• Get alerts (popup, push or email) when a plan reaches your minimum R:R, when price enters a zone or a zone breaks, when the regime changes or when an account limit is reached.
Panels
• The panels sit in their own window under the chart, in up to two rows, so they never cover the candles. The window adjusts its height to the panels you have open.
• On a narrow chart the panels can be scrolled sideways with the ‹ › buttons.
• Asset profiles (Forex, indices, metals, crypto or custom) set the zone width and SL distances automatically.
• Light and dark theme (automatic, following the chart background) and English or Spanish interface.
Inputs
• Language: English or Spanish.
• Panel theme: automatic, dark or light.
• Zone timeframe, bars to analyze, minimum touches, zones per side and broken zones.
• Risk mode and value, commission per lot, minimum R:R and the "Far" distance.
• Exposure limits: open risk, daily and weekly loss, positions and positions on the same currency.
• Scanner symbols and refresh, regime timeframes and thresholds, and alerts.
Zone Risk Planner does not open, close or modify trades. It is a planning tool and works on any symbol and timeframe.
Important
• The panels need a chart about 1,100 px wide to show in two rows. On smaller or tiled charts some panels are cut off and you have to scroll them with the ‹ › buttons, so the indicator is meant to be used on one large chart, from which you review several symbols and timeframes.
• Calculations use closed bars and do not repaint.
• Trading involves risk. This tool helps you plan and control risk; it does not predict the market or guarantee results.
Also available for MetaTrader 5.