Session Timing Pro
- インディケータ
- バージョン: 2.12
- アクティベーション: 10

Session Timing Pro shows when each forex session is open and rates every part of the trading day for your symbol.
Most day traders know that the same setup behaves differently at 03:00 and at 14:00. Session Timing Pro puts the trading clock directly on your chart. It draws the Sydney, Tokyo, London and New York sessions in the time zone you choose, colors the background by trading quality, marks the important daily levels and keeps an information panel with the current state of the market.
All session times are calculated automatically, including daylight saving time changes in Europe, the United States and Australia. You do not need to adjust anything when the clocks change.
How it works
For every moment of the day the indicator checks which sessions are open and how strongly each session is connected to the two currencies of the current symbol. A session where one of the currencies is traded as a primary currency counts more. The first two hours after the open count extra, and the last hours before the close count less. From this the indicator builds a rating for each part of the day: BEST, GOOD, AVERAGE, WEAK or AVOID. The New York rollover (16:30-18:00 New York time), when spreads are often wide, is always marked as AVOID. Weekends are marked as CLOSED.
The rating is different for every symbol. For example, EURUSD and USDJPY receive different trading windows, because different sessions are relevant for them.
Main functions
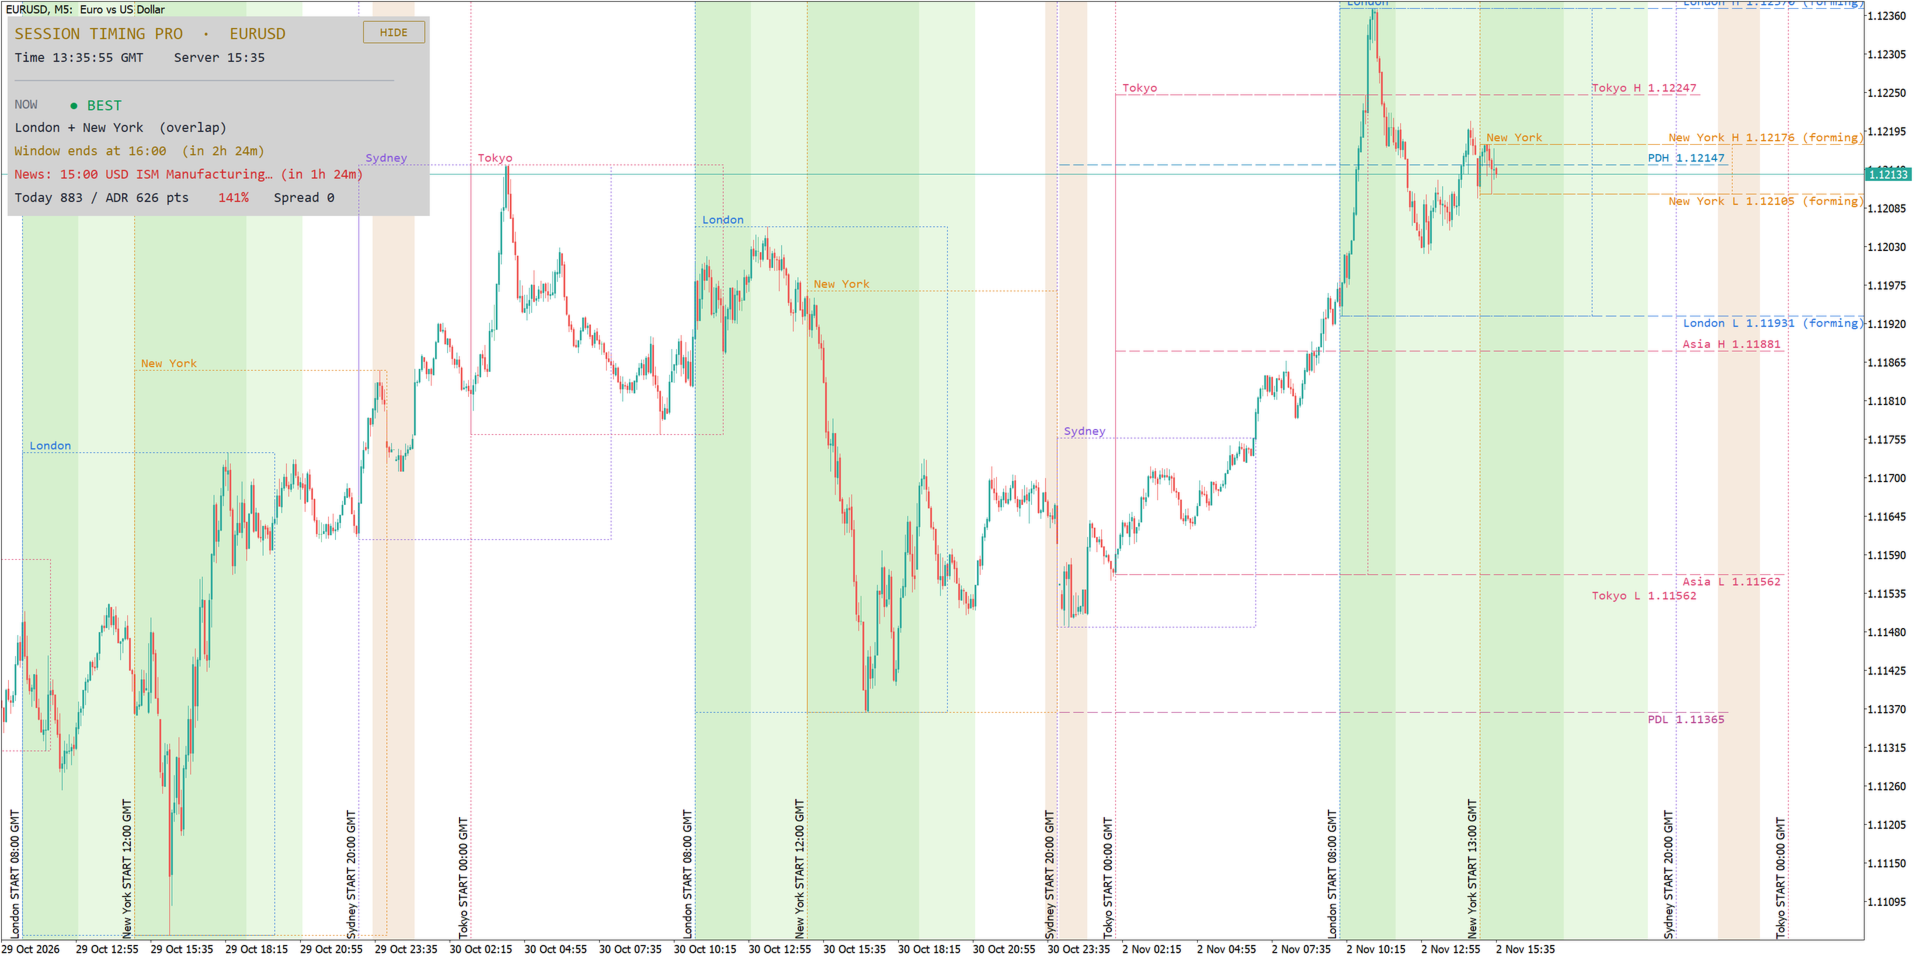
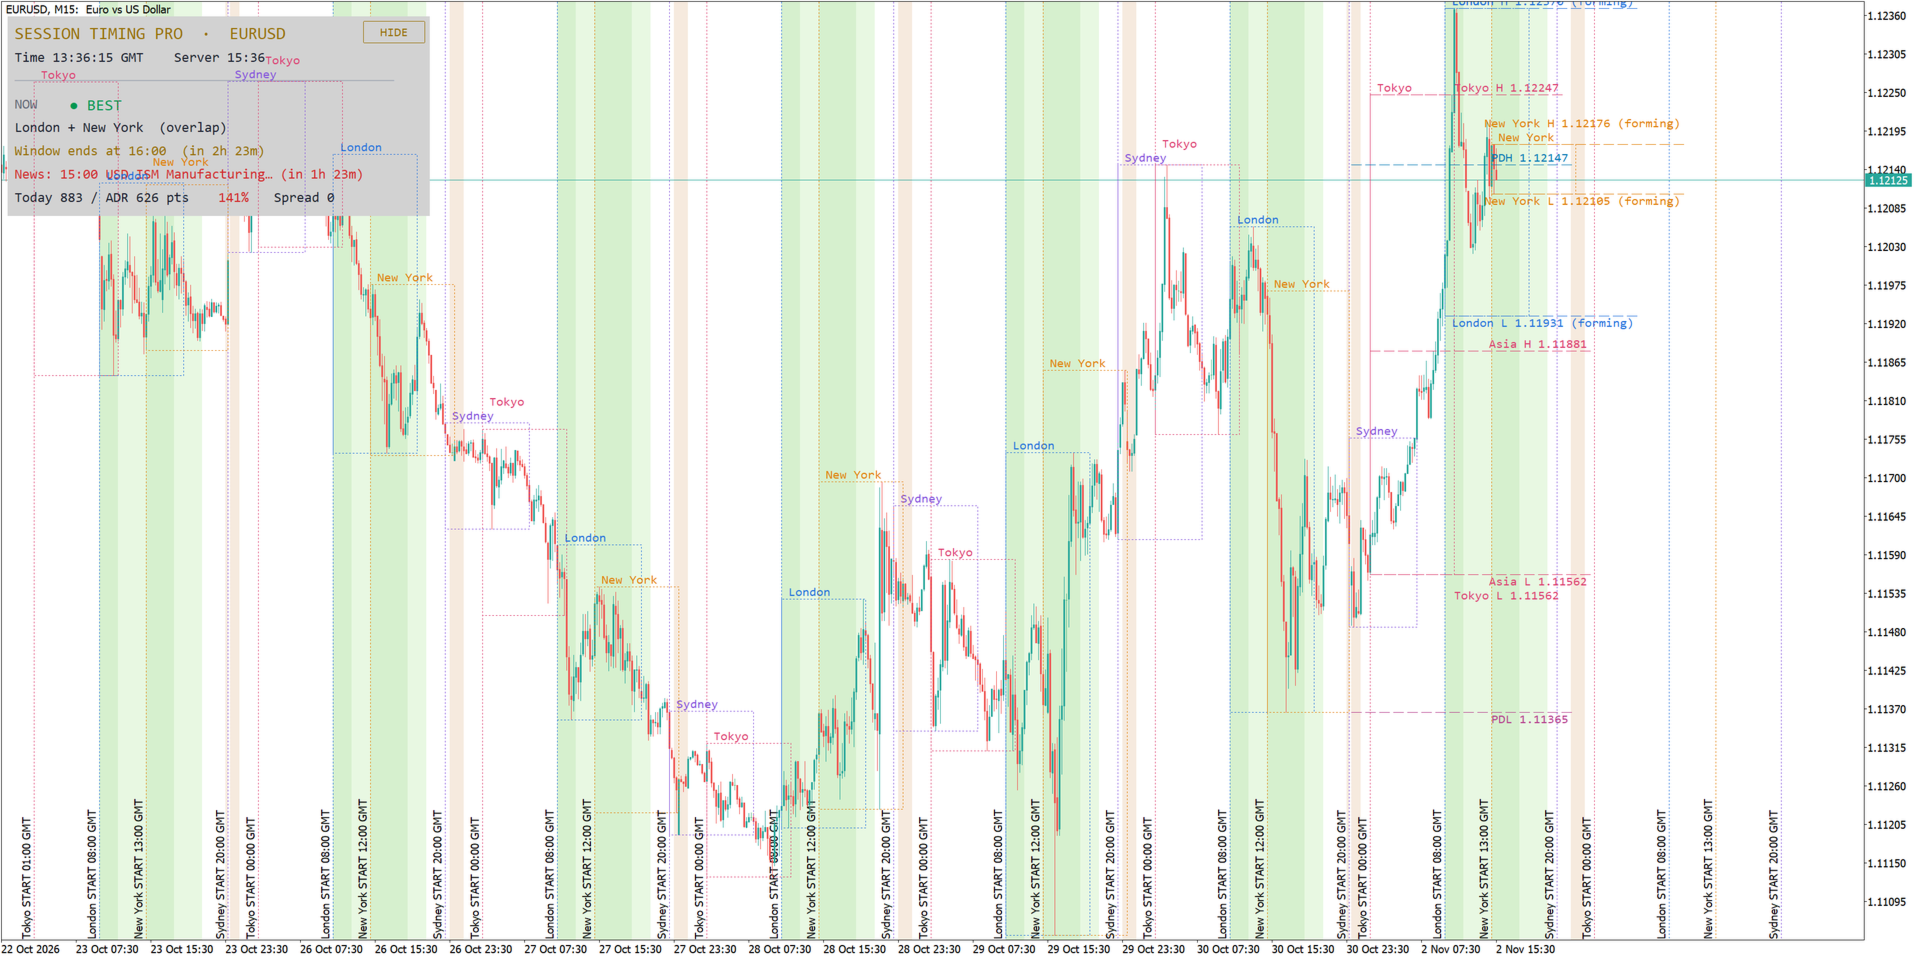
- Session boxes on the chart. The high and low of every Sydney, Tokyo, London and New York session are drawn as a box with the session name, for the number of days you choose (timeframes up to H1).
- Session open lines. A vertical line marks the start of every session, with the open time in your display time zone.
- Trading window background. The chart background is colored by trading quality: BEST windows, GOOD windows and AVOID (rollover) periods. Each type can be switched on or off.
- High/Low lines of each session. Horizontal lines at the high and low of the last Tokyo, London, New York (and optionally Sydney) session, extended for a chosen number of hours after the close. While a session is still running the lines are marked "forming" and update in real time.
- Previous day High and Low (PDH / PDL) lines.
- Asian range. The high and low of the Asian session (default 00:00-07:00 London time) with an optional alert when price breaks out of the range during the following hours.
- Clear labels. Every level has one label with its name and price at the right edge of the chart. Labels that are close to each other are moved apart automatically, so they never overlap, also after zooming or scrolling.
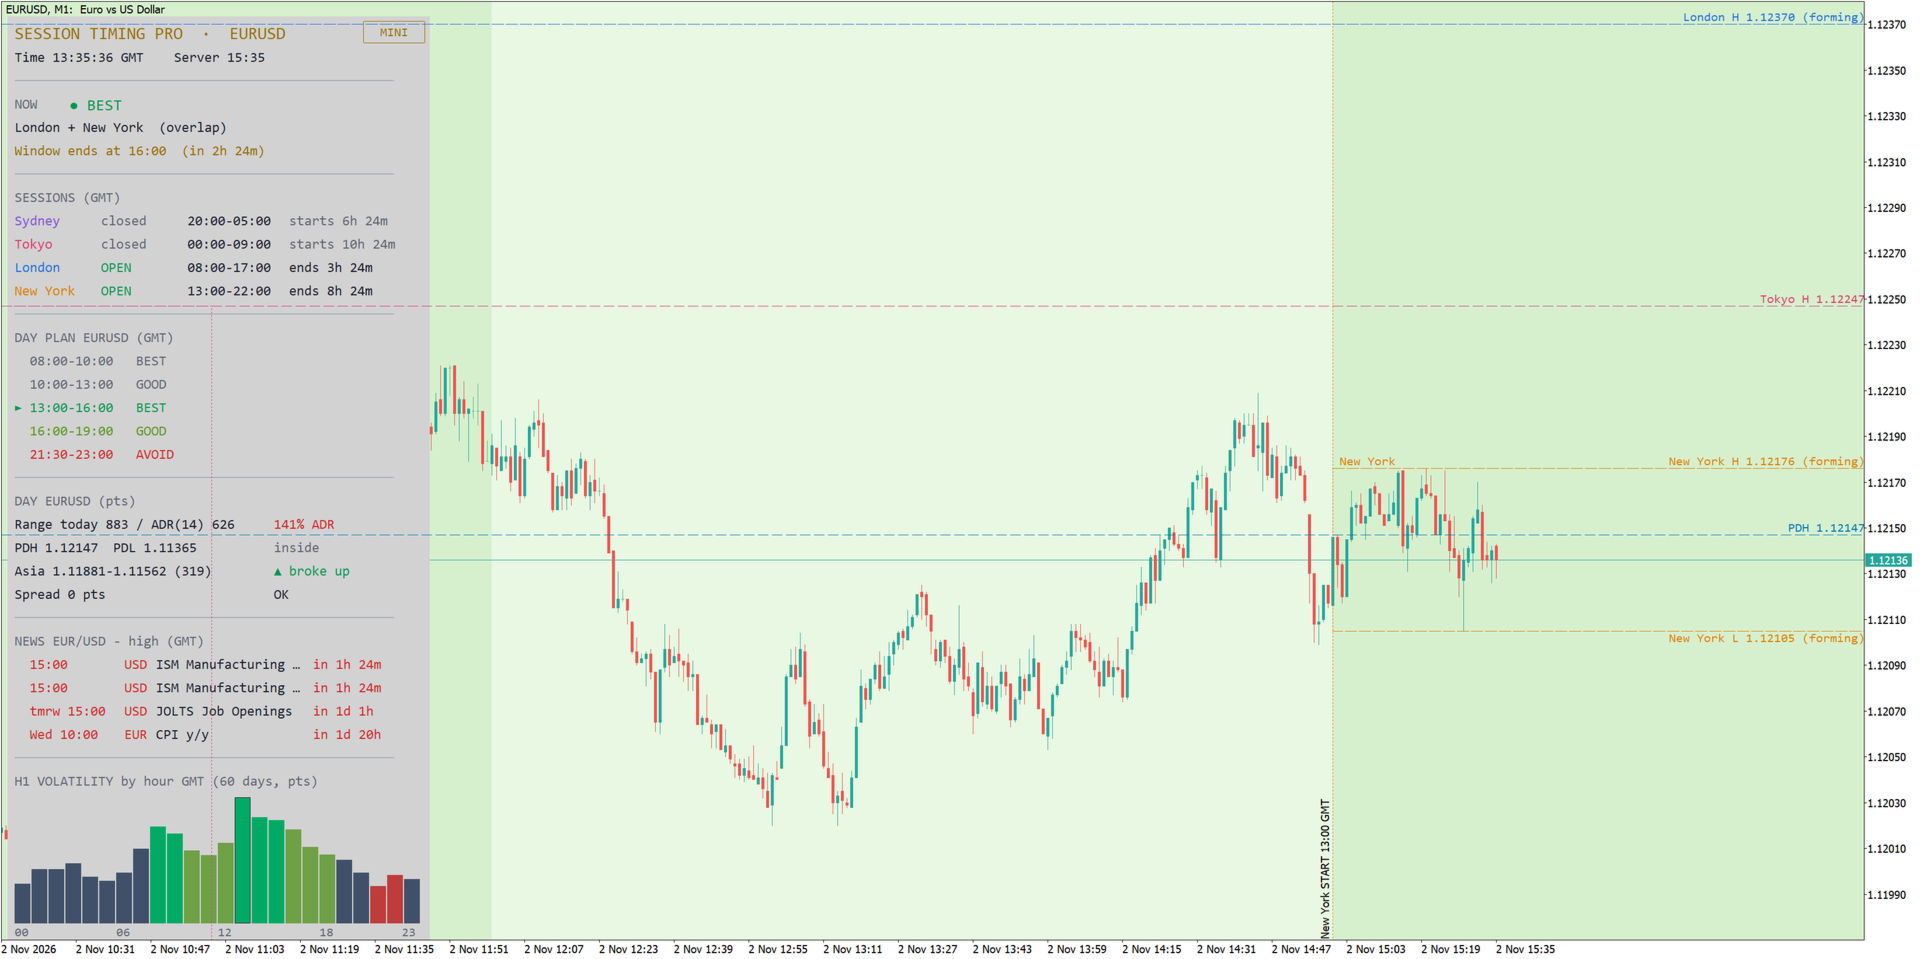
- Information panel with three modes: FULL, MINI and HIDE (one button on the chart switches between them). The panel shows:
- current time in your display time zone and the broker server time,
- the current rating (BEST / GOOD / AVERAGE / WEAK / AVOID) with the open sessions and overlaps,
- the next BEST window and a countdown to it, or the time when the current window ends,
- the status of all four sessions (open or closed), their hours and the time until they open or close,
- the day plan for the symbol: all trading windows of the day with their rating,
- today's range compared with the Average Daily Range (ADR) in points and percent,
- PDH and PDL and whether price is inside or outside the previous day range,
- the Asian range and its breakout status,
- the current spread, with a warning when it is above your limit.
- Economic news from the built-in MetaTrader 5 calendar. The next important events for both currencies of the symbol are listed in the panel with a countdown. Around each event a CAUTION window is shown (default +/- 15 minutes). You can choose the importance level.
- Hourly volatility statistics. A bar chart in the panel shows the average H1 range for every hour of the day over the last 60 days (adjustable), in your display time zone. The best hours, the hours to avoid and the current hour are highlighted, and the three most active hours are listed.
- Alerts: start of a BEST window, opening of each session, Asian range breakout and upcoming news. Alerts can be sent as a popup and as push notifications to your phone.
- Any display time zone. Show all times in London, Central Europe, New York, Tokyo, Sydney, UTC, broker server time, your computer time or a custom UTC offset.
- Broker time detection. The broker time zone can be set as NY-close (GMT+2/GMT+3, used by most ECN brokers), automatic or manual.
- Light and dark charts. Text colors adapt automatically to the chart and panel background. All colors can be changed.
Recommendations
- Works on all symbols and all timeframes. Session boxes are drawn on timeframes up to H1. Best suited for intraday trading on M1 to H1.
- Forex pairs, gold (XAUUSD) and indices.
- The indicator does not open or close trades and does not repaint past sessions.
- No DLL, no external connections. News data comes only from the MetaTrader 5 economic calendar.
Input parameters
Time zone
- Display time zone - time zone for all times on the chart and in the panel (default: London).
- Custom UTC offset in hours - used when the display time zone is set to Custom, for example 5.5 (default: 0).
Broker server time
- Broker time zone - NY-close, Auto or Manual (default: NY-close, GMT+2 / GMT+3 in summer).
- Manual server offset from GMT - used in Manual mode (default: 2).
Chart
- Days of history to draw (default: 10).
- Session High/Low boxes, timeframes up to H1 (default: true).
- Show Sydney / Tokyo / London / New York session (default: true).
- Session open lines (default: true).
- Background: BEST windows / GOOD windows / AVOID rollover (default: true).
Panel
- Panel mode at start - Full, Mini or Hidden (default: Full).
- FULL / MINI / HIDE button on the chart (default: true).
- Panel background (default: true).
- Auto text color for chart and panel background (default: true).
- Position X / Position Y (default: 10 / 25).
- Font size (default: 9).
- Line spacing in pixels (default: 8).
- Text width correction, use 1.1-1.3 if text overlaps on your screen (default: 1.0).
- Minimum panel width in pixels (default: 380).
- Hourly H1 volatility statistics (default: true).
- Days for statistics (default: 60).
- Volatility bar height (default: 3.0).
Day trading
- Previous day High/Low lines (default: true).
- Asian range lines (default: true).
- Asian range start / end, hour in London time (default: 0 / 7).
- Alert: Asian range breakout (default: true).
- Hours after Asia to watch for breakout (default: 9).
- ADR: number of days (default: 14).
- Warning: spread above, in points (default: 20).
High/Low lines of each session
- H/L lines: Sydney (default: false), Tokyo, London, New York (default: true).
- Number of recent days, 1 = last session only (default: 1).
- Line style / Line width (default: dash / 1).
- Extend lines after session close, in hours (default: 12).
News (MetaTrader 5 calendar)
- Show news (default: true).
- News importance (default: high).
- News lines in panel (default: 4).
- CAUTION window around news, +/- minutes (default: 15).
- Alert X minutes before news, 0 = off (default: 10).
Alerts
- Alert: best window starts (default: true).
- Alert: session opens (default: false).
- Push notifications to phone (default: false).
Colors
- Colors of every session, background zones, panel, ratings, volatility bars, PDH/PDL and Asian range lines.
Important notes
- Session Timing Pro is an analysis tool. It shows market hours and statistics; it does not give trading signals and does not guarantee results. Trading involves risk.
- Check that the broker time zone setting matches your broker. Most ECN brokers use NY-close time (GMT+2, GMT+3 in summer). If session lines look shifted, choose Auto or Manual.
- In the Strategy Tester the MetaTrader 5 economic calendar is not available, so the news section stays empty there. All other functions work.
- While the indicator is on the chart it switches off "Chart on foreground" (so the panel stays readable) and switches on "Show object descriptions" (for the session open labels). The original settings are restored when the indicator is removed.