FXvestars Account Tracker
- ユーティリティ
- バージョン: 1.0

Free for 24-hours only! after than it will be for sale at 30$
FXvestars — Multi-EA Performance Dashboard for MT5
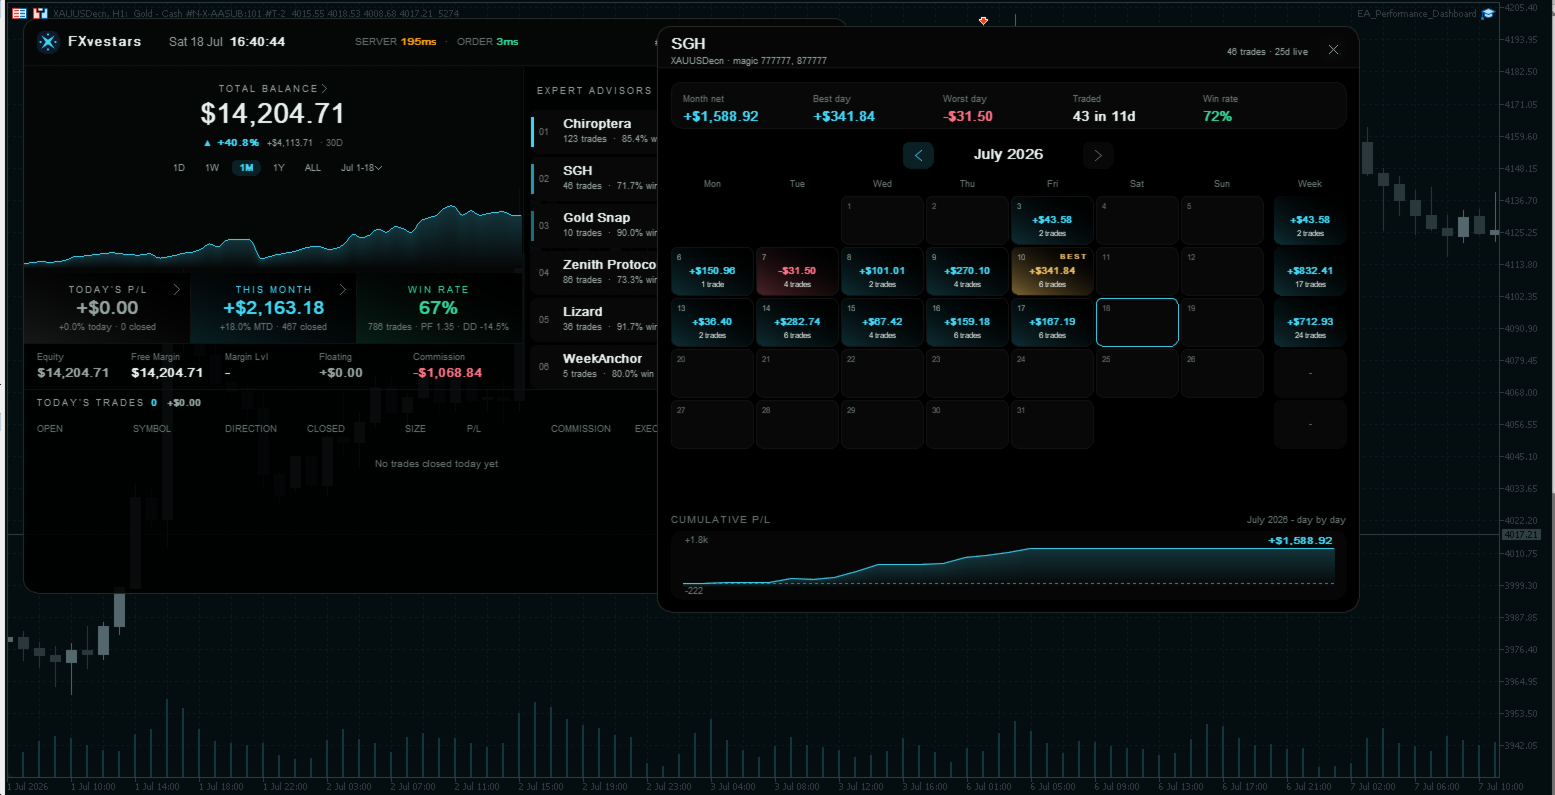
Running several EAs on one account and never quite sure which one is actually carrying you? FXvestars turns that account into a single, glanceable control panel. It reads your trade history only — it never opens, modifies, or closes a position — and shows you clearly which EA is making money, how each day went, and how fast your orders are really filling.
Group your EAs by magic number, drop the panel on any chart, and get a live, self-updating dashboard in a clean dark UI.
Fueatures!
- Per-EA leaderboard — every EA ranked by growth, with trade count, win rate and drawdown. The top performers get a podium rail so the winners read at a glance.
- Balance & equity curve — headline balance from closed orders, a cumulative growth curve, and total growth %.
- Profit calendar — click any EA (or the account balance) to open a month-by-month calendar: per-day P/L, weekly totals, best & worst day, win rate, and a cumulative P/L curve. Click any day to list every trade behind it.
- Today's Trades log — a full blotter of today's closed trades: open time & price, direction, close time & price, size, P/L, commission, comment, and execution latency (entry / exit) — paginated.
- Execution-speed monitoring — a live server ping plus real order execution latency (order placed → filled) so you can catch slow fills before they cost you. Trailing-stop / SL / TP exits are timed too.
- Custom date ranges — quick presets (This month, Last month, 3 months, This year, Last year, All time) plus a click-to-pick calendar. Every figure on the panel re-scopes to the range you choose.
- Account strip — equity, free margin, margin level, floating P/L and commission on one line.
- Manual-trade aware — optionally include hand-placed trades (no magic number) as their own row; trades closed by hand are correctly attributed to the EA that opened them.
- Broker/server clock — the trade server's own time, in the header.
How to use
1. Attach it
Drag the EA onto any one chart (any symbol / any timeframe — one instance is enough). Allow it to read account history.
2. List your EAs
In the inputs, describe your EAs with the format Name=magic numbers, separated by ;. Magic numbers accept comma lists and lo-hi ranges:; separates one EA from the next= sits between the EA's name and its magic number(s), lists several magicslo-hi covers a whole range (e.g. 260126-260140) There are several EA fields (EAs 1–7) so you can keep large fleets organized. To include your manual trades as their own row, add:
3. Set the default range
Use History days for the default look-back, or just click the range chips / custom-range picker on the panel at any time.
4. (Optional) Position & refresh
Adjust Panel X / Y to place it, and the Refresh interval (seconds). The font is fixed to Arial for consistent rendering across terminals. Interacting with the panel
Click an EA row or the balance → open its profit calendar
Click a calendar day → list every trade that day
Click the Today's P/L or This Month tile → the full trade list
Range chips / custom picker → re-scope every figure
− minimize / □ expand (top-right corner)