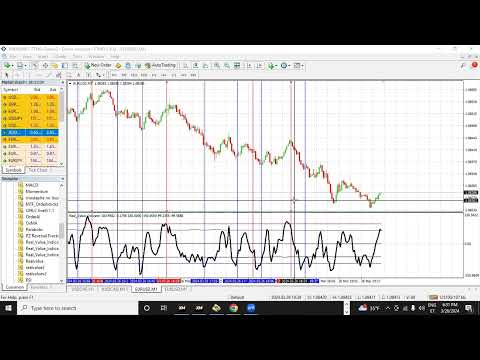
RealValueIndicator EURUSD

Indicator: RealValueIndicator

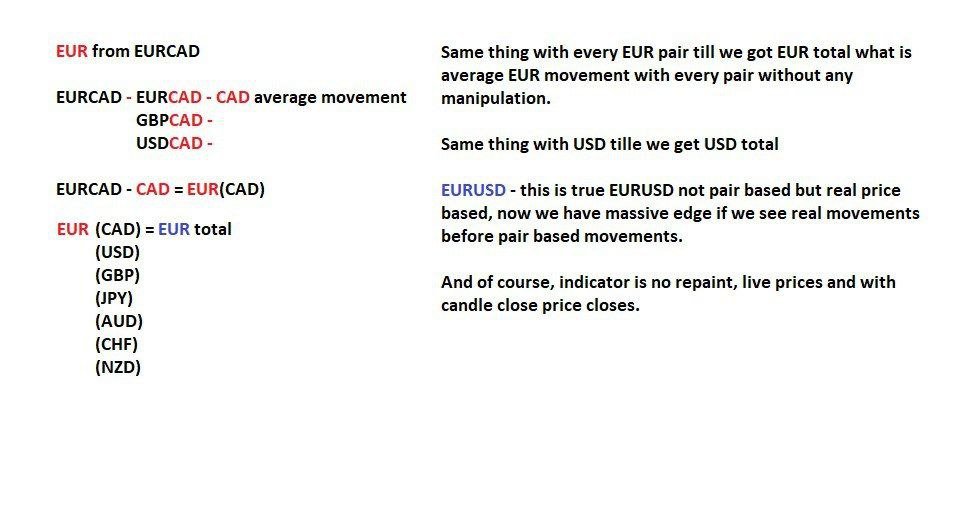
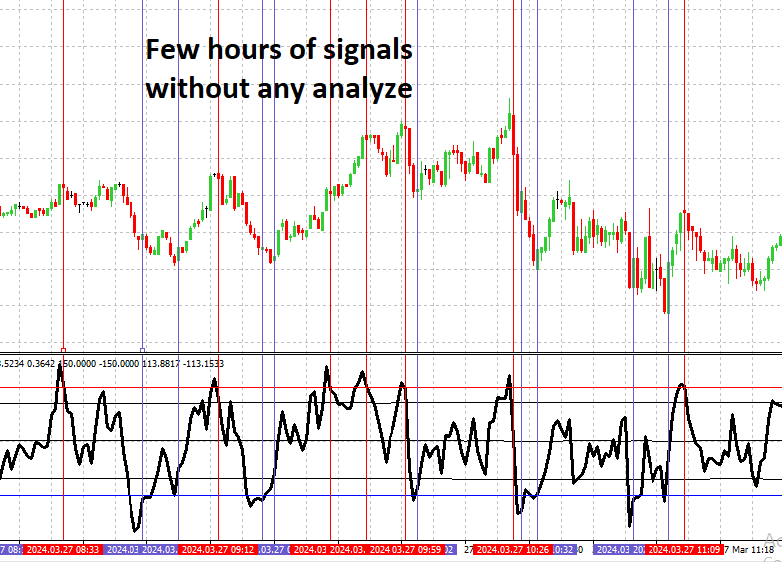
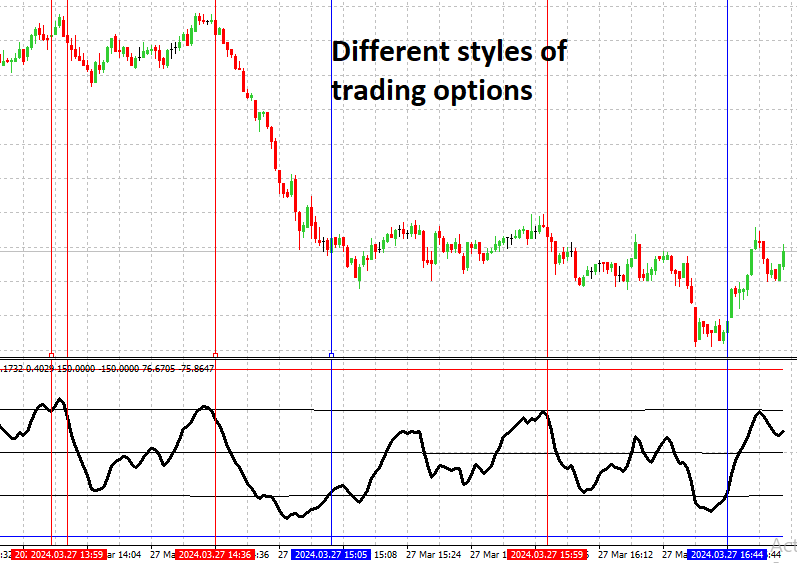
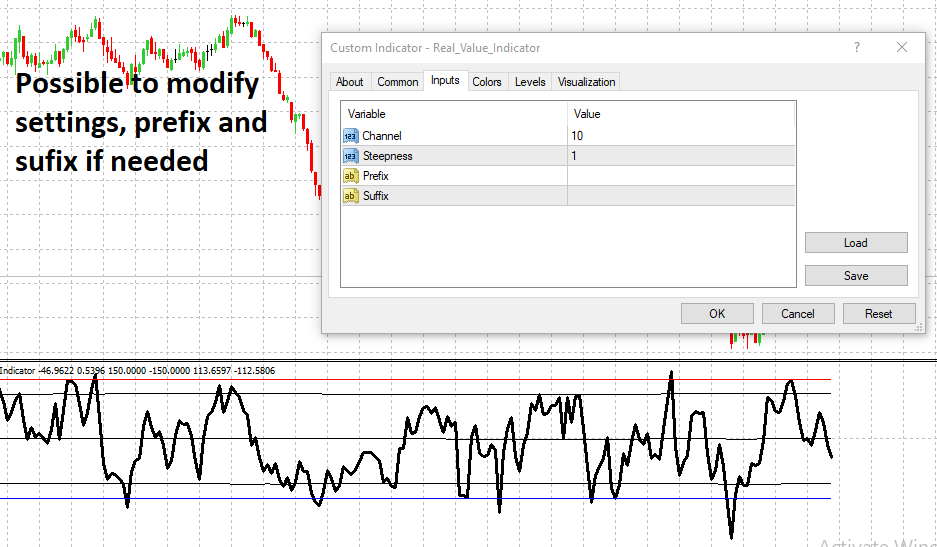
Description: RealValueIndicator is a powerful tool designed specifically for trading on the EURUSD pair. This indicator analyzes all EUR and USD pairs, calculates their real currency strength values, and displays them as a single realistic value to give you a head start on price. This indicator will tell you moves before they happen if you use it right. RealValueIndicator allows you to get a quick and accurate overview of the EURUSD currency pair tops and bottoms, helping you make more informed trading decisions.

Features:

  • Powerful tool designed specifically for trading on the EURUSD pair.

  • Analyzes all EUR and USD pairs to calculate real currency strength values.

  • Displays a single realistic value that predicts EURUSD movements before they happen.

  • Suitable for both beginners and experienced traders

  • Works in all market conditions


Recommended useage:

I recommend using it for three months initially: spend the first month simply exploring various timeframes, sessions, and strategies to identify the most suitable ones for you. During the second month, focus on thorough testing of the system and refining it according to your needs. In the third month, try applying your knowledge on a demo account and monitor the results. In the first month, you may not gain a complete understanding of the capabilities of this powerful tool, so it's important to give yourself time for thorough exploration and utilization.
おすすめのプロダクト
Towers - Trend indicator, shows signals, can be used with optimal risk ratio. It uses reliable algorithms in its calculations. Shows favorable moments for entering the market with arrows, that is, using the indicator is quite simple. It combines several filters to display market entry arrows on the chart. Given this circumstance, a speculator can study the history of the instrument's signals and evaluate its effectiveness. As you can see, trading with such an indicator is easy. I waited for an a
The strategy of the adviser is based on the theory of falsals: a fractal is a set that has the property of self-similarity (an object that exactly or approximately coincides with a part of itself, that is, the whole has the same shape as one or more parts). A trading expert analyzes four fractal orders of price formations - one fractal order down, the fractal order of the current timeframe and two orders of fractals higher than the timeframe. Recommended trading tools for the default settings
This indicator is designed for scalping on low timeframes (M1-M15) in volatile markets like major forex pairs (e.g., EURUSD, GBPUSD). It generates non-repainting buy (green up arrow) and sell (red down arrow) signals based on EMA crossover confirmed by RSI momentum and MACD crossovers, minimizing false signals in ranging markets. How to Use: Attach the indicator to your MT4 chart. Look for arrows on the chart: Buy on green up arrow, Sell on red down arrow. Signals appear at the open of the new
ギャラクティックボリュームスプレッド分析(VSA)は、ボリュームを視覚化するために設計されたインジケーターであり、異なるペアのスプレッドのボラティリティに影響する割合です。 戦略は以下から構成されます。 ブルトレンド: 常にトレンドに賛成し、Galactic VSAインディケーターによって示される高ボリュームと一致する限り、トレンドの低価格でのオープン購入オペレーション。 下降トレンド: 常にトレンドに賛成し、トレンドの高値でオープンな営業活動を行います。ただし、Galactic VSAインディケーターによって示される高ボリュームと一致します。 優先ペア: EURUSD、GBPUSD、USDJPY H1未満の時間枠を推奨するのではなく、スイング取引でインジケーターをテストしました。 
CVD ダイバージェンス検出 - 高度なボリュームデルタ分析   我々が解決する問題 ほとんどのトレーダーは価格アクションのみに依存し、真の市場センチメントを明らかにする重要なボリュームフロー情報を見逃しています。従来の指標は価格の動きに遅れをとり、エントリーが遅れ、リスク管理が不十分になります。CVD ダイバージェンス検出は、価格とボリュームデルタモメンタムの関係を分析することでこれを解決し、大きな市場の動きの前に早期警告信号を提供します。   CVD ダイバージェンス分析の利点   早期市場反転検出   - 価格チャートに現れる前にモメンタムシフトを発見   スマートマネー追跡   - 機関投資家がいつ蓄積または配布しているかを確認   偽シグナル削減   - ボリュームが価格の動きを確認し、より高い確率のセットアップを提供   マルチタイムフレームの優位性   - スキャルピングからスイングトレーディングまで全ての時間枠で機能   汎用的な応用   - FX、株式、商品、暗号通貨に対応   4つの市場フェーズ - 実際のトレーディングストーリ
BinaryScalping is a professional indicator for trading binary options and scalping. The algorithm of the indicator is based on the calculation of pivot points for each time period separately, the location of the price of the trading instrument relative to the pivot points is analyzed and the probability of a trading operation is calculated. The indicator has a built-in filter of trading signals based on the global trend. The indicator is installed in the usual way and works with any trading inst
このトレーディングボットは、金融市場(例えば、外国為替市場)におけるテクニカル分析で最も人気のある戦略の一つである 需要と供給 戦略に基づいています。この戦略は、サポートとレジスタンスの重要なゾーンを特定するために使用されます。以下に、その基本原則とボットの動作について説明します。もちろんです!翻訳は以下の通りです: 「ナチュラルガスの30分足で優れたパフォーマンスを発揮し、最低資金は1600ユーロです。」 需要と供給戦略の基本原則: 需要ゾーン :これは、資産(例えば、通貨ペア)の需要が供給を上回り、価格が上昇する価格チャート上の領域です。チャート上では、これらのゾーンは通常、最近の安値付近に位置しています。 供給ゾーン :これは、資産の供給が需要を上回り、価格が下落する価格チャート上の領域です。チャート上では、これらのゾーンは通常、最近の高値付近に位置しています。 ゾーンの認識 :ボットは、過去の価格を特定のバー数( LookBackBars パラメータで定義)にわたって分析し、それぞれ需要ゾーンと供給ゾーンを表す最低および最高の価格レベルを特定します。 ボットの動作: ゾーン
Gold Trader Pro Indicator
Massimiliano Tuzzolino
4.33 (6)
Gold Trader Pro is an advanced analytical tool specifically engineered for professional trading on XAUUSD (Gold). It provides an immediate comprehensive overview of market structure across 7 different timeframes, allowing traders to identify flow direction and signal strength through a modern, draggable, and interactive interface. Key Features Multi-Timeframe Analysis: Real-time monitoring of M1, M5, M15, M30, H1, H4, and D1. Two Operational Modes: MODE_SCALPING: Optimized for fast-paced analys
FREE
価格グリッドナビゲーターインジケーター 価格グリッドナビゲーターは、トレーダーが主要なサポートレベルとレジスタンスレベルを動的に特定できるように設計された、強力で直感的な取引ツールです。潜在的なエントリーポイント、エグジットポイント、そして反転ゾーンを明確に視覚的に表示するため、経験レベルを問わずトレーダーにとって不可欠なツールとなっています。これらのレベルを動的に計算・描画することで、このインジケーターは潜在的なエントリーポイント、エグジットポイント、そして反転ゾーンを明確に視覚的に表示します。外国為替、指数、コモディティなど、どのような取引でも、このツールは動的な原則の適用を簡素化し、正確かつ自信を持って情報に基づいた取引判断を下せるよう支援します。 メリットと機能 1. 正確なサポートレベルとレジスタンスレベル: このインジケーターは、現在の価格帯に基づいて主要な価格レベルを動的に計算・描画することで、正確性と関連性を確保します。 2. カスタマイズ可能な期間: Pパラメーターを使用すると、最高値と最安値を計算する期間を調整できるため、さまざまな取引スタイルや時間枠に適応で
FREE
CM = "DMF_AI_EA_ROBOT"; Strategy = 1   ElapsedSECONDS = 7 MaxDailyProfit = 3500 MaxDailyLoss = - 1500 MaxMonthlyProfit= 10000 LS= 1.3 CSL= 1.3   ESL= 1.3   PF= 50   STP= 50 CPF= 50 TND= 50 Lot= 150 BLS= 150 CLS= 150 TradingBetween = 16 : 30 - 23 : 30 Risk_Triger=+ 010 Mg = 2001   MAX Range Allowed = 100000   Bars For Range =     1 ️️  backtesting parameters provided Above; for ftmo broker only, account size 100K, Pair USTECHCASH100 Timeframe= H1 or H4. for other brokers and pairs contact supp
[ MT5 Version ]  [ Kill Zones ]  [ SMT Divergences ] Order Blocks ICT Multi TF - FVG-Confirmed Order Blocks for MT5 Most ICT order block indicators for MT5 turn every opposite candle into an order block. The chart fills up and the label stops meaning anything. Order Blocks ICT Multi TF uses Fair Value Gap confirmation and monitors up to four timeframes from one chart. It is built for traders who want a defined reason for the block, not another coloured rectangle. GIVE THE BLOCK A REASON TO MATTE
Introduction This Expert Advisor is designed for automated trading on the BTCUSD symbol using the M15 timeframe. It utilizes the Ichimoku Kinko Hyo indicator framework combined with a multi-timeframe synchronization logic. Strategy and Features The core logic involves a trend filtering system that analyzes H1 and H4 price structures to ensure alignment with the M15 entries. The EA identifies breakouts using a 6-bar lookback period to minimize market noise. Additionally, it incorporates the Aver
FREE
BinaryUniversal is a signal indicator for binary options and Forex. In its work, the indicator uses a complex algorithm for generating signals. Before forming a signal, the indicator analyzes volatility, candlestick patterns, important support and resistance levels. The indicator has the ability to adjust the accuracy of the signals, which makes it possible to apply this indicator for both aggressive and conservative trading. The indicator is set in the usual way, it works on any time period and
The MelBar HedgeScalper FinTech RoboTrader MAXIMUM LOTSIZE : 100 Lots (US$10,000,000) per TRADE/POSITION FULLY TRIED, TESTED, PROVEN & VERIFIED ON A REAL LIVE TRADING ACCOUNT! TRY OUT THE DEMO! The Experienced Trader & Global Money Manager Version. 89% Trade Winning Percentage. 32.679% Profit Gain or ROI in 2 Trading Days. Profit Factor 3.59 Average Trade Length 1h 22m. The MelBar HedgeScalper FinTech RoboTrader is easy to use. Has the Advantage of Retiring Unnecessary "Debt" Positi

Supertrend Professional は、Supertrend インジケーターに基づいた MetaTrader 4 用エキスパートアドバイザーです。ドイツ指数(GER30/GER40/DAX)のトレンドフォロー取引用に設計されています。 FTMO コンプライアンス EA はプロップファーム(FTMO、The Funded Trader など)のルールに従ってドローダウンを計算します: - デイリードローダウンは FTMO の要件どおり、MAX(残高、有効証拠金)を計算基準として使用 - 基準残高は毎日深夜に自動更新 - 制限に達した時点ですべてのポジションを自動決済 - ファンデッドアカウントでの運用や、プロフェッショナルなリスク管理ルールの遵守に最適 機能 EA には以下の機能が含まれています: - 内蔵 Supertrend インジケーター(外部依存なし) - 設定可能なドローダウン制限(日次および合計)、FTMO 準拠の計算 - 自動ブレイクイーブン機能 - プログレッシブトレーリングストップ - オプションのマーチンゲールシステム(倍率と最大ステップ数を
Gemini Trump EA represents a sophisticated advancement in grid trading systems. Unlike traditional methods that rely on fitting the system to historical data, Gemini Trump EA is engineered to exploit existing market inefficiencies, leveraging authentic market dynamics. Gemini boasts an impressive array of features designed for both convenience and performance. With its One Chart Setup, you can trade all supported symbols using a single chart, while its Multi-Currency Support seamlessly handles m
This is the binary options signal you all have been looking for. This in a modified version of the Garuda Scalper, that has been modified for Binary Options traders. Signals are very unique! Why this is so effective for binary options is because  it is a trend following system, it understands that the trend is your friend. It takes advantage of the buying/selling after the pullback in continuation of the current trend wave.  Because  signals are generated after the pullback,   you can place shor
Smart Reversal Signal  is a professional indicator for the MetaTrader 4 platform; it has been developed by a group of professional traders. This indicator is designed for Forex and binary options trading. By purchasing this indicator, you will receive: Excellent indicator signals. Free product support. Regular updates. Various notification options: alert, push, emails. You can use it on any financial instrument (Forex, CFD, options) and timeframe. Indicator Parameters Perod - indicator calculat
Alpha Trend signは私たちの取引システムを検証し、取引信号を明確に提示し、信号がドリフトすることはありません。 主な機能: •市場が活況を示している地域に応じて、指標に基づいて現在の相場がトレンド相場に属しているか、それとも揺れ相場に属しているかを直感的に判断することができる。 そして、指標の指示矢印に基づいて市場に切り込み、緑の矢印は購入を提示し、赤の矢印は販売を提示する。 •小周期変動による頻繁な取引信号の発生を回避するために、5分以上の時間周期で取引を行うことを推奨します。 •最適な取引タイミングを逃さないために、シグナルプロンプトをオンにすることもできます。 •本指標はトレンド相場をよく予測するだけでなく、幅広振動相場でも利益を得ることができる。 •本指標は大道至簡の原則に基づいており、異なる段階のトレーダーが使用するのに適している。 注意事項: •Alpha Trend signには明確な入退場信号があり、損失を与えないように逆位相操作を提案しない。 •Alpha Trend signは特に成熟した指標であり、デルのチー
新しいエキスパートアドバイザー「BitcoinRobotTradingEA」をご紹介します。このEAは、市場分析においてトレンド追従のコンセプトを採用し、トレンドに基づいてトレード全体を最適化します。取引エントリー時に市場トレンドを正確に分析するだけでなく、市場のオーダーフローに加え、オーダーブロックゾーンも考慮することで分析精度を高めています。そのため、このEAは金融市場における最高の製品の一つとされています。このEAの開発に使用されているアルゴリズムは、エントリーとフローティングマイナスの管理の両方において信頼性の高いアルゴリズムです。 このEAは、M15時間枠で使用されるビットコイン仮想通貨ペアでの使用を想定して設計されています。 BitcoinRobotTradingEAは、短期間で大きな利益獲得の可能性を求めるトレーダー向けに設計された高性能なトレーディングロボットです。適応型の利益確定と損切りメカニズムを採用し、優れたトレーリングストップ機能を備えているため、利益の管理と確保が容易で、市場の状況に動的に対応します。 長年にわたる過去の最適化に基づいて構築されたこの戦
BinaryIndicator is a highly accurate indicator for trading binary options. It shows excellent results in scalping. This indicator is based in multifactor analysis of trend indicators, as well as confirmation oscillators, which in the end gives an increased accuracy of signals. Advantages of the indicator Increased accuracy of signals. Excellent results when trading binary options with a short expiration time from M30 to M1 . It works on any timeframes. Works with any trade symbols. Parameters
ブレイクアウトプロスカルパーソリューション このインジケーターはRPTradeProSolutionsシステムの一部です。 Breakout Pro Scalper Solutionは、プライスアクション、ダイナミックサポート、レジスタンスを使用した毎日のトレンドインジケーターです。 誰でも使用できるように設計されており、トレーディングの初心者でも使用できます。 決して塗り直さないでください。 表示は近いものから近いものへと示されます。 単独で使用するように設計されているため、他のインジケーターは必要ありません。 一日の初めにトレンドと潜在的なテイクプロフィットを提供します。 特定のグラフは、履歴データによる潜在的な利益を示しています。 どのように機能しますか Breakout Pro Scalper Solutionは、価格アクションと動的なサポートおよびレジスタンスを組み合わせたブレイクアウト戦略を使用しています。 夜のトレンドとボラティリティが分析され、翌日に使用されます。 この分析から、ブレイクアウト制限(青と濃いオレンジの線)とTakeProfitが決定されます チャ
Jeslyn
Justine Kelechi Ekweh
これは、スキャルパー システムまたは非常に強い勢いに乗る戦略として、FX マニュアル トレーダー、バイナリー オプション トレーダー、または自動取引でユニバーサル EA によって使用される両方に適した多目的システムです。 これは、スキャルパー システムまたは非常に強い勢いに乗る戦略として、FX マニュアル トレーダー、バイナリー オプション トレーダー、または自動取引でユニバーサル EA によって使用される両方に適した多目的システムです。 Jeslyn は長年の研究に基づいた戦略であり、特定の価格アクション戦略に焦点を当てています。シンプルな矢印インジケーターのように見えるかもしれませんが、洗練された論理的なアルゴリズムが組み込まれています。他の指標から計算を引き出すのではなく、価格変動のみに基づいて計算します。トレンド、勢いとの違い、ダイバージェンスと出来高スプレッド分析の関係を解釈する方法を見つけました。勢いよくポジションが埋まるミニ供給ゾーンと需要ゾーンがあり、これらは開始時に私たちが希望する場所です。また、メタトレーダーでは実際の出来高を取得できないとも言われていますが
Simple Trades Simple Trades  EA scalps the intra-day price movement in the direction of trend.  Timeframe:  The time frame it is attached to is irrelevant. It takes its calculations from different time frames. Pair:  It can work on any instrument.  Performance:  EA is a great tool for scalping short and medium price directions. An open position can be on from between 1- 5 days. PARAMETERS 1.  Begin Hr:  Hour of the day you want EA to start scanning the market for trading opportunities. 2.  End
"The trend is your friend" is one of the best known sayings in investing, because capturing large trendy price movements can be extremely profitable. However, trading with the trend is often easier said than done, because many indicators are based on price reversals not trends. These aren't very effective at identifying trendy periods, or predicting whether trends will continue. We developed the Trendiness Index to help address this problem by indicating the strength and direction of price trend
About testing Mode: 1.To get the best usage experience please use the tick data to test and adjust the test speed to proper speed (tick price jump quickly but K bars scroll slowly)!!! 2.Click "Indicator Properties"-> Click "Reset" before testing the indicator to restore the default parameters of the indicator. 1. Compound Drawings (1) Line segment with arrow (2) Continuous line segment (broken line) (3) Parallelogram (4) Polygon (5) Profit and loss ratio measurement tools 2.     Backtracking  
Market Maestro: Your Ideal Partner for Automated Forex Trading If you're looking for a reliable assistant for trading in the currency market, Market Maestro is exactly what you need. This modern Forex bot is built using the latest technologies and algorithms, allowing it to effectively analyze market data and make informed trading decisions in real-time. Key Features of Market Maestro 1. Multicurrency Capability for Broad Opportunities Market Maestro can work with a wide range of currency pairs,
Balanced Costing - shows signals - can be used with an optimal risk factor. The indicator can be used both for pipsing on small periods and for long-term trading. The Balanced Costing trend indicator uses reliable algorithms in its calculations. Shows favorable moments for entering the market with arrows, that is, using the indicator is quite simple. Works on all currency pairs and on all timeframes. Of course, the approach to trading should be complex and in order to make a decision, you shou
Darwin Swing MT4
Guillaume Duportal
4.79 (14)
Darwin Swing MT4 概要: Darwin Swing は中期のスイングトレード向けエキスパートアドバイザー(EA)です。サポート/レジスタンスのゾーンを解析し、仮想ポジションでブレイクアウトを先読みします。実際の発注は、定義済みの条件が満たされたときにのみ行います。 Darwin Evolution の成功に続き、並行稼働が可能な Darwin Swing を紹介します。目標は、長期的な視点で裁量(手動)取引に近い挙動を再現することです。本EAは高速スキャルパーでもナイトスキャルパーでもありません。中核のアプローチは、サポート/レジスタンスに基づくスイングトレードです。 主要な革新点は仮想ポジションの採用です。各通貨ペアについて、トレンド局面で価格が平均して何回 S/R を跨ぐかを推定します。その推定に基づき、日足・週足・月足など複数の S/R 水準に仮想ポジションを配置し、履歴に基づく期待回数に到達した場合のみ実ポジションを発注します。 各ペアにはコード内に専用パラメータを実装。Darwin Evolution 由来の通貨強弱モジュールを併用し、エントリー選別を補強しま
Thai Tea EA
Miss Nathita Kaenmun
Оnly 10 copy out of 10 are Left at $199! Next price -->   $299 This EA includes 4 Strategies inside 1.  Swing trade (Pinbar)  Used Price action Pin bar with CCI Level for entry   Open 1 order have SL/TP   and use ATR for SL  2. Innside bar breakout  Open 2 orders used ATR for SL and have 1TP and No TP2 for Let profit run. 3.    Pullback Used EMA Confirm trend and CCI for Entry Open 2 order used ATR for SL and have 1TP and No TP2 for Let pro 4.   Tripple candle breakout  Open 1 order have SL/TP
このプロダクトを購入した人は以下も購入しています
TrendMaestro
Stefano Frisetti
4 (4)
Attention: beware of SCAMS, TRENDMAESTRO is only ditributed throught MQL5.com market place. note: this indicator is for METATRADER4, if you want the version for METATRADER5 this is the link:  https://www.mql5.com/it/market/product/108106 TRENDMAESTRO ver 2.5 TRENDMAESTRO recognizes a new TREND from the start, he never makes mistakes. The certainty of identifying a new TREND is priceless. DESCRIPTION TRENDMAESTRO identifies a new TREND in the bud, this indicator examines the volatility, volumes a
There is always a need to measure if the market is "quiet" or it is volatile. One of the possible way is to use standard deviations, but the issue is simple : We do not have some levels that could help us find out if the market is in a state of lower or higher volatility. This indicator is attempting to do that : •           values above level 0 are indicating state of higher volatility (=GREEN buffer) •           values below level 0 are indicating state of lower volatility (=RED buffer)
Miraculous Indicator – ガン・スクエア・オブ・ナインに基づく100%非リペイントのFXおよびバイナリーツール この動画では、FXおよびバイナリーオプションのトレーダー向けに特別に開発された、非常に正確で強力な取引ツールである Miraculous Indicator を紹介しています。このインジケーターがユニークなのは、伝説的な ガン・スクエア・オブ・ナイン と ガンの振動の法則 に基づいている点で、現代の取引で利用できる最も正確な予測ツールの一つとなっています。 Miraculous Indicatorは 完全に非リペイント であり、ローソク足が確定した後にシグナルが変化したり消えたりすることはありません。つまり、見たものがそのまま利用できます。これにより、トレーダーは自信を持ってエントリーおよびエグジットを行うための信頼性と一貫性のある根拠を得ることができます。 主な特徴: ガン・スクエア・オブ・ナインとガン理論に基づいて構築 100%非リペイントのシグナルシステム すべての時間枠(M1、M5、H1、H4、日足、週足)で機能 FXおよびバイナリーオプション取引
「 Dynamic Scalper System 」インジケーターは、トレンド波の中でスキャルピング取引を行う手法のために設計されています。 主要通貨ペアと金でテスト済みで、他の取引商品との互換性があります。 トレンドに沿った短期的なポジションオープンのシグナルを提供し、追加の価格変動サポートも提供します。 インジケーターの原理 大きな矢印はトレンドの方向を決定します。 トレンド波の中では、小さな矢印の形でスキャルピングシグナルを生成するアルゴリズムが機能します。 赤い矢印は強気方向、青い矢印は弱気方向です。 トレンドの方向には敏感な価格変動ラインが描かれ、小さな矢印のシグナルと連動します。 シグナルは次のように機能します。適切なタイミングでラインが現れるとエントリーシグナルが形成され、ラインが開いている間はポジションが保持され、完了すると取引が終了します。 推奨される動作時間枠はM1~H4です。 矢印は現在のローソク足に形成され、次のローソク足が開いている場合は、前のローソク足の矢印は再描画されません。 入力パラメータ Trend Wave Period - トレンド方向
Route Lines Prices -は、価格の方向性を予測するために設計されたインジケーターです。シンプルなインターフェースには、価格変動と将来の方向性を計算するための複数のアルゴリズムが搭載されています。これらのアルゴリズムには、使用する時間枠に基づいたボラティリティ計算と価格平滑化が含まれています。 このインジケーターには、「 Calculating price values 」値を変更するためのパラメーターが1つだけあります。デフォルト値の1は、バランスの取れた自動計算を提供し、インジケーターを手動で設定することなく使用できます。 値を2から500まで手動で変更することで、インジケーターを独自のトレーディングシステムに合わせてカスタマイズできます。 このインジケーターは、M1からH4の時間枠での使用を推奨します。あらゆる取引銘柄で使用できます。 シグナル矢印はローソク足の終値で生成され、過去の履歴には再描画されません。 メインチャートには、重複した矢印が表示されます。 複数のアラートタイプが利用可能です。内蔵のライン軌跡カウンターは、終値に基づいて動作します。これ
The indicator is built on a non-standard Zig Zag, it draws accumulations after which if the price leaves this zone and a test of this zone occurs, then a sound signal is given and an arrow appears - after the test candle closes.The indicator does not redraw its signals, it is very easy to use, there are only three settings 1- this is the zig zag parameter 2- this is the minimum price exit from the zone 3- this is the maximum price exit from the zone. The lower the parameter for Zig Zag, the more
Trend Breakout Arrows Indicator The Trend Breakout Arrows Indicator is a momentum-based signal tool designed to identify potential bullish and bearish breakout opportunities. It displays clear arrow signals directly on the price chart, helping traders quickly recognize possible trend changes and continuation setups. Up Arrow (Buy Signal) A magenta up arrow appears below a candle when bullish momentum begins to strengthen. This signal indicates that buying pressure may be overtaking selling press
TRADING STRATEGY GUIDE DELIVERY The full Trading Strategy Guide will be sent directly to you after purchase. Just message me on MQL5 and ask for it — you'll receive it instantly, along with priority support and setup help. Powered Market Scanner for Smart Trading Decisions Keypad Support & Resistance is a next-generation MT4 trading system built for serious traders who demand precision, reliability, and clarity. It combines advanced smart filters with real-time price structure logic to genera
一款信号统计指标(MT4)——实现基于当前图表周期下的单线MA转向和双线MA金叉/死叉统计 . 转向定义:前一K向下或走平,当前K向上,视为转向向上;反之,转向向下。 金死叉定义:前一K快线在慢线下方,当前K快线在慢线上方,为金叉;反之,死叉。 参数及使用说明: 1、可指定统计K线数。 2、可指定4个不同的日内时间段,格式如"03:00-07:59",4个时间段可交叉任意输入。 3、可配置ABC三个浮盈区间段点值。如:分界区间统计小点值设为500,即当某转向信 号出现后到下一反向信号止浮盈<=此点值,计入A区间; 若大于此点值<大分界点值时,计入B区间;若大于“大分界点值”计入C区间。 4、最大/最小浮盈统计。显示所有统计区间内的最大浮盈点值和最小浮盈点值(亏损点值)。 5、输出完整信号,按信号出现顺序排列,如“ACCBCA”之类。 6、综合预测。使用概率、周期、趋势、马尔可夫链等综合概算输出预测该信号出现的归类概率值。 7、加载指定MA线。在当前图表自动载入相应设置的MA线。 8、自适应列宽。以完整显示统计信号数。 9、用法:点击相应统计按钮即输出相应的统计表格.
SYSTEM INTRODUCTION:   The Binary Options Channels System Is Specifically Designed For Binary Options Trading. Unlike Other Systems And Indicators That Were Adopted From Other Trading Environments For Binary Options. Little Wonder Why Many Of Such Systems Fail To Make Money . Many End Up Loosing Money For Their Users.  A Very Important Fact That Must Be Noted Is The Fact That Application Of Martingale Is not Required. Thus Making It Safer For Traders Usage And Profitability. A Trader Can Use Fi
Fxland Price Reversal Zones (MT4) FXLAND Smart Reversal Indicator is a professional technical analysis tool designed to help traders identify potential price reversal zones and key market turning points with clarity and precision. The best reversal indicator and price return by choosing only one ceiling or floor in each time frame A masterpiece of combining mathematics and Gann, fractal matrix, Fibonacci, movement angle and time. Completely intelligent Key Features Detects potential pr


VTrende Pro MT4 - MTF indicator for trend trading with a display panel for MT5 *** Videos can be translated into any language using subtitles (video language - Russian) Although the signals of the VTrende Pro indicator can be used as signals of a full-fledged trading system, it is recommended to use them in conjunction with the Bill Williams TS. VTrende Pro  MT4 is an extended version of the VTrende indicator. Difference between Pro version and VTrende: - Time zones - Signal V - signal 1-2 wave
A scalping indicator based on mathematical patterns, which on average gives signals with relatively small SL, and also occasionally helps to catch big moves in the markets (more information in the video) This indicator has three main types of notifications: The first type warns of a possible/upcoming signal on the next bar The second type indicates the presence of a ready signal to enter the market/open a position The third type is for SL and TP levels - you will be notified every time price re
FFx Engulfing Setup Alerter gives trade suggestions with Entry, Target 1, Target 2 and StopLoss. Below are the different options available: Entry suggestion - pips to be added over the break for the entry 3 different options to calculate the SL - by pips, by ATR multiplier or at the pattern High/Low 3 different options to calculate the 2 TPs - by pips, by ATR multiplier or at Risk/Reward Offset the dashboard - any place on the chart Remove the suggestion once the price reached the SL line Lines
FFx InsideBar Setup Alerter gives trade suggestions with Entry, Target 1, Target 2 and StopLoss. Below are the different options available: Entry suggestion - pips to be added over the break for the entry Minimum candle size - to avoid too close buy/sell entry suggestions 3 different options to calculate the SL - by pips, by ATR multiplier or at the pattern High/Low 3 different options to calculate the 2 TPs - by pips, by ATR multiplier or at Risk/Reward Offset the dashboard - any place on the c
FFx OutsideBar Setup Alerter gives trade suggestions with Entry, Target 1, Target 2 and StopLoss. Below are the different options available: Entry suggestion - pips to be added over the break for the entry. 3 different options to calculate the SL - by pips, by ATR multiplier or at the pattern High/Low. 3 different options to calculate the 2 TPs - by pips, by ATR multiplier or at Risk/Reward. Offset the dashboard - any place on the chart. Remove the suggestion once the price reached the SL line.
FFx PinBar Setup Alerter gives trade suggestions with Entry, Target 1, Target 2 and StopLoss. Below are the different options available: Entry suggestion - pips to be added over the break for the entry Minimum candle size - to avoid too small candles 3 different options to calculate the SL - by pips, by ATR multiplier or at the pattern High/Low 3 different options to calculate the 2 TPs - by pips, by ATR multiplier or at Risk/Reward Offset the dashboard - any place on the chart Remove the sugges
Automatic, live & interactive picture of all trendlines. Assign push, email and sound alerts to the lines of your choice and be informed about price rollback, breakout, rollback after breakout, number of rollbacks, line expiration by double breakout. Correct, drag or delete the lines and interactively tune the line system. https://youtu.be/EJUo9pYiHFA . Chart examples https: //www.mql5.com/en/users/efficientforex Price Interaction Events All events are effective immediately and only after one
The purpose of this new version of the MT4 standard indicator provided in your platform is to display in a sub-window multiple timeframes of the same indicator with its divergences. See the example shown in the picture below. But the display isn't like a simple MTF indicator. This is the real display of the indicator on its timeframe. Here's the options available in the FFx divergences indicator: Select the timeframes to be displayed (M1 to Monthly) Define the width (number of bars) for each tim
The purpose of this new version of the MT4 standard indicator provided in your platform is to display in a sub-window multiple timeframes of the same indicator with its divergences. See the example shown in the picture below. But the display isn't like a simple MTF indicator. This is the real display of the indicator on its timeframe. Here's the options available in the FFx divergences indicator: Select the timeframes to be displayed (M1 to Monthly). Define the width (number of bars) for each ti
The FFx Dashboard MTF alerter will show you on a single chart all the timeframes (M1 to Monthly) with their own status for the indicator. 2 Alert Options: Single timeframe: each selected timeframe alert separately when a signal occurs Multi timeframes: all selected timeframes must agree for an alert to be triggered Both options have an input to select the timeframes to be used for the alert(s). How to Understand the Status: Green/Red square: histogram above/below 0 line Green square + Red bord
The FFx Dashboard MTF alerter will show you on a single chart all the timeframes (M1 to Monthly) with their own status for the indicator. 2 Alert Options: Single timeframe: each selected timeframe alert separately when a signal occurs Multi timeframes: all selected timeframes must agree for an alert to be triggered Both options have an input to select the timeframes to be used for the alert(s). How to understand the status: Green/Red square: RSI above/below 50 line Green square + Red border: R
The FFx Dashboard MTF alerter will show you on a single chart all the timeframes (M1 to Monthly) with their own status for the indicator. 2 Alert Options: Single timeframe: each selected timeframe alert separately when a signal occurs Multi timeframes: all selected timeframes must agree for an alert to be triggered Both options have an input to select the timeframes to be used for the alert(s). How to understand the status: Green/Red square: Stoch above/below 50 line Green square + Red border:
The FFx Dashboard MTF alerter will show you on a single chart all the timeframes (M1 to Monthly) with their own status for the indicator. 2 Alert Options: Single timeframe: each selected timeframe alert separately when a signal occurs Multi timeframes: all selected timeframes must agree for an alert to be triggered Both options have an input to select the timeframes to be used for the alert(s). How to understand the status: Green/Red square: Price above/below Cloud (Kumo) Green square + Red bo
The FFx Dashboard MTF alerter will show you on a single chart all the timeframes (M1 to Monthly) with their own status for the indicator. 2 Alert Options: Single timeframe: each selected timeframe alert separately when a signal occurs Multi timeframes: all selected timeframes must agree for an alert to be triggered Both options have an input to select the timeframes to be used for the alert(s). How to understand the status: Green/Red square: MA pointing Up/Down Green square + Red border: MA po
The FFx Dashboard MTF alerter will show you on a single chart all the timeframes (M1 to Monthly) with their own status for the indicator. 2 Alert Options: Single timeframe: each selected timeframe alert separately when a signal occurs. Multi timeframes: all selected timeframes must agree for an alert to be triggered. Both options have an input to select the timeframes to be used for the alert(s). How to understand the status: Green square: Price above PSAR Red square: Price below PSAR Options
The FFx Dashboard MTF alerter will show you on a single chart all the timeframes (M1 to Monthly) with their own status for the indicator. 2 Alert Options: Single timeframe: each selected timeframe alert separately when a signal occurs Multi timeframes: all selected timeframes must agree for an alert to be triggered Both options have an input to select the timeframes to be used for the alert(s). How to understand the status: Green/Red square: CCI above/below levels (ie. 100/-100) Grey square: C
フィルタ:
レビューなし
レビューに返信