• 概要
  • レビュー
  • コメント
  • 最新情報

RSI Divergence Win Pro

RSI Divegence Win Pro 


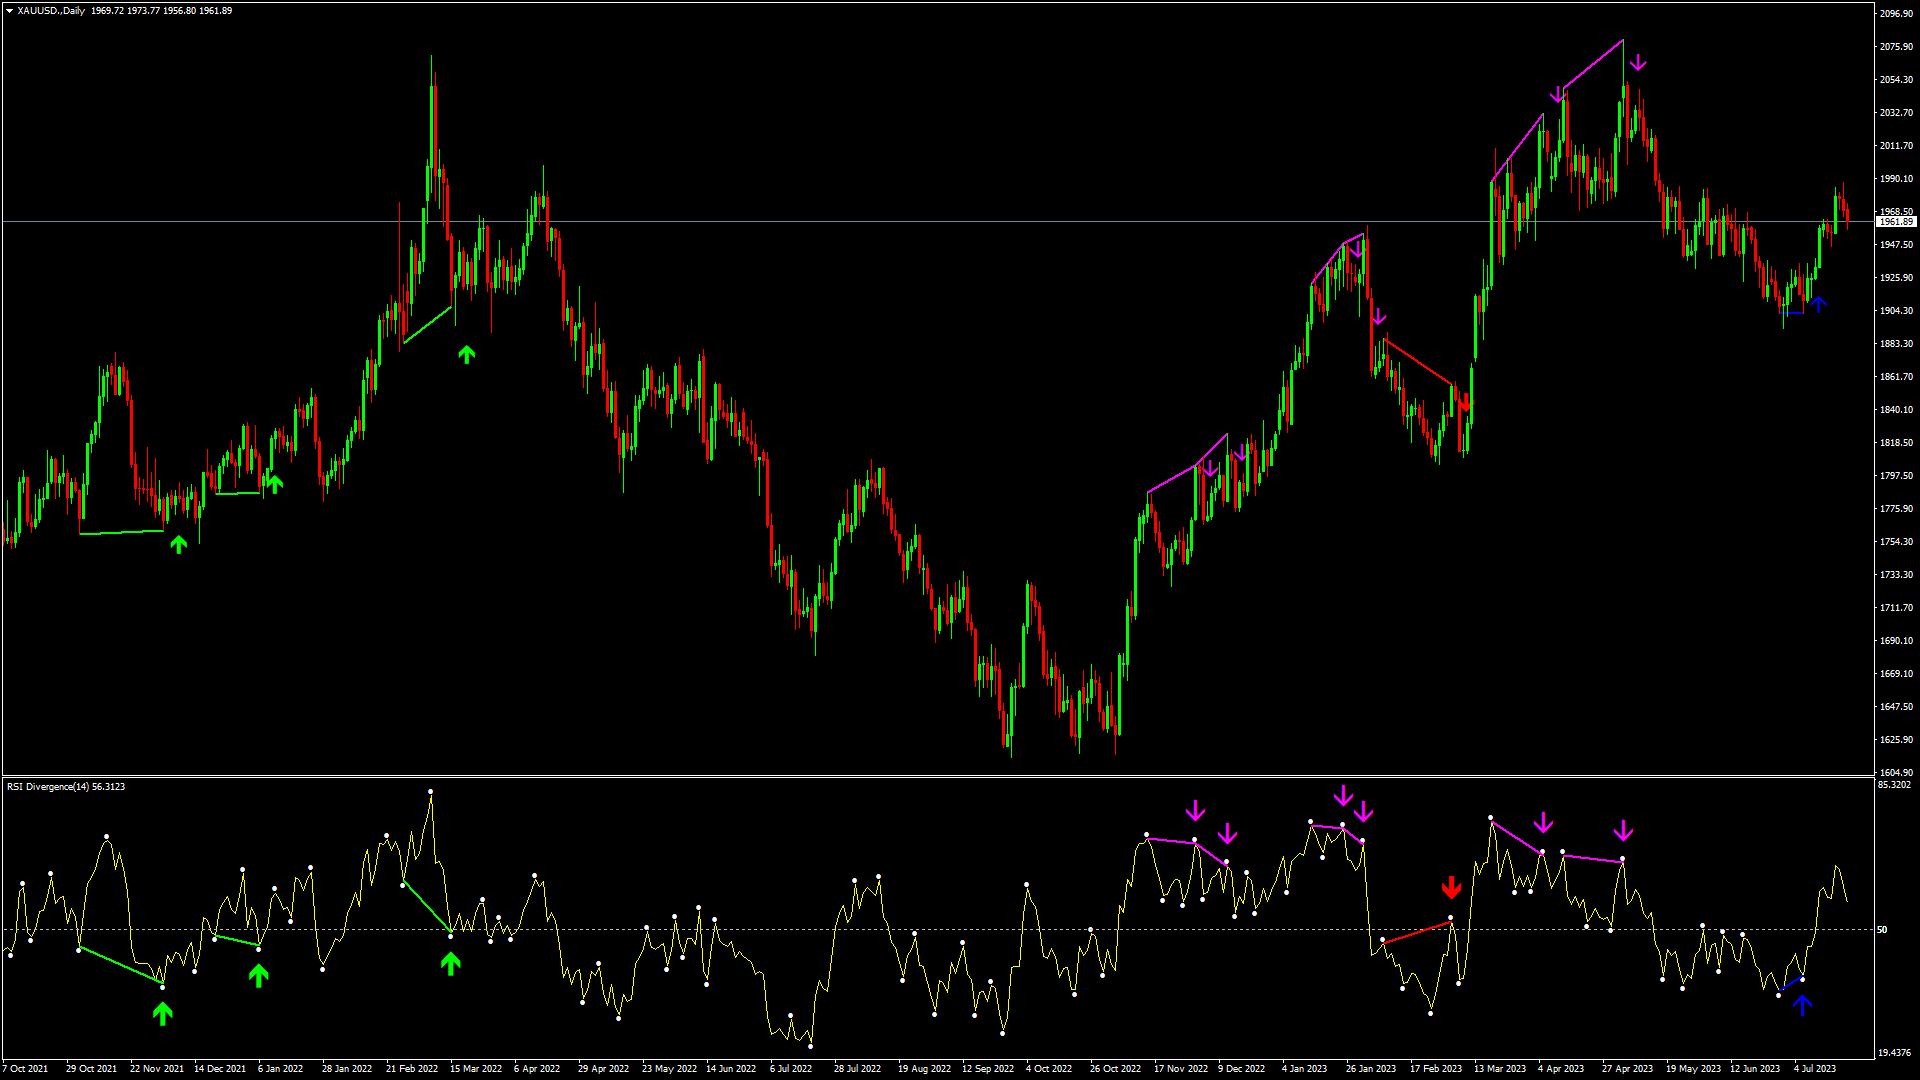
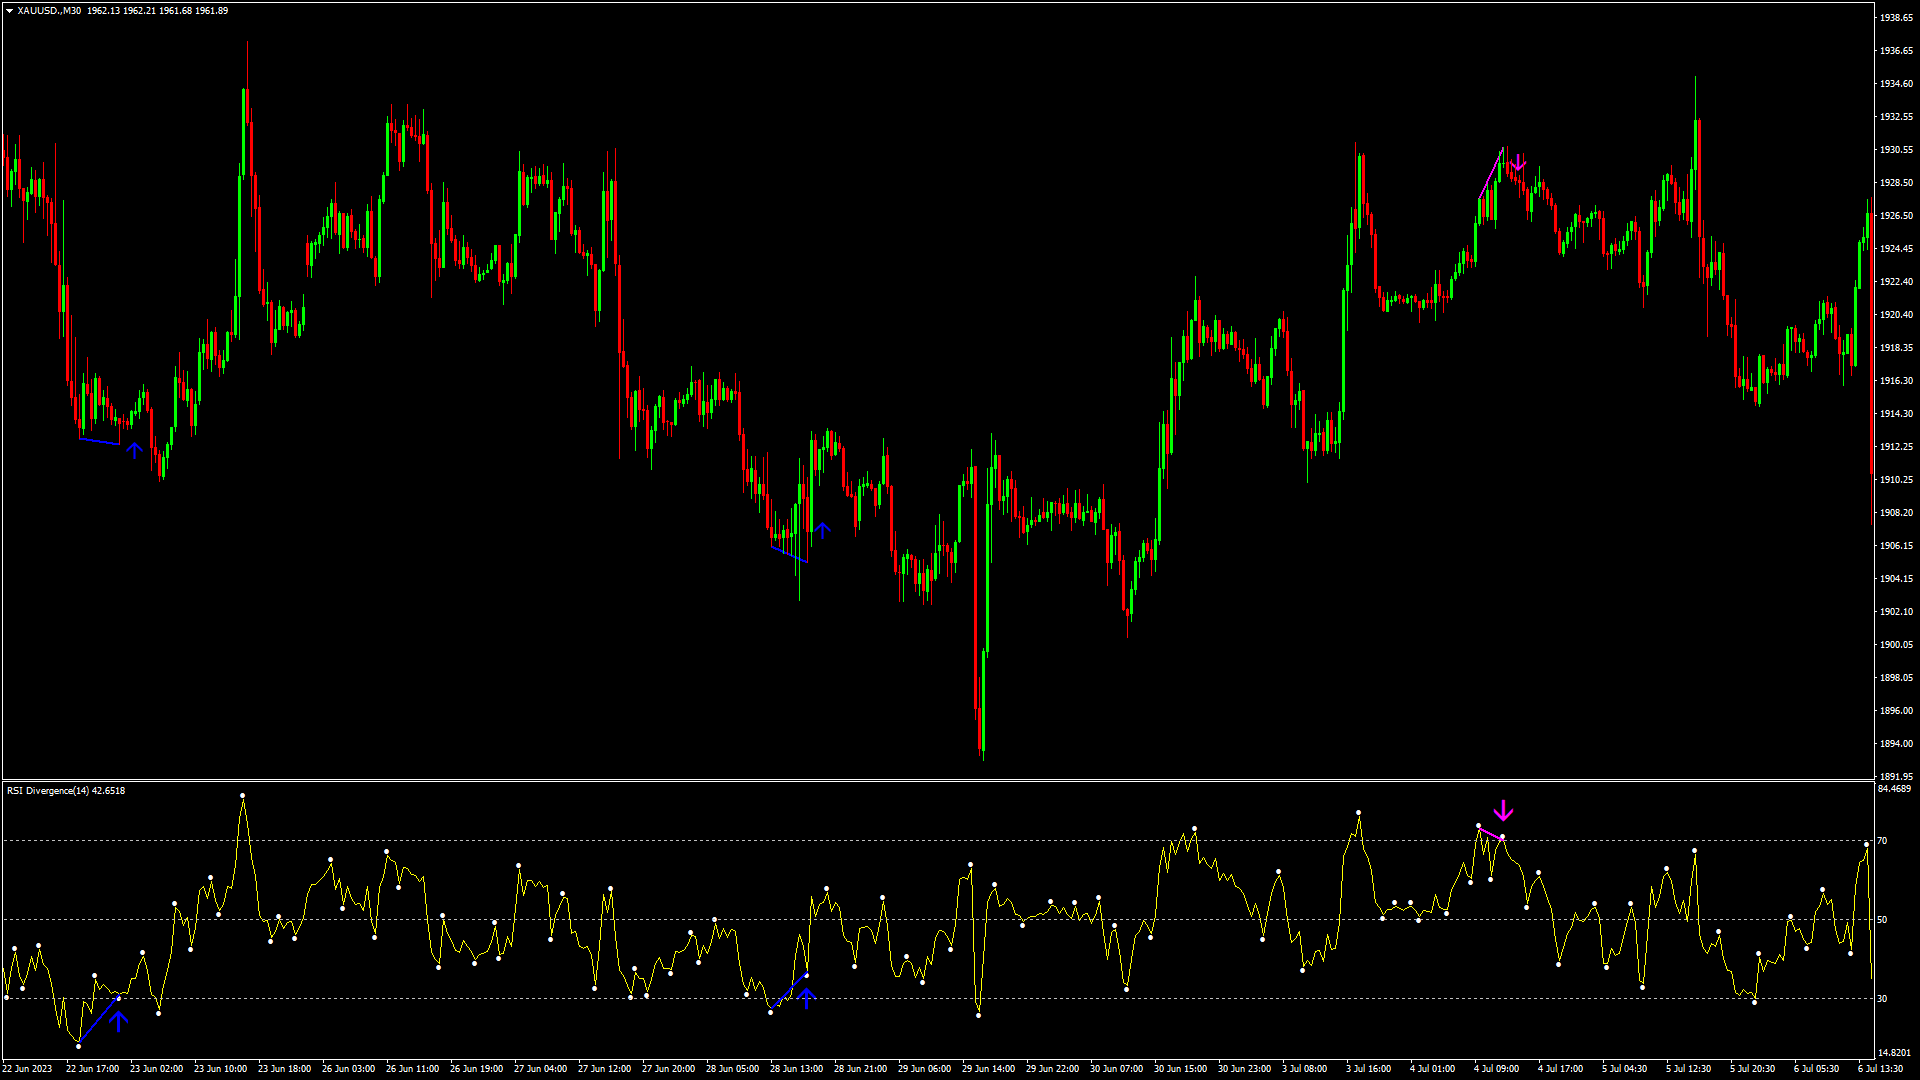
The RSI Drivergent is the best indicator for looking for price reversals.


RSI Drivergent Win Pro has used the strengths and best points of RSI to create in a format for traders to understand more easily.


Suitable for beginners and professional traders.


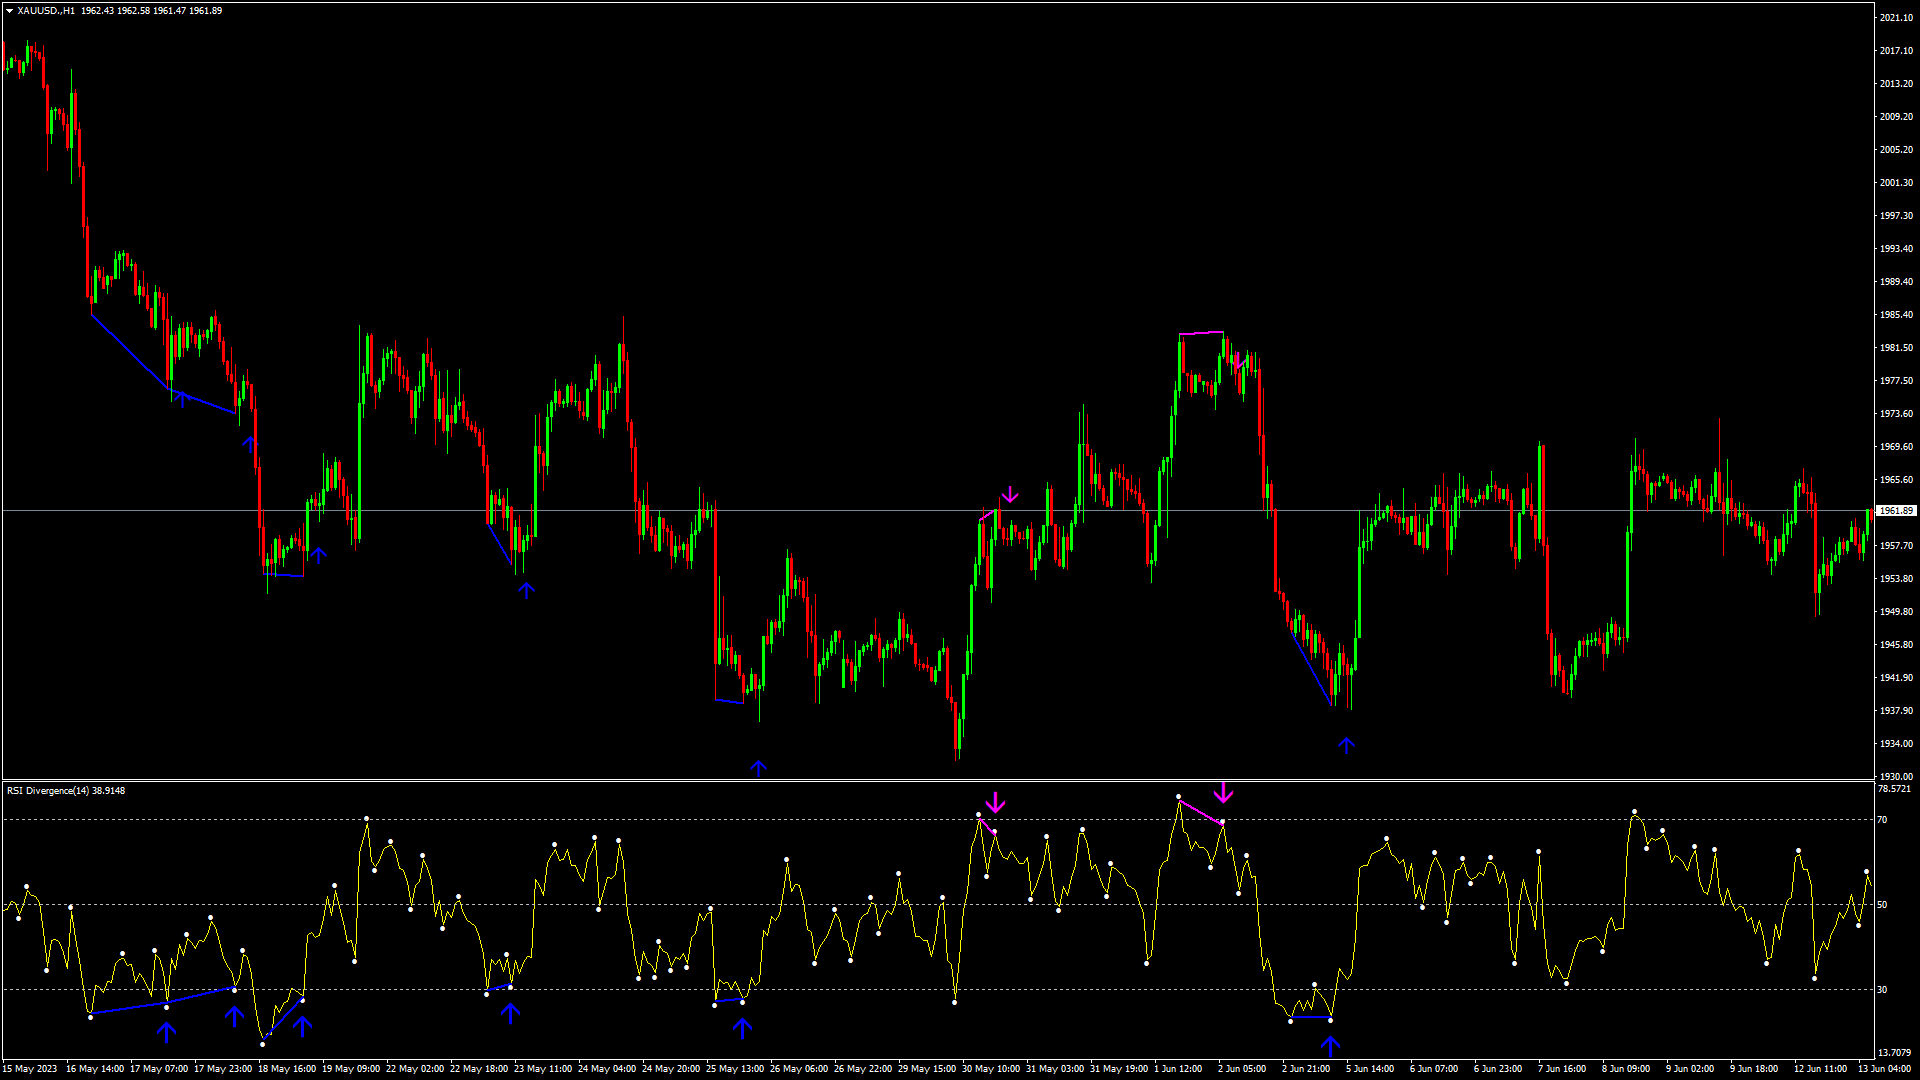
Case Up Trend : Blue line is below Yellow line.

Case Down Trend : Blue line is abve Yellow line.
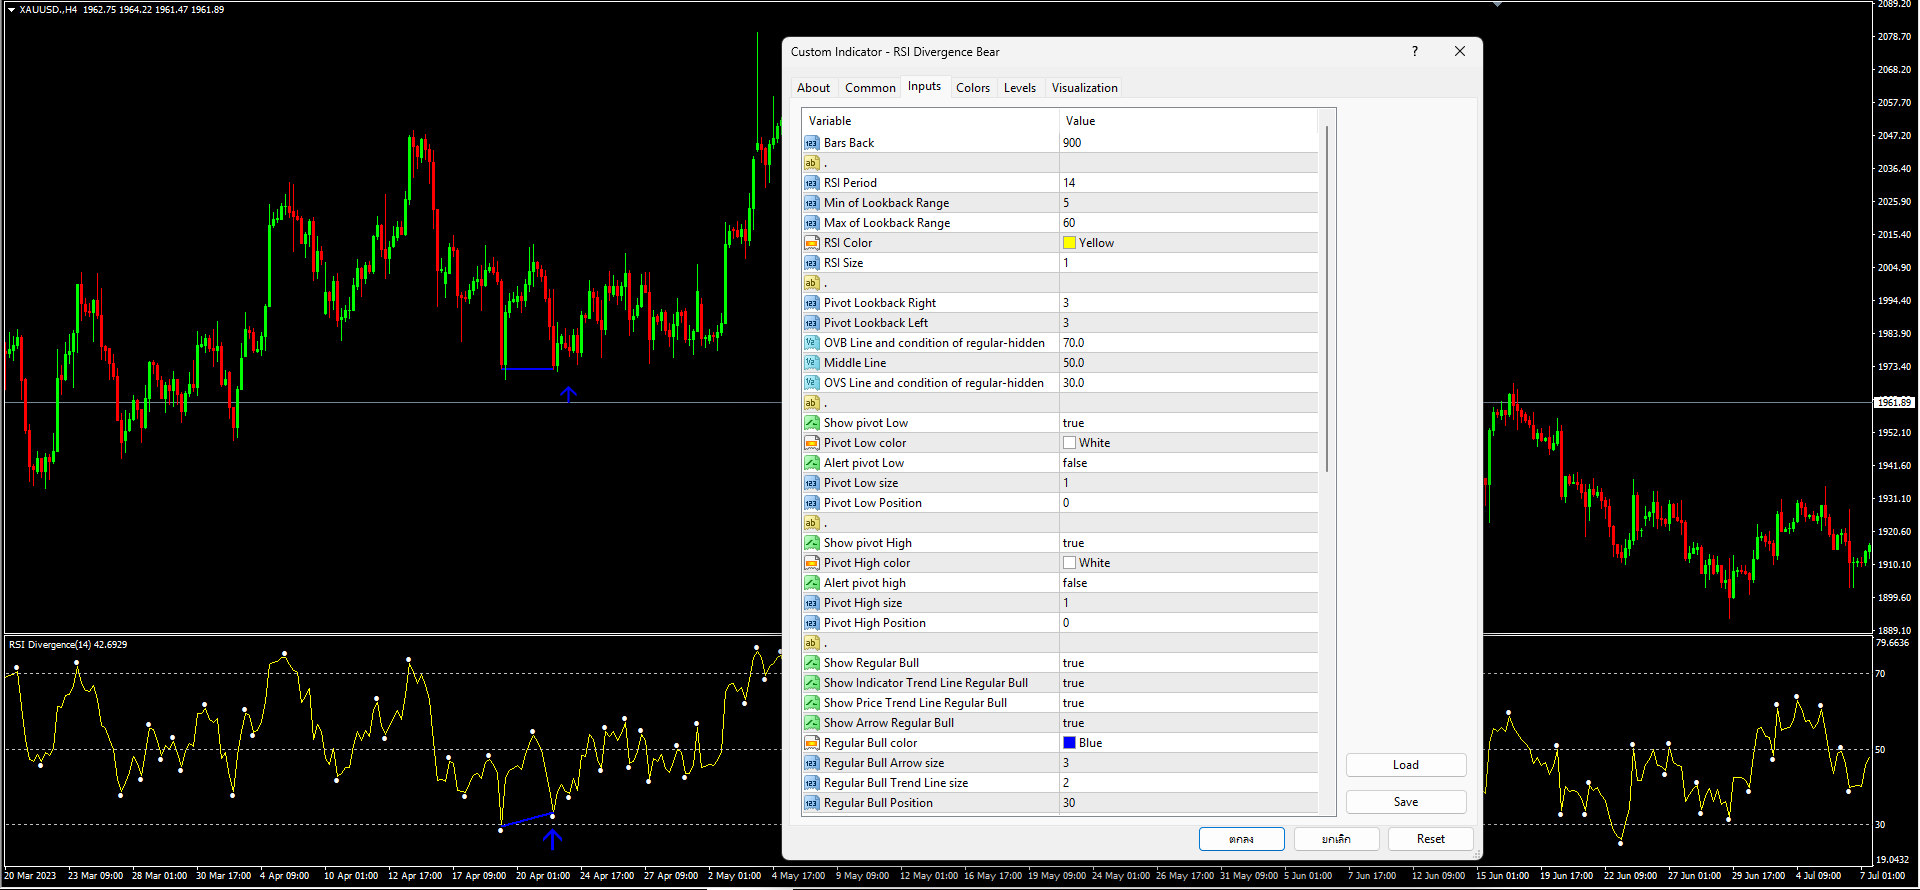


Usage is very easy.

1. Import the indicator into the MT4 chart.

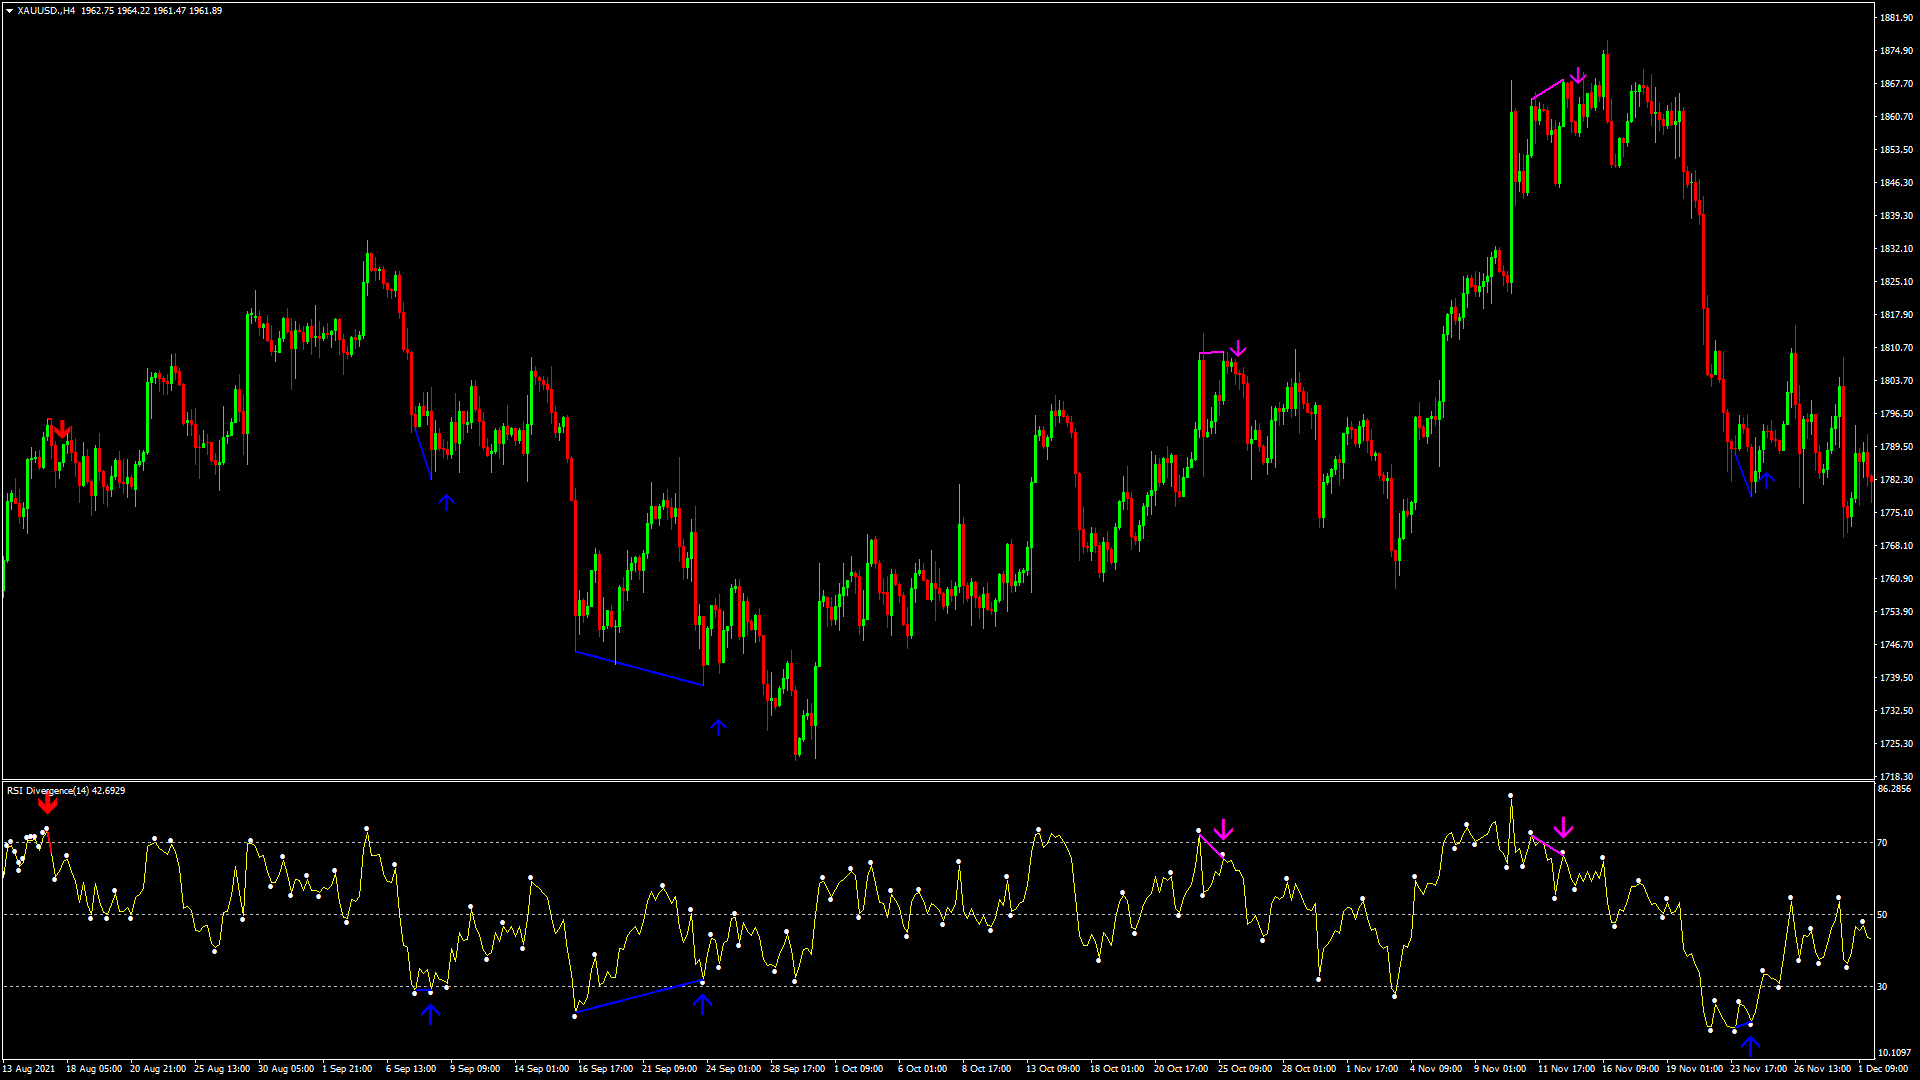
2. Defind Overbought positions and defind oversold positions

3. Wait for the notification signal, then enter the trade after the notification.

4. RSI level 50 take profit position or overbought position or oversold position

5. Stop loss for Long position at the Lowest low price and Stop loss for Short at the Highest high price

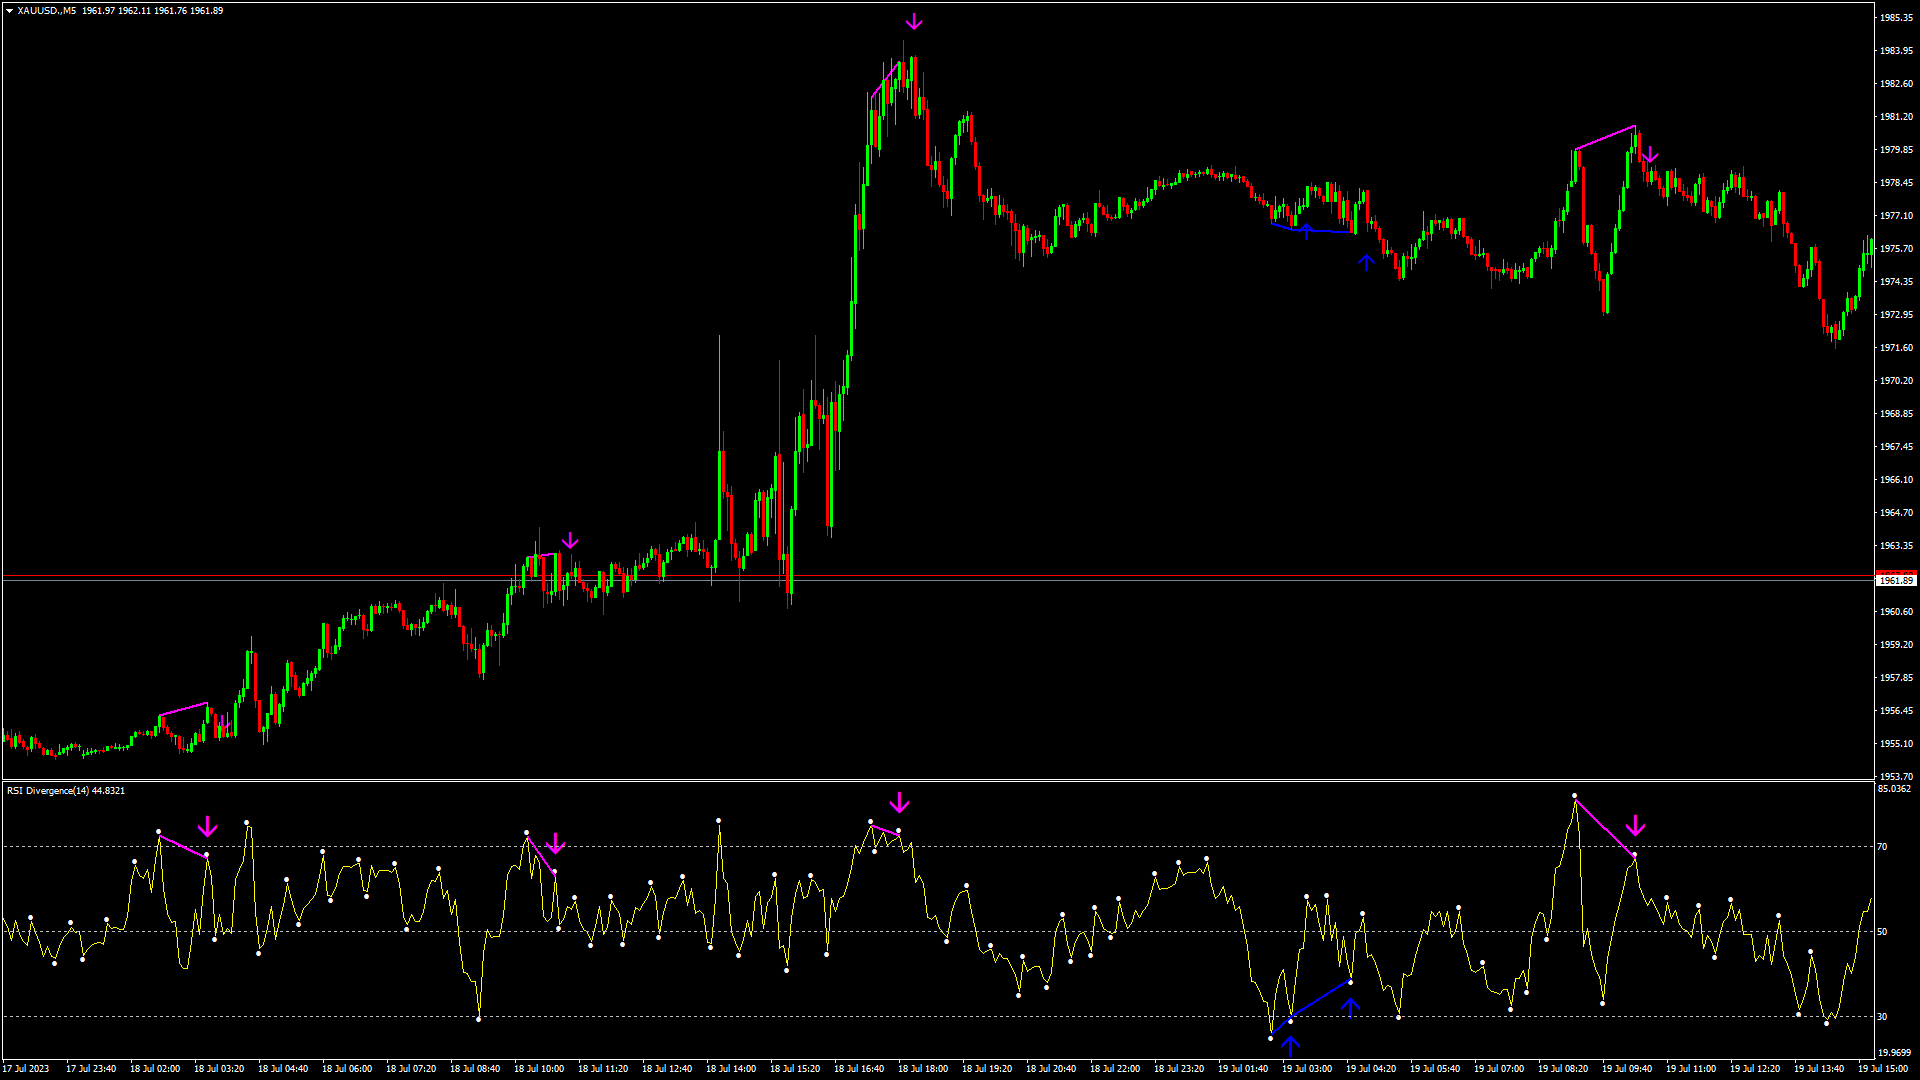
6. If the RSI line Break through the traded position, cut the loss.


Buffer Details :

0 = RSI LINE

1 = Pivot Low

2 = Pivot High

3 = Regular Bull

4 = Regular Bear

5 = Hidden Bull

6 = Hidden Bear

7 = USD Line

8 = RSI Cross Up USD

9 = RSI Cross Down USD

10 = RSIMA LINE

11 = USDMA Line

12 = Buffer Regular Bull

13 = Buffer Regular Bear

14 = Buffer Hidden Bull

15 = Buffer Hidden Bear

16 = RSI Cross Up RSIMA

17 = RSI Cross Down RSIMA


good luck everyone....


おすすめのプロダクト
Indicator for binary options arrow is easy to use and does not require configuration works on all currency pairs, cryptocurrencies buy signal blue up arrow sell signal red down arrow tips do not trade during news and 15-30 minutes before their release, as the market is too volatile and there is a lot of noise it is worth entering trades one or two candles from the current period (recommended for 1 candle) timeframe up to m 15 recommended money management fixed lot or fixed percentage of the depo
WPR by Profile, or WPR for Professionals Geo_WprPro is one of the well-known currency profile indicators. It simultaneously displays two WPR indicators with different parameters in the matrix form on all timeframes of multiple currency pairs forming the currency profile . As follows from the description, " WPR is a leading indicator that often goes ahead of the price chart. The oscillator frequently reaches extreme values before the price reversal as if anticipating that event: it almost always
ShinZuka
Muhammad Asyraf Bin Mohamad
Using MACD value for direction. Using RSI as reversal indicator. Using open trading hour. (Recommend Hour 10,11,15 & 19 : MT4-Time) Counter trade if signal failed. Cutloss trade if signal failed. Auto lot calculate based on target profit & takeprofit. Able to set counter trade value. Suitable for commodities & currency.  Timeframe H1. Able to set limit lot open. Able to select day to trade.
GOAL TIME is an expert advisor based on the notion of time, it studies the change of price according to time, and it finally detects the best time to execute a good order. The EA is based on an indicator that draws a price curve in relation to time, this curve is deduced by an algorithm that analyzes old data. Then, the EA exploits the generated curve and executes the correct order. In case of incorrect choice, the EA has the mission to limit the losses. After a thorough study of this strategy o
Santa Scalping
Morten Kruse
3.05 (21)
Santa Scalping is a fully automated Expert Advisor with no use of martingale. Night scalping strategy. The SMA indicator filter are used for entries. This EA can be run from very small accounts. As small as 50 EUR. General Recommendations The minimum deposit is 50 USD,  default settings reccomend for eurusd m5 gmt +2 . Please use max spread 10 if you will not have orders change it to -1. Use a broker with good execution and with a spread of 2-5 points. A very fast VPS is required, preferably
Black series MT4 - The indicator is designed for trading on binary options with Timeframe M1-M5-M15 Multicurrency (Works on cryptocurrency and currency pairs) The signal appears when the candle opens Up to 90% correct signals There is no signal redrawing at all Can be used with other indicators. Good for scalping! In Settings there is: -Indicator working methods -I Allert Arrow color Red signal down Blue signal up Also watch the video how the indicator works and signals
Magic EA MT4
Kyra Nickaline Watson-gordon
3 (1)
Magic EA is an Expert Advisor based on Scalping, Elliot Waves and with filters such as RSI, Stochastic and 3 other strategies managed and decided with the robot smartly. Large number of inputs and settings are tested and optimized and embedded in the program thus inputs are limited and very simple. Using EA doesn't need any professional information or Forex Trading Knowledge. EA can trade on all symbols and all time frames, using special and unique strategies developed by the author. The EA
スキャルピングインスタントインジケーター。 インディケータの地下値と一緒に売買するシグナルは矢印で示されます。 矢印と4つの時間枠を表示する地下インジケーターが予測で一致する場合、強い信号が考慮されます。 このインディケータには、1つの結果にまとめられた多くのアルゴリズムとタスクが含まれています。これは、Skalpingインスタントインディケータが提供します。つまり、トレーダーに市場の方向性を通知します。したがって、彼は与える 1.スキャルピングシグナル(図1)図1-D1に示すように、D1チャートの選択された期間とインジケーターの地下セクションに買いシグナルがあります。信号は遅滞なく到着します。この場合、スキャルピング戦略を使用して取引することをお勧めします。 2.信号補正またはトレンド。 図2に示すように、地下室のグラフのすべての期間。すべての期間はレッドゾーン->売りポジションにあります。チャート自体の時間枠と地下インジケーターが一致したときに色が変わるまで取引を保持します。 そのため、インジケーターは他の戦略に非常に適応できます。 主要通貨ペアで使用する
The Revolution Target Achiever FT -  Auto_Setting 1000 Points  Hi all Investors and traders, We've just updated this EA to a new version 3.0, which has a much more benefits , for Investors who want to run this EA 24 hours using vps can try the Auto_Setting to achieved 1000 Points or 10 %, for traders who have their own set up and target 1-100% can use the manual_setting, THE REVOLUTION Target Achiever is suitable for the investor who want to have a simple and ready to use Expert Advisor (EA). Th
Trend Indicator This Indicator detects the essential momentum in the market and lets you know when the market has a potential trend Green means we are going higher and Red Means we are going Lower,  You can customise the Line to Any Color.  The alerts come in immediately there is a potential signal Defaults Length : 55 This is the Depth of your averaging calculation. The bigger it is the more noise is filtered.  55 Is the Best Optimum Setting For This Indicator
Owl smart levels
Sergey Ermolov
4.63 (54)
MT5版  |   FAQ Owl Smart Levels Indicator   は、 Bill Williams   の高度なフラクタル、市場の正しい波構造を構築する Valable ZigZag、エントリの正確なレベルをマークする Fibonacci レベルなどの一般的な市場分析ツールを含む 1 つのインジケーター内の完全な取引システムです。 利益を得るために市場と場所に。 戦略の詳細な説明 インジケータを操作するための指示 顧問-取引助手 プライベートユーザーチャット ->購入後に私に書いて、私はプライベートチャットにあなたを追加し、あなたはそこにすべてのボーナスをダウンロードすることができます 力はシンプルさにあります! Owl Smart Levels   取引システムは非常に使いやすいので、専門家にも、市場を勉強し始めて自分で取引戦略を選択し始めたばかりの人にも適しています。 戦略と指標に秘密の数式や計算方法が隠されているわけではなく、すべての戦略指標は公開されています。 Owl Smart Levels を使用すると、取引を開始するためのシグナルをすばやく確認し、
Hello, >>>>>    Download  ** FREE TRIAL** from here (You can now perform forward test on DEMO account before Purchase)   <<<<<< Discord group for updates and discussion here Telegram channel here Contact Directly here For Live Results of the EA please visit here . PS Gold Miner is an automatic trading system for MT4 which uses markets fundamentals and trends to open, manage and close trades. With the use of advanced recovery strategy it ensure that it can recover from negative trades with hed
VR Cub
Vladimir Pastushak
VR Cub は、質の高いエントリーポイントを獲得するためのインジケーターです。このインジケーターは、数学的計算を容易にし、ポジションへのエントリーポイントの検索を簡素化するために開発されました。このインジケーターが作成されたトレーディング戦略は、長年にわたってその有効性が証明されてきました。取引戦略のシンプルさはその大きな利点であり、初心者のトレーダーでもうまく取引することができます。 VR Cub はポジション開始ポイントとテイクプロフィットとストップロスのターゲットレベルを計算し、効率と使いやすさを大幅に向上させます。取引の簡単なルールを理解するには、以下の戦略を使用した取引のスクリーンショットを見てください。 設定、設定ファイル、デモ版、説明書、問題解決方法は、以下から入手できます。 [ブログ] レビューを読んだり書いたりすることができます。 [リンク] のバージョン [MetaTrader 5] エントリーポイントの計算ルール ポジションをオープンする エントリーポイントを計算するには、VR Cub ツールを最後の高値から最後の安値までストレッチする必要があります。
Forex Auto Trading EA   is an Expert Advisor designed specifically for trading Forex Automatic 100%. - Min depost: 5,000$ for each Pair - Timeframe: D1 - Setting: Default Setting - Good Trading Pair: Best pair is AUDCAD, or Forex Pair have Daily Price range from 0.8 ~ 1.1, and have H1 H4 sideway chart. - First, before attach EA to chart, you need add   http://calendar.fxstreet.com/   in the list of allowed url in the tab 'Expert Advisors'   (Tool —> Option —> Expert Advisors —> Allow WebReque
Noize Absorption Index - is the manual trading system that measures the difference of pressure between bears forces and bulls forces. Green line - is a noize free index that showing curent situation. Zero value of index shows totally choppy/flat market.Values above zero level shows how powerfull bullish wave is and values below zero measures bearish forces.Up arrow appears on bearish market when it's ready to reverse, dn arrow appears on weak bullish market, as a result of reverse expectation. S
Harvest GOLD USES THE TREND WAVE INDICATOR AND IT CAN IDENTIFY THE BEGINNING AND THE END OF A NEW WAVE TREND MOVEMENT. AS AN OSCILLATOR, THE INDICATOR IDENTIFIES THE OVERBOUGHT AND OVERSOLD ZONES. IT WORKS GREAT TO CATCH THE SHORT TERM PRICE REVERSALS AND USES A MARTINGALE STRATEGY TO CLOSE ALL TRADES IN PROFIT. USE DEFAULT SETTINGS ON H1 OR HIGHER TIME FRAME ON ANY PAIR FOR MORE ACCURATE TRADES WHY THIS EA : Smart entries calculated by 3 great strategies The EA can be run on even a $
Gyroscope        professional forex expert   (for EURUSD, GBPUSD, USDJPY, AUDUSD, USDCHF, EURGBP, EURJPY, NZDUSD, USDCAD, EURCHF, AUDJPY, CADJPY pairs)   alyzing the market using the Elliot Wave Index. Elliott wave theory is the interpretation of processes in financial markets through a system of visual models (waves) on price charts. The author of the theory, Ralph Elliott, identified eight variants of alternating waves (of which five are in the trend and three are against the trend). The mo
Trend Flasher Trend is your friend is the age old saying quote in trading arena, there are though many ways to gauge the trend and its direction, more scientific measure and logically meaningful will be an ATR break outs to identify and spot the trend and its acceleration, so we created this easy to use trend identification panel and optimized super trend based multi time frame panel entry system to aid and help the traders to make their trading decision. Unique Features of Trend Flasher 1
ET9 New on the Market, Launch promo! Only a few copies left at: $699 Next price: $799 Final price: $1599 The Best  Expert Advisor  on   XAUUSD   any timeframes! ET9  for MT4 Updated 4.60 !!   Important update: Merge Dragon Ball's H4 breakout strategy, Optimize parameters Include Free  ET1 for MT4:  https://www.mql5.com/en/market/product/113219 Dragon Ball MT4 Updated v1.60 !!  https://www.mql5.com/en/market/product/116521 Descriptions ET9 for MT4 is a powerful automated trading program with
ROYAL DUTCH SKUNK USES THE TREND WAVE INDICATOR AND IT CAN IDENTIFY THE BEGINNING AND THE END OF A NEW WAVE TREND MOVEMENT. AS AN OSCILLATOR, THE INDICATOR IDENTIFIES THE OVERBOUGHT AND OVERSOLD ZONES. IT WORKS GREAT TO CATCH THE SHORT TERM PRICE REVERSALS AND USES A MARTINGALE STRATEGY TO CLOSE ALL TRADES IN PROFIT. USE DEFAULT SETTINGS ON H1 OR HIGHER TIME FRAME ON ANY PAIR FOR MORE ACCURATE TRADES WHY THIS EA : Smart entries calculated by 6 great strategies The EA can be run on even a $20000
Thank you for visiting us. We would like to introduce our new BLACK OUT EA which comes along with a moving average indicator for better trading This EA open and closes trades for you, no need to stress yourself. You can trade on any broker using any time frame . there are no restrictions!! You can easily increase your Lot size on the EA settings Backtest was done for two months. stay tuned for more !!!
Market Structure Zig Zag
Lesedi Oliver Seilane
4.8 (25)
Free Market structure zig zag to assist in price action trading the screenshots describe how to use and how to spot patterns new version comes with alerts, email alert and  push notification alert can be used on all pairs  can be used on all timeframes  you can add additional confirmation indicators the indicator shows you your higher high and low highs as well as your lower lows and lower highs  the indication makes price action analysis easier to spot.
FREE
H4 GBPUSD Trend Scalper is a trend signal scalper The EA trades according to the trend strategy using original built-in indicator for opening and closing orders. The external inputs for limiting trading on Fridays and Mondays are available. The purpose of the strategy is to use the current trend with the most benefit. According to the results of testing and working on demo and real accounts, the best results achieved by using the Н4 timeframe on the GBP/USD pair Works on MetaTrader 4 Build 971+
| Fully-automated Smart Money Concept (ICT) inspired trading solution with multi-strategy capabilities | Built by a grid trader >> for grid traders.  This is MT4 version, click  here  for  Blue CARA MT5  (settings and logics are same in both versions)     Real monitoring signal  -->  Cara Gold Intro Blue CARA EA   ('CARA') - short for  C omprehensive  A lgorithmic R esponsive A dvisor is a next-gen  multi-currency    multi-timeframe  EA base on the widely known (and perhapse most popular) Inn
This is a trend indicator without redrawing Developed instead of the binary options strategy (by the color of the Martingale candlestick) Also works well in forex trading When to open trades (binary options) A signal will appear in the place with a candle signaling the current candle It is recommended to open a deal for one candle of the current timeframe M1 and M5 When a blue dot appears, open a deal up When a red dot appears, open a trade down. How to open trades on Forex. When a signal is rec
This Indicator is use the ZigZag to calculate the Upper and  Lower Bound and the uptrend and the downtrned. Red for downtrend, Green for uptrend and Yellow is for the horizontal trend this horizontal trend also bookmarked the upper limited and the lower limited the the price swings.  Or in simple the Support and the Resistance level. However, You may use the Heikin Ashi to confirm the trend of the buy sell signal above. I cannot guarantee the win rate, Nevertheless, you must study well the timef
A simplistic indicator informing a user on RSI divergence by sending messages to mobile device and email. The indicator draws 2 vertical lines, marking two RSI extrema that formed the divergence. You get the alert, open the charts and make a decision. The indicator does not show past divergences, thus when you attach it to a chart for the first time you see nothing. Graphics and alerts will appear as soon as divergences do. Drop it in Tester to see how it works. Parameters: RSIPeriod - number of
TLFv1
Thanakorn Suphakornthongchot
Short-Term Fibonacci Trading Strategy with Clear TP and SL Strategy: Timeframe: M15 Indicator: Fibonacci Retracement Fibonacci Levels: Buy Entry: 38.2%, 50.0% Sell Entry: 61.8%, 78.6% TP/SL Placement: SL: Below/above the Fibonacci level used for entry Minimum Capital: $100 Instruments: Metals: Gold (XAUUSD) The recommended spread starts from 10 to 25, and should not exceed 28.
Strong Retracement Points Pro demo edition! SRP (Strong Retracement/Reversal Points) is a powerful and unique support and resistance indicator. It displays the closest important levels which we expect the price retracement/reversal! If all level are broken from one side, it recalculates and draws new support and resistance levels, so the levels might be valid for several days depending on the market! If you are still hesitating to start using this wonderful tool, you can check this link to see h
Nadaray Watson Envelope Strategy: The Nadaray Watson Envelope strategy is a technical analysis tool used to identify trends and support and resistance levels. It is based on the Nadaray Watson estimator, which is a non-parametric regression method. The strategy uses envelopes around price data to signal entry and exit points. For detailed documentation  Overall Settings/Input Guide   High Level Overview of Features Category Setting Description GENERAL SETTINGS Lot Size Initial volume for the fir
このプロダクトを購入した人は以下も購入しています
74% discount for the next 10 buyers (original price $605): 1 left Get a 50% bonus by buying (or even renting) any of our products. After buying (or renting), send a message for more information. 3 Indicators in 1 indicator Strategy based on price action Made specifically for the best forex currency pairs Can be used in the best time frame of the market at a very reasonable price This indicator is basically 3 different indicatos . But we have combined these 3 indicators in 1 indicator so th
まず第一に、この取引インジケーターは再描画されず、再描画されず、遅延しないことを強調する価値があります。これにより、手動取引とロボット取引の両方に理想的なものになります。 ユーザーマニュアル:設定、入力、戦略。 アトミックアナリストは、価格の強さとモメンタムを利用して市場でより良いエッジを見つけるためのPA価格アクションインジケーターです。ノイズや誤ったシグナルを除去し、取引ポテンシャルを高めるための高度なフィルターを備えています。複雑なインジケーターの複数のレイヤーを使用して、アトミックアナリストはチャートをスキャンし、複雑な数学的計算をシンプルなシグナルと色に変換します。これにより、どのような初心者トレーダーでも理解して使用し、一貫した取引の決定を行うことができます。 「アトミックアナリスト」は、新規および経験豊富なトレーダー向けにカスタマイズされた包括的な取引ソリューションです。プレミアムインジケーターとトップノッチの機能を1つの取引戦略に組み合わせ、すべてのタイプのトレーダーにとって汎用性のある選択肢にします。 デイリートレーディングとスキャルピング戦略:高
A key element in trading is zones or levels from which decisions to buy or sell a trading instrument are made. Despite attempts by major players to conceal their presence in the market, they inevitably leave traces. Our task was to learn how to identify these traces and interpret them correctly. Reversal First Impulse levels (RFI)   -  Version MT5                INSTRUCTIONS                 RUS                 ENG                                       R ecommended to use with an indicator   -  
このインジケータは、手動および自動的な方法でチャートに描かれたハーモニックパターンを検出します。ユーザーマニュアルは、このリンクから参照できます: あなたのレビューを追加し、入手するために私たちに連絡してください。 この製品をmt4で試すための無料版があります。 GartleyおよびNenstarパターンを検出するために使用できます。 https://www.mql5.com/en/market/product/30181 完全なMT4バージョンを購入するには、次の場所から購入できます。 https://www.mql5.com/en/market/product/15212 注 インジケータにはコントロールパネルがあり、すべての(チャート&時間枠)設定が保存されます。チャート上でスペースをより多く確保するために、最小化することができ、他の分析ツールで作業する場合は、すべてのインジケータデータを非表示にするために閉じるボタンを押すことができます。 このインジケータを使用して設定を変更し、移動平均やボリンジャーバンドなどのインジケータを追加すると、編集のテンプレートが自動的に保存され、必
現在20%OFF! 初心者やエキスパートトレーダーのためのベストソリューション! このダッシュボードソフトウェアは、28の通貨ペアで動作しています。それは私達の主要な指標(高度な通貨の強さ28と高度な通貨インパルス)の2に基づいています。それは全体の外国為替市場の大きい概観を与えます。それは、すべての(9)時間枠で28の外国為替ペアのための高度な通貨の強さの値、通貨の動きの速度と信号を示しています。チャート上で1つのインディケータを使用して市場全体を観察し、トレンドやスキャルピングの機会をピンポイントで見つけることができたら、あなたのトレードがどのように改善されるか想像してみてください。 このインディケータには、強い通貨と弱い通貨の識別、潜在的な取引の識別と確認がより簡単になるような機能が搭載されています。このインディケータは、通貨の強さや弱さが増加しているか減少しているか、また、すべての時間枠でどのように機能しているかをグラフィカルに表示します。 新機能として、現在の市場環境の変化に適応するダイナミックなマーケットフィボナッチレベルが追加され、すでに当社のAdvan
TrendMaestro
Stefano Frisetti
5 (2)
note: this indicator is for METATRADER4, if you want the version for METATRADER5 this is the link:  https://www.mql5.com/it/market/product/108106 TRENDMAESTRO ver 2.4 TRENDMAESTRO recognizes a new TREND in the bud, he never makes mistakes. The certainty of identifying a new TREND is priceless. DESCRIPTION TRENDMAESTRO identifies a new TREND in the bud, this indicator examines the volatility, volumes and momentum to identify the moment in which there is an explosion of one or more of these data a
Volatility Trend System - a trading system that gives signals for entries. The volatility system gives linear and point signals in the direction of the trend, as well as signals to exit it, without redrawing and delays. The trend indicator monitors the direction of the medium-term trend, shows the direction and its change. The signal indicator is based on changes in volatility and shows market entries. The indicator is equipped with several types of alerts. Can be applied to various trading
An extremely convenient indicator that truly makes the process of making money on the exchange easy. It is based on the scientifically rigorous theory of the market developed by the author, the beginning of which is presented here .                The full algorithm of this indicator operation is presented in the article .               The indicator calculates the most probable price movement trajectory and displays it on the chart. Based on the predicted price movement trajectory
Cyclical indicator for trading and predicting the direction of the market. Shows the cyclical behavior of the price in the form of an oscillator. Gives signals for opening deals when rebounding from the upper and lower boundaries of the oscillator. In the form of a histogram, it shows the smoothed strength of the trend. Will complement any trading strategy, from scalping to intraday. The indicator does not redraw. Suitable for use on all symbols/instruments. Suitable time frames for short-term
もちろんです。以下は、提供いただいたテキストの日本語への翻訳です: MT4用の天文学指標をご紹介します:究極の天体トレーディングコンパニオン トレーディング体験を天空の高みに高める準備はできていますか?私たちの革命的なMT4用の天文学指標をご紹介します。この革新的なツールは、複雑なアルゴリズムの力を借りて、類まれなる天文学的洞察と精密な計算を提供します。 あなたの指先で宇宙の情報を: 宝のような天文学的データが明らかになる包括的なパネルをご覧ください。惑星の地理的/太陽中心座標、太陽と地球の距離、星の大きさ、伸び、星座、黄道座標および赤道座標、さらには水平座標まで、それぞれが綿密に計算され美しく表示されています。指標によって生成される垂直線は時間値に対応し、トレーディングの旅に宇宙の視点を提供します。 惑星のラインと関係: グラフを飾る惑星のラインの魔法を体験し、スケールと角度をカスタマイズできます。直感的なコントロールパネルを介して各惑星のラインの表示を簡単に切り替えることができます。指定された時刻範囲内での合会、六分会、四分会、三分会、対会、逆行の指標で天体の関係の芸術を発見してく
ON Trade Waves Patterns Harmonic Elliot Wolfeをご紹介します。これは手動および自動の方法を使用して市場のさまざまなパターンを検出するために設計された高度なインジケーターです。以下はその動作方法です: ハーモニックパターン: このインジケーターは、チャートに表示されるハーモニックパターンを識別できます。これらのパターンは、Scott Carneyの「Harmonic Trading vol 1および2」で説明されているように、ハーモニックトレーディング理論を実践するトレーダーにとって重要です。手動で描画するか、自動検出に頼るかにかかわらず、ON Trade Waves Patternsがお手伝いします。 コントロールパネル: このインジケーターはユーザーフレンドリーなコントロールパネルを備えています。チャートと時間枠の設定を保存し、異なる構成間をスムーズに切り替えることができます。チャートスペースを最大限に活用するために最小化することもできます。他の分析ツールで作業することを好む場合、閉じるボタンをクリックするだけで、すべてのインジケーターデ
WARNING: PRICE IS SUBJECT TO RISE AT ANY TIME. GET YOUR COPY TODAY TO AVOID MORE COST! Dear Traders I am so glad to introduce to you my other tool called the Forex Sniper Entries Indicator. This tool is designed to help serious traders and investors capture big moves in the currency price movements. The philosophy behind this tool is all about winning big and riding the price movement from its beginning until the maximum point. We want to capture those big moves in both down and up markets as mu
How to use Pair Trading Station Pair Trading Station is recommended for H1 time frame and you can use it for any currency pairs. To generate buy and sell signal, follow few steps below to apply Pair Trading Station to your MetaTrader terminal. When you load Pair Trading Station on your chart, Pair Trading station will assess available historical data in your MetaTrader platforms for each currency pair. On your chart, the amount of historical data available will be displayed for each currency pai
MT My Way
Issara Seeboonrueang
Best strategy,  Easy trade ,  Support of version update in the future MT My Way: develop for new traders with no experience It is a very simple trade. Open the order when there is signal and close the order when there is exit or found the next opposite signal. For experienced traders, It will be very easy to trade. TRADE: Forex TIME FRAME:  All Time Frame SYMBOL PAIR: All Symbol SETTINGS: CALCULATE BARS: Value or bars used must be large enough to calculate the formula. Fo
TakePropips Donchian Trend Pro
Eric John Pajarillaga Aldana
4.82 (17)
TakePropips Donchian Trend Pro   (MT4) は、ドンチャン チャネルを使用してトレンドの方向を自動的に検出し、エントリーとエグジットの取引シグナルを提供する強力で効果的なツールです! この多機能インジケーターには、トレンド スキャナー、取引シグナル、統計パネル、スクリーナー、取引セッション、およびアラート履歴ダッシュボードが含まれます。取引シグナルを提供し、チャートを分析する時間を節約するように設計されています! ユーザー マニュアルとインストール ガイドは、ブログ投稿 (   https://www.mql5.com/en/blogs/post/751368   ) からダウンロードできます。 今日は 50% オフ! 98ドルから49ドルに値下げ! このインジケーターは、ストラテジー テスターでテストできます (ビジュアル モードを有効にします)。 詳細については、説明の下にあるビデオ チュートリアルも利用できます。 ご不明な点やサポートが必要な場合は、私に連絡してください。 TakePropips Donchian Trend Pro イン
これはほぼ間違いなく、MetaTraderプラットフォームで見つけることができる最も完全な調和価格形成自動認識インジケーターです。 19種類のパターンを検出し、フィボナッチプロジェクションをあなたと同じように真剣に受け止め、潜在的逆転ゾーン(PRZ)を表示し、適切なストップロスとテイクプロフィットレベルを見つけます。 [ インストールガイド | 更新ガイド | トラブルシューティング | よくある質問 | すべての製品 ] 19の異なる調和価格形成を検出します プライマリ、派生および補完フィボナッチ投影(PRZ)をプロットします 過去の価格行動を評価し、過去のすべてのパターンを表示します この指標は、独自の品質とパフォーマンスを分析します 適切なストップロスとテイクプロフィットのレベルを表示します ブレイクアウトを使用して適切な取引を通知します すべてのパターン比をグラフにプロットします 電子メール/音声/視覚アラートを実装します スコット・M・カーニーの本に着想を得て、この指標は最も純粋で急を要するトレーダーのニーズを満たすように設計されています。ただし、トレードを
The BB Reversal Arrows technical trading system has been developed to predict reverse points for making retail decisions. The current market situation is analyzed by the indicator and structured for several criteria: the expectation of reversal moments, potential turning points, purchase and sale signals. The indicator does not contain excess information, has a visual understandable interface, allowing traders to make reasonable decisions. All arrows appear to close the candle, without redr
Cycle Sniper
Elmira Memish
4.39 (36)
NEW YEAR SALE PRICE FOR LIMITED TIME!!! Please contact us after your purchase and we will send you the complimentary indicators to complete the system Cycle Sniper is not a holy grail but when you use it in a system which is explained in the videos, you will feel the difference. If you are not willing to focus on the charts designed with Cycle Sniper and other free tools we provide, we recommend not buying this indicator. We recommend watching the videos about the indiactor and system before pu
Indicator : RealValueIndicator Description : RealValueIndicator is a powerful tool designed specifically for trading on the EURUSD pair. This indicator analyzes all EUR and USD pairs, calculates their real currency strength values, and displays them as a single realistic value to give you a head start on price. This indicator will tell you moves before they happen if you use it right. RealValueIndicator allows you to get a quick and accurate overview of the EURUSD currency pair tops and bottoms,
Connect Indicator is a tool used for connecting indicators between the MQL market and MT4. The connected indicators are made by our group and can be used for other applications, such as sending messages to the Line application or Telegram application. If you have any questions, please don't hesitate to ask us to receive support. Function and indicator buffer Buffer one is the high price of the previous candle. Buffer two is the high price of the previous candle. Usage To connect indicators to fu
驚異的なFXインジケーター「Miraculous」をご紹介します。完璧な結果を得るための1時間足を含むすべてのタイムフレームで効果的に機能する、最強の強力な特殊MT4フォレックスインジケーターです。 すべてのタイムフレームで優れた結果を提供する最高のFXインジケーターを探し続けるのに疲れましたか?これ以上探す必要はありません!「Miraculous」フォレックスインジケーターをご紹介します。このインジケーターは、トレーディングの経験を変革し、収益を新たなレベルに引き上げるために設計されました。 先進のテクノロジーと長年にわたる緻密な開発に基づいて構築された「Miraculous」フォレックスインジケーターは、FX市場における力と正確さの頂点となります。この素晴らしいツールは、すべてのレベルのトレーダーのニーズを満たすように設計されており、一貫した収益性を追求する上で比類のない優位性を提供します。 「Miraculous」フォレックスインジケーターの他との違いは、その非常に適応性にあります。デイトレーダー、スウィングトレーダーであろうと、長期ポジションを好む方であろうと、このインジケータ
TPA True Price Action indicator reveals the true price action of the market makers through 100% non-repainting signals (except early signals mode) strictly at the close of a candle! TPA shows entries and re-entries, every time the bulls are definitely stronger than the bears and vice versa. Not to confuse with red/green candles. The shift of power gets confirmed at the earliest stage and is ONE exit strategy of several. There are available now two free parts of the TPA User Guide for our custo
Welcome to the world of SMC (Smart Money Concepts) Trading, where we empower traders with the tools and knowledge to make smarter trading decisions. Our latest addition to our suite of trading tools is the SMC Trading Pro indicator, version 1.0. Key Features: Major Market Structure Identification with BODY break. Order Block must be in Major Swing ( not Small Swing ). Order Block with Fair Value Gap Detection. Order Block in Discount | Premium zone. Filter for only Bullish, Bearish or All Order
現在20%OFF! このダッシュボードは、複数のシンボルと最大9つのタイムフレームで動作するソフトウェアの非常に強力な部分です。 このソフトは、弊社のメインインジケーター(ベストレビュー:Advanced Supply Demand)をベースにしています。    Advanced Supply Demand ダッシュボードは、素晴らしい概要を提供します。それは示しています。  ゾーン強度評価を含むフィルタリングされた需給値。 ゾーン内/ゾーンへのPips距離。 ネストされたゾーンがハイライトされます。 選択されたシンボルの4種類のアラートを全ての(9)時間枠で提供します。 それはあなたの個人的なニーズに合わせて高度に設定可能です。 あなたの利益! すべてのトレーダーにとって最も重要な質問です。 市場に参入するのに最適なレベルはどこか? 成功のチャンスとリスク/リターンを得るために、強力な供給/需要ゾーン内またはその近くで取引を開始します。 損切りの最適な位置はどこですか? 最も安全なのは、強力な供給/需要ゾーンの下/上にストップを置くことで
[ MT5 Version ] Order Block Indicator MT4 Order Block Indicator MT4  is currently the most accurate and customizable indicator in the market. It has been developed to facilitate the analysis of operations based on Order Blocks and Supply and Demand Zones. These zones are possible reversal points of a movement. Order Blocks indicate a possible accumulation of orders in one area. The price usually gets to reach and react strongly to those areas. The most relevant levels for this reaction are the c
Smart Ai Levels  Accumulation & Distribution indicator Smart Ai Levels are Ai controlled indicator which is based on Wyckoff Price cycle theory . It automatically scans the Accumulation & Distribution phases on chart and Ai draws the possible areas before Mark up and Mark down which acts as hot zones and can be traded with confirmation to catch those big price movements . It's a great tool for both Reversal and Breakout Trades suitable to all Trading Styles such as Scalping - Intraday - Swing 
XPointer is a completely ready trading system. It shows the trader when to open and close a trade. It works on all currency pairs and all time frames. Very easy to use and does not require additional indicators for its operation. Even a beginner trader can start working with XPointer. But it will also be useful for professional traders to confirm the opening of orders. Features of the XPointer indicator It does not redraw its values. It works on all currency pairs and all time frames. It has a
Elliott Wave Trend was designed for the scientific wave counting. This tool focuses to get rid of the vagueness of the classic Elliott Wave Counting using the guideline from the template and pattern approach. In doing so, firstly Elliott Wave Trend offers the template for your wave counting. Secondly, it offers Wave Structural Score to assist to identify accurate wave formation. It offers both impulse wave Structural Score and corrective wave Structure Score. Structural Score is the rating to sh
Algo Trading Indicaor  With this indicator , you’ll have zones and trends that hight probability the price will reverse from it. so will gives you all the help that you need  Why should you join us !?  1-This indicator is logical since it’s working in previous days movement , to predict the future movements. 2-Algo trading indicator will help you to draw trends which is special and are too strong than the basics trend , trends will change with the frame time that you work on . 3-We can
Weddell Pro is a good trading tool that is suitable for both a beginner and an experienced trader. It can be used both separately and combined with other strategies and indicators Configured for currency pairs was tested several times on cryptocurrency but did not show a high result Currency pairs USD/EUR AUD/CAD GBP/USD Showed itself very well here The percentage of correct transactions is above 68%, which does not make it perfect and bad Doesn't draw or disappear The red arrow sho
作者のその他のプロダクト
EMA Alert
Santi Dankamjad
5 (6)
Indicator overview   Trend indicator usage Moving averages. Highest quality alerts that need no introduction. It is completely loyal to the original algorithm and uses other useful features. Easy to trade Carry out all kinds of notifications It's not a new paint and it's not a back paint. Setting Indicator EMA50 in Time frame H1 for any pair currency and Gold Spot. EMA200 in Time frame H1 for any pair currency and more than EMA250 for Gold spot. Using it for maximum benefit Set up notificatio
FREE
Madx Cobra   Madx Cobra Indicator. Create to traders both experienced and inexperienced to use it because it is a basic indicator How to use : Setting Indicator 1. MA Fast  : Moving Average fast (10) 2. MA Slow :  Moving Average Slow control trend markets.(200) 3. ADX : Control trend(5) 4. For alert you can set to alert Next bar or instant bars.  When arrow sky blue show or arrow up, you can entry order "Buy" or "Long" and arrow red show or arrow down, you can entry order "Sell" or "Short"
Indicator overview   Trend indicator usage Moving averages. Highest quality alerts that need no introduction. It is completely loyal to the original algorithm and uses other useful features. Easy to trade Carry out all kinds of notifications It's not a new paint and it's not a back paint. Setting Indicator SSMA50 in Time frame H1 for any pair currency and Gold Spot. EMA200 in Time frame H1 for any pair currency and more than EMA250 for Gold spot. Using it for maximum benefit Set up notificati
FREE
Indicator overview   Trend indicator usage Moving averages. Highest quality alerts that need no introduction. It is completely loyal to the original algorithm and uses other useful features. Easy to trade Carry out all kinds of notifications It's not a new paint and it's not a back paint. Setting Indicator SMA50 in Time frame H1 for any pair currency and Gold Spot. EMA200 in Time frame H1 for any pair currency and more than EMA250 for Gold spot. Using it for maximum benefit Set up notificatio
FREE
Indicator overview   Trend indicator usage Moving averages. Highest quality alerts that need no introduction. It is completely loyal to the original algorithm and uses other useful features. Easy to trade Carry out all kinds of notifications It's not a new paint and it's not a back paint. Setting Indicator WMA50 in Time frame H1 for any pair currency and Gold Spot. EMA200 in Time frame H1 for any pair currency and more than EMA250 for Gold spot. Using it for maximum benefit Set up notificatio
FREE
RSI Color and Notification Setting Usages :: 1. Set value Oversold and Overbought 2. Set period RSI 3. Set Color 4. Notify to Alert, Email and Mobile. For Trading :: Forex and Binary option 1. When the color alarm occurs in the OVB area, do the preparation. To enter a Sell order 2. When the color alarm occurs in the OVS area, do the preparation. To enter a Buy order 3. When RSI is between OVB and OVS, consider another indicator to trade.
FREE
There are 8 types of this indicator. Consisted of 1. Bullish and Bearish Engulfing 2. Morning and Evening Star 3. Three Green Soldiers and Three Red Crows 4. Three Inside Up and Down 5. Three Outside Up and Down 6. Bullish and Bearish Harami 7. Tweezers Top and Bottom 8. Piercing and Dark cloud cover Signal Filter :: 1. The appearance of the candle stick 2. SMA 3. 2EMA :: EMA Fast and EMA Slow 4. RSI N otification :: 1. Via screen 2. Email 2. Phone For trading 1. Scaling 2. Binary options
This indicator is an upgrade of traditional MACD on MT4. Macd Base line cross above Macd signal line the color of histogram change is red color and entry order Sell. Macd Base line cross below Macd signal line the color of histogram change is green color and entry order Buy. For above histogram of Macd can change color to good looking by can change color above zero line and lower line.
Trading is a trade war. So a trader is a warrior. A warrior needs to be armed with a weapon This Binary Star Wars Pro  is your workout routine. That can accelerate the results precisely Who deserves this kind of precision weapon? 1. People who want to profit. From binary options trading 2. Those who want to trade short, profit fast 3. People who want long-term Can be done 4. Newbie can use it. 5. Old hands can be used very well. How it works It works very easy. For binary options Time fra
For this set of indicators 1. General information     - Calculates with high performance mathematical algorithms.     - Calculated from the price of candles     - The entry point of this order is filtered by the train EMA and the oscillator.     - Calculate the integrity of the candle 2. How does it work?     - You can see two types of order entry points: the notification on the monitor and the arrow.     - You can trust 75-95 percent of this entry point. 3. Settings     - A complete candle
For this set of indicators 1. General information     - Calculates with high performance mathematical algorithms.     - Calculated from the price of candles     - The entry point of this order is filtered by the train EMA and the oscillator.     - Calculate the integrity of the candle 2. How does it work?     - You can see two types of order entry points: the notification on the monitor and the arrow.     - You can trust 75-95 percent of this entry point. 3. Settings     - Retracement is re
For this set of indicators 1. General information     - Calculates with high performance mathematical algorithms.     - Calculated from the price of candles     - The entry point of this order is filtered by the train EMA and the oscillator.     - Calculate the integrity of the candle 2. How does it work?     - You can see two types of order entry points: the notification on the monitor and the arrow.     - You can trust 75-95 percent of this entry point. 3. Settings     - A complete candle
Trading is a trade war So traders are warriors. A warrior needs a weapon. The Binary Galaxy A1 is a powerful weapon. Extremely accurate This tool can be customized as you like. Who deserves such an accurate weapon? 1. People who want profits From binary options trading 2. Those who want to trade short, profit fast 3. People who want long-term can do it. 4. Beginners can use it. 5. Old hand works very well. How it works It works very easy. For binary options Time frame M1 or M5 and expires
Trading is a trade war So traders are warriors. A warrior needs a weapon. The Scalping One Plus A1 is a powerful weapon. Extremely accurate This tool can be customized as you like. Who deserves such an accurate weapon? 1. People who want profits From binary options trading 2. Those who want to trade short, profit fast 3. People who want long-term can do it. 4. Beginners can use it. 5. Old hand works very well. How it works It works very easy. For binary options Time frame M1 or M5 and exp
We know for sure that The Fibonacci sequence is a science used to calculate or estimate target distances. How does this indicator work? 1. Tell the spread status 2. Tell me the current price 3. Indicate whether the candlestick status is bullish or bearish on each time frame. 4. Indicates the status of the past 2 candles 5. Tell Pivot Point 6. Tell the Fibonacci sequence. 7.The Fibonacci measurement can be set. 8. Pivot can be set backward. 9. Look at support and resistance. Suitable for 1.
MA Cross indicator by 4Umbella Create for traders both experienced and inexperienced to use it because it is a basic indicator How to use : 1. MA Fast  : Moving Average fast (Period 4 upto 50) 2. MA Middle :  Moving Average Middle (Period 10 upto 100) 3. MA Slow :  Moving Average Slow (Period 50 upto 200) to control trend markets. and trader can be set for Apply to price (Close, Open,Low,High,Median,Typical,weightd) For alert you can set to alert Next bar or instant bars.  The work is
Madx Cobra Indicator. Create to traders both experienced and inexperienced to use it because it is a basic indicator How to use : Setting Indicator 1. MA Fast  : Moving Average fast (10) 2. MA Slow :  Moving Average Slow control trend markets.(200) 3. ADX : Control trend(5) 4. For alert you can set to alert Next bar or instant bars.  When arrow sky blue show or arrow up, you can entry order "Buy" or "Long" and arrow red show or arrow down, you can entry order "Sell" or "Short" Setting s
Concept : Sto Extreme  Entry order point  is a set of Stochastic oscillator (5,3,3) (customizable). There are 4 types of entry points: 1. Main line  cross above/below Signal line : Main line Intersect Signal Line (2 lines intersect) 2. Main line line or Signal line cross out OVB/OVS : Main line /Signal Line (Optional) cross above OVB and cross below OVS 3. Main line line or Signal line cross in OVB/OVS : Main line /Signal Line (Optional) cross below OVB and cross above OVS 4. Main line line or S
For This Indicator 'WL Percent R' This indicator is an upgrade of traditional Williams %R on MT4. 1. Up trend : indicator is above -50 and strong trend is above -20. 2. Down trend : indicator is below -50 and strong trend is below -80. How to use... 1. You can be customize color and level of indicator. 2. You can be customize alert and define alert on next bar or instant bar. Williams Percent R (Williams %R)  credit : https://www.investopedia.com/terms/w/williamsr.asp Williams %R, also
OB = Order Block When it comes to trading, an order block is a price level where multiple market participants either want to buy or sell. An order block may indicate that a price is likely to fluctuate. This is because there is a lot of pressure either from buyers or sellers, whether it rises or falls depends on where that pressure is coming from. Highlights   1. Order blocks in forex are price levels where institutions attempt to buy or sell a foreign exchange pair without potentially having
OBTE = Order Block Type I OBTI Indicator MT4 is the most accurate and customizable indicator on the market. It was developed to facilitate the analysis of operations based on candlestick patterns and supply-demand zones. These zones are possible movement reversal points. For this indicator is generated by the order block of smart money concept. Input parameters: 1. Multiple timeframes : M1 M5 M15 M30 H1 H4 D1 W1 MN1 2. Default input: H1 H4 D1 W1 MN1 3. Notifications / Send Emails / Notificatio
Fair value gap (FVG) = Imbalance zone Fair value gap Indicator MT4 is the most accurate and customizable indicator on the market. It was developed to facilitate the analysis of operations based on candlestick patterns and supply-demand zones. These zones are possible movement reversal points. For this indicator is generated by the order block of smart money concept. High Time Frame (HTF) To Find High Quality Order Block Low Time Frame (LTF) To Find a secure Entry W1 D1, H4 D1 H4, H1, M30 H4
Indicator MT4 : UTBMA (Universal trend boundary moving average) Objective: To track price trends and price reversals. How to set up Indicator UTBMA : 1. The standard value is SMA 20 and SMA 50, you can set it as you like. 2. UTBx 14 is Universal Trend Boundary Index, standard value 14. 3. UTBx Method is a method for calculating the standard value is Exponential. Meaning of symbols in indicators : 1. The line of the green group means the trend is up. 2. The line of the red group represents
Indicator MT4 : DXMA(Direction index moving average) Objective: To track price trends and price reversals. How to set up Indicator DXMA : 1. The standard value is EMA 12 and EMA 26, you can set it as you like. 2. UTBx 14 is Universal Trend Boundary Index, standard value 14. 3. UTBx Method is a method for calculating the standard value is Exponential. Meaning of symbols in indicators : 1. The line of the green group means the trend is up. 2. The line of the red group represents a down trend
フィルタ:
レビューなし
レビューに返信
バージョン 8.0 2023.08.05
Update function Chart Foreground
バージョン 7.0 2023.08.05
Update buffer of Regular Divergence and Hidden Divergence
バージョン 6.0 2023.07.27
Update logo for winpro
バージョン 5.0 2023.07.26
Improved to work with currency pairs and gold pairs with more than 6 characters.
バージョン 4.0 2023.07.25
Update : for all trading
バージョン 3.0 2023.07.25
Update USD Meter Line
バージョン 2.0 2023.07.22
Update Logo