YouTubeにあるマーケットチュートリアルビデオをご覧ください
ロボットや指標を購入する
仮想ホスティングで
EAを実行
EAを実行
ロボットや指標を購入前にテストする
マーケットで収入を得る
販売のためにプロダクトをプレゼンテーションする方法
MetaTrader 5のための有料のエキスパートアドバイザーとインディケータ - 75

Good money/risk management is more than just position sizing, it's much more. Successful traders analyze your trading activities and keep an eye on your key figures. With the help of AccountMan you can also do this very conveniently, analyze your trading activities for the purpose of professional money / risk management. Evaluate your trades by trade symbol to see if trading is profitable overall with these. Would you like to keep an eye on your individual strategies? e.g. which strategy works b

Pullback points indicator - is the manual trading system, that shows most popular market prices. Indicator measures bull/bear waves pressure and looks for "consensus" prices. As a rule these points are crossed up and down very often and opened trade has several chances to be closed in positive zone. Mainly, such points is the good base for "common profit" types of strategies. Indicator also represents "common profit" scalping method of trading as default one. Main Indicator's Features Signals

Deriv EA
New price $199 USD , future price will be $399 USD
INTRODUCTION Deriv is MT5 broker which provide a wide range of derivatives exchange to its clients. On this broker we find a number of indices which includes Volatility 10 index, Boom 1000 index, Crash 1000 index and many more. After i have been trading for 6 years on this broker i then decided to come up with an Expert Advisor to automate the process. Hence i developed this simple bot based on 2 Moving Average Cross Overs. Take

Floating gain meter is the manual trading system that works with local trends and it's scalping. Histogram represents bull/bear floating trend gain. Green color histogram shows choppy market with bullish pressure, Orange - shows choppy market with bearish pressure. Lime and Red colors shows "boiled" places in market. As a rule buy arrow is placed after strong Down movement when it's power becomes weak and choppy market starts. And sell arrow is plotted after strong Up movement when it's power
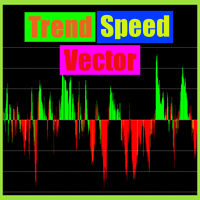
Trend speed vector - is the oscillator for manual trading. System measures trend direction and it's speed. Histogram shows 4 colors: Lime --> Strong up movement with good gain speed; Green --> Up movement with low gain speed Red --> Strong down movement with good gain speed; Orange --> Down movement with low gain speed Green and Orange histograms show weak market's movements and thуese places excluded from signal points. Buy arrow is plotted during strong down movement when bearish gain speed i
This EA is designed to automate Larry Connor’s System TPS - ( Time Position & Scale ) first described in his book “High Probability ETF Trading ” https://www.amazon.com/High-Probability-ETF-Trading-Professional/dp/0615297412 The operation of TPS can be summarized as follows: 1. Trade an ETF or Cash Index 2. The Index trades above its 200-day moving average 3. Open a 10% long position, if the 2-period RSI is below 25 for two days in a row 4. Increase position size by 20

Satoshi Expert Advisor (Trade Bitcoin with Satoshi) Our latest update has fundamentally transformed the core functionalities of the robot. All exit rules are now represented through coefficients and meticulously calculated based on six independent ATR indicators—this marks the primary enhancement. Another breakthrough in this robot is its ability to seamlessly operate with various order types. You now have the flexibility to customize Limit, Stop, or Market orders individually. Additionally, a
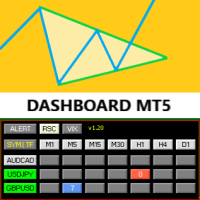
Symmetric Triangle Dashboard MT5 is a matrix that was designed to monitor any standard and/or custom indicator as well as symmetrc triangle patterns by any symbol-timeframe combination to be alerted if the desired contition is met. Furthermore by simply clicking on the selected signal, the refering chart becomes opened including the assigned indicator template if there was designed one. In "Custom" mode, user can add any indicator to scan its up to 7 timeframes per symbol to for example, get

Monitor your favorite Symbols My #1 Utility: includes 65+ functions, including this tool | Contact me if you have any questions This tool opens in a separate window: it can be moved (drag anywhere), and minimized [v]. You can adjust the Watchlist on the panel: Click [edit list] to add / remove the Symbols from the Watchlist. Calculated value: it may either be the last [closed bar], or the current [floating bar]. Select the [timeframe] for calculation. There are 2 types of the value sorti

Floating peaks oscillator - it the manual trading system. It's based on Stochastik/RSI type of oscillator with dynamic/floating overbought and oversold levels. When main line is green - market is under bullish pressure, when main line is red - market is under bearish pressure. Buy arrow appears at the floating bottom and sell arrow appears at floating top. Indicator allows to reverse signal types. Main indicator's adjustable inputs : mainTrendPeriod; signalTrendPeriod; smoothedTrendPeriod; tre

The purpose of the Combo OnOff indicator is combine differerent tecniques and approachs to the market in order to spot signals that occur simultaneosly. A signal is more accurate if it is validate from more indicators as the adaptive expectations can be used to predict prices.The On-Off feature and alarms help to look for the better prices to enter/exit in the markets
Moving Averages are statistics that captures the average change in a data series over time
Bollinger Bands is formed by upp

Trailing Stop toolbox MQL5, better and friendly. Trailing Stop tool box using Moving Average, Parabolic SAR, Ichimoku Kijun-sen, trailing stop normal, trailing stop by candle, trailing stop by targets and trailing stop by lowest, highest candle numbers. Manage orders by currency pairs and comments, trailing one or many orders at same time. Mql4 versition: https://www.mql5.com/en/market/product/68181
Workflow: Set your comment, profit, stoploss, lotsize, t imeframes and chose indicator for beg
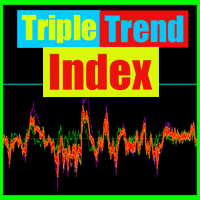
Triple trend index is the manual trading system/indicator. It looks for trend reversal points according to main trend index datas. Indicator represents 4 lines. 3 lines shows trend power by main market's parametres. 4th line (OrangeRed) is the main index. When line is above zero level - market is bullish, value below zero show bearish pressure. Indicator "looks" for weak places(reversal points) on bullish market to plot a sell arrow and weak places(reversal points) on bearish market to plot a

The strategy of the Expert Advisor is based on the return of the price to the average value. This is a simple and effective strategy using StopLoss and TakeProfit.
Additional orders in the same direction are allowed. The entire series of orders is closed with a positive result - this is another advantage of ONI EA.
When creating the ONI Expert Advisor, we optimized it hundreds and thousands of times using 100% quality ticks.
Signal monitoring: https://www.mql5.com/en/users/neurofx/seller

You can often see how the authors of their products recommend the lowest possible ping, this Expert Advisor is able to work with a very large ping of 1000 ms and above. Which makes it resistant to slippage.
The Expert Advisor is designed for trading on a calm evening market without affecting the opening of transactions in a rollover, all transactions are opened before the rollover.
The Expert Advisor trades on the GBPUSD M5 currency pair.
The EA always uses a stop loss! does not use marti

Coded by Prime Capital Vietnam Best with XAUUSD (GOLD) You need backtest carefully with real tick to find your best setting. Our setting (best with ICMarket broker): - Spread max: < 30 - Min balance: 10k - Lot: 0.01 - Trailing stop: 1$
Important Note: spread is the most important with this EA ----------------------------------------------------------------------------------------------------------- Support: admin@primecapitalvn.com Telegram: +84589671650 | +84879118113

Strategy Name: Horse Trader Robot HT01 Description: Horse Trader Robot HT01 is a fully automated robot. This uses a price action strategy, advanced money management. It is most effective in trend reversal. Maintained excellent risk- reward. Tested in real accounts with profits and guarantee of profit in future. Suitable for both beginners and experienced traders. It will put trade at market price once signal generated. Once trade is activated stoploss is placed as per strategy and take

Impulse fractals indicator - is counter-trend oriented complex market fractal pattern. Market creates bull/bear impulse, trend starts, fractals on impulsed wave are an agressive pullback signals. Buy arrow is plotted when market is bearish and it's impulse showed up-side fractal, and sell arrow is plotted when market is bullish and it's impulse showed dn-side fractal. Main indicator's adjustable inputs : impulsePeriod - main period of impulse histogram filterPeriod - smoothes impulse accordi

TPM Cross (trend power moving cross) - is a trend following strategy based on custom signal points. Indicator consists from main custom moving chart line and trend power line. Indicator defines up and down movements by it's trend power and custom moving direction. When current market's trend looses it's power and opposite trend starts - power trend line crosses moving and indicator plots an arrow. Main indicator's adjustable inputs : movingPeriod - period of moving line trendPeriod - period

Potential loss on all active and pending trades: if SL levels will be reached (or the current floating loss if the SL level is not set) My #1 Utility: includes 65+ functions, including this indicator | Contact me if you have any questions In the input settings you can adjust: Calculateion method : account currency / pips / points / % of the balance Position on the chart: bottom left / bottom right / top left / top right corner
Font: color, size and style Optionally you can includ

Fast Trade Detector (FTD) - Самый правдивый индикатор, который показывает истинное
настроение Большого Игрока.
На бирже есть Игрок, у которого есть всё для того, чтобы быть в первых рядах в книге торговых
приказов (биржевом стакане). Эти сделки как индикатор рыночного настроения сильного игрока.
Вы поймёте, что всё не совсем так, как представляли раньше. Вам откроются алгоритмы и стратегии
крупного участника рынка. Исполнение индикатора в виде гистограммы в подвале графика. Гистогра

Good Day,
"Horse Trader" is an Expet Advisor and Trding Robot which is based on Technical Analysis Indicator. This Algorithm is developed with extensive research to give best results over a period of time. It is based of low loss high return principle that helps to cut losses when trade goes wrong and during profits it keeps running a trade so that maximum profits can be taken out through the same. there are two kind of "Horse Trader" algorithms one focuses only on buy side trades with smal
Absolute volatility for each day for the last 4 weeks My #1 Utility: includes 65+ functions, including this indicator | Contact me if you have any questions The indicator is displayed in a separate window, it can be moved to any place on the chart. In the input settings you can adjust: Interface theme : dark / white; Calculation method: price, pips, points, % change;
Panel size Font size

Supply / demand zones: observable areas where price has approached many times in the past. My #1 Utility: includes 65+ functions, including this indicator | Contact me if you have any questions The indicator shows where the price could potentially be reversed again. Usually, the more times the price has been rejected from the level, the more significant it is. In the input settings you can adjust: Enable or disbale Weak zones; Show or hide zone description; Font size; Set the bas
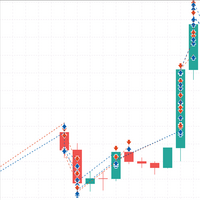
MT4 Version : https://www.mql5.com/en/market/product/87060 Matrix Hacker はヘッジされたアカウント専用で、ランダム ウォークを使用します。過去は関係ありません。 EA は、市場で安定した足場を維持し、アスクとビッドの両方をカバーするように設定されています。トレーダーに応じて、さまざまな量のサイズとボリュームでビッドとアスクを売買します。これは、最適化と過度のレバレッジについての知識が必要なため、初心者にはお勧めできません。小さなピップをスキャルピングし、範囲内に保つための設定を使用することをお勧めします.
この EA は 4 つの取引を開く可能性があるため、これを理解して、入力のサイズが正しいことを確認してください。固定ロット サイズを使用するため、固定ロットでの 4 つの取引を考慮する必要があります。ライブで取引する前に、この EA を最初にデモで使用し、確信が持てるまで増分ロットでのみライブに移行します。マイクロロットごとに1000ドルをお勧めします。デイトレードでは、DMA ブローカーを使用し、ス
Current strength of the 8 major currencies My #1 Utility: includes 65+ functions, including this indicator | Contact me if you have any questions The indicator is displayed in a separate window, it can be moved to any place on the chart. In the input settings you can adjust: Interface theme : dark / white; Prefix and Suffix, if the currency pairs on your broker have it:
(e.g. if Symbol is "EURUSD .pro ", please set " .pro " as a Suffix); Panel size Font size

Ichimoku Aiko MTF is a collection of technical indicators that show support and resistance levels, as well as momentum and trend direction. It is a multi-timeframe indicator so you don't need to change the chart timeframe when you want to see the ichimoku clouds on a higher timeframe. eg. The chart timeframe is M15 and you want to see on the M15 timeframe chart the H1 ichimoku indicators (the ichimoku in Metatrader can't do that) that's why you need to use Ichimoku Aiko MTF.
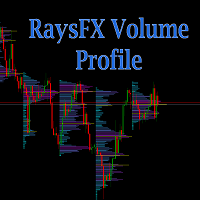
Calculation method The calculation method is summing the number of deals performed at a certain price. Alternatively, the volumes at a certain price can be summed if the real volume type is set in the parameters. The trade data is interpolated based on the most accurate terminal data available (М1 timeframe data). Each bar is divided into several trades based on the estimated price movement inside the bar. This is a distinguishing feature of the product setting it apart from other ones that hav

THIS EA WILL BE PERMANENTLY TAKEN OFF MQL5 ONCE IT HAS REACHED 24 BUYERS IN ORDER TO PREVENT OVERSATURATING THE MARKET. 6 have been sold already, SO GET IT WHILE YOU STILL CAN!!!
!!!ATTENTION TRADERS!!! Buy MarketMaster and get ALL of my other EAs for ABSOLUTELY FREE!!! LIMITED OFFER!!! Download the entire trade journal of the last 15 years in csv format here → drive.google.com/file/d/1wsN06BgD_VzRnAgbISk8-QhD8MGHXN-L/view I recommend you to open it with LibreOffice Calc if Microsoft Excel g

Harpoon :It is a fully functional automated system that uses a tested strategy to exit statistically significant price levels and adapts to different conditions. This system is adjusted taking into account the delay in the execution of orders at different stages of the transaction. Expert Advisor uses price action to determine levels, which is an undeniable advantage compared to constantly lagging indicators. Signal : https://www.mql5.com/en/signals/1251860
Considering that this expert mus

XFlow shows an expanding price channel that helps determine the trend and the moments of its reversal. It is also used when accompanying transactions to set take profit/stop loss and averages. It has practically no parameters and is very easy to use - just specify an important moment in the history for you and the indicator will calculate the price channel.
DISPLAYED LINES ROTATE - a thick solid line. The center of the general price rotation. The price makes wide cyclical movements around the
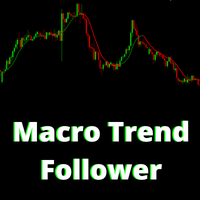
The Indicator assists in decision making along with the user's market reading. By drawing the trend, this indicator becomes very useful on days of high volatility in the market, that is, it offers strategic insights on days of economic data, news or pronouncements. On flat market days it becomes usual to identify possible market reversals. Follow Youtube to understand the most suitable scenarios for its use.
Algo Bot is an expert advisor that is designed and optimized for GBPUSD. It is extremely easy to use, just open the GBPUSD pair, load the bot and activate Algo Trading. You can leave the default values. This bot does not use any technical indicator, its algorithm is based on price action, placing BuyLimit and SellLimit orders in optimal zones for GBPUSD.
The parameters of the EA are: Magic number: Number to identify the positions of this EA. Points to place the next order: Points at which the

Um Inside Bar é um dos principais sinais de continuidade de uma tendência existente e as vezes reversão, pois nos mostra locais especiais de entrada, possibilitando uma boa taxa de Risco x Retorno. É simples visualizar um Inside Candle. Esse padrão é formado por apenas dois candles. O primeiro deve ser, preferencialmente grande, e o segundo deve estar integralmente contido dentro dos limites de máxima e mínima do primeiro.

Current : This first version of AlgotradeClub EA was developed by the strategist with a focus on CFD operations on Global Indices (Us500, UsTec, Fr40, etc.). Operates the main direction of the trade only buy positions opening positions in bar opening respecting the minimum distance as parameterized. There is an option to open sell positions after “n” buy positions, placing Stop Gain of each sell when the buy position “n+1” is executed. The closing of each trade takes place through the financial

Advance Trend Intellegence EA is Powefull Expert Advisor base on trend following strategy. This expert using advance dynamical algorithm to cathching the market trend. With this EA orders that are made accurate entry orders in the market in tune with the trend signal. This EA have a good performance that has been tested more than 1 years with real ticks history data.
Although this EA can be use on any pairs, but please Use this EA on EURUSD Pair at M15 timeframe. Account type : HEDGE.
Adva

The KT Tether Line is a trend-following tool consisting of three indicators that work together to generate trading signals. It can correctly identify market trends while signaling trade entries. It was first introduced by Bryan Strain in the Stock & Commodities magazine in 2000 in "How to get with the trend and out at the end."
The Concept
When a market trend is confirmed, the most challenging part is determining the timing of the entries. This indicator alerts you to potential trend reversal

The BSI stands for Bar Strength Index. It evaluates price data using a unique calculation. It displays readings in a separate window. Many financial investors mistake this indicator for the Relative Strength Index (RSI), which is incorrect because the BSI can provide an advantage through its calculation method that the RSI indicator does not. The Bar Strength Index (BSI) is derived from the Internal Bar Strength (IBS), which has been successfully applied to many financial assets such as commodit

KT Price Border creates a three-band price envelope that identifies potential swing high and low areas in the market. These levels can also be used as dynamic market support and resistance. The mid-band can also be used to identify the trend direction. As a result, it also functions as a trend-following indicator. In addition, its ease of use and more straightforward conveyance of trade signals significantly benefit new traders.
Features
It works well on most of the Forex currency pairs. It

Monitoring Account MT4 Version
Wirama Rush M9 MT5 is advance trading system use multilevel support and resistance to find the best price in market, integrated with the best risk management to open position carefully in moderate lotsize.
Main Pairs : NZDCAD,AUDNZD,AUDCAD Time Frame : M15 Minimum balance to start with $5000 or cent account Only 10 copies of the EA out of 10 left at $199 Next price $299 Features: Multiple currency pairs support True backtest support TDS (no hardcod
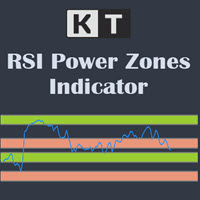
The KT RSI Power Zones divides and shows the movement of RSI into four different power zones to identify the potential support and resistance zones using the RSI.
Bull Support The bull support ranges from 40 to 50. The price is expected to reverse to the upside from this zone.
Bull Resistance The bull resistance ranges from 80 to 90. The price is expected to reverse to the downsize from this zone.
Bear Support The bear support ranges from 20 to 30. The price is expected to reverse to the

Multy TDM this bot works using the Trend TD indicator. The multicurrency bot works with 12 pairs, pairs can be changed and others can be used.
The essence of the work is to open a small series of orders and exit the market either in profit or with losses, but exit and not linger and open the next series on the signals of the indicator. The heart of this algorithm is the formula for exiting the market, when to exit and with what profit or loss, how many orders can be allowed to be used in

PRESENTATION Live performance
"Terminator" EA is based on oversold and overbought RSI levels (~Vzlomshik) . To work correctly, advisor trading platform should be included with the opening of the market on Sunday night before it closed on Friday evening. Currency pairs: GBPUSD, AUDUSD, USDCAD, EURUSD, EURGBP, EURCHF, USDCHF Timeframe: H1
PARAMETERS General: UseManualLots : if you use the initial lot (Lots) greater than 0.01, it must be set to TRUE Lots : the initial bid, defaults to 0.01

快適なFX取引を実現する多通貨取引ロボット。カスタマイズ可能なパラメータは最小限であるため、初心者から経験豊富なトレーダーまで幅広く対応します。取引ロボットを1つの通貨ペア、例えばEURUSDにインストールし、結果を見るだけで、それ以上の操作をする必要はありません。VPSサーバーやブローカーは必要ありません。継続的な最適化を必要としない信頼性の高いボット - 一度インストールし、設定すれば忘れることができます。 *write me after purchase to get the second version as a gift
Signal: https://www.mql5.com/en/signals/1722303 MT4 - https://www.mql5.com/en/market/product/86883
必要条件
M15タイムフレーム
最低入金額 1000ドル
レバレッジ1:500
VPSサーバー
botのインストール方法と設定方法。
1. EURUSD通貨ペアにボットをインストールする
2. セットタイム

KT XMaster Formula is a buy & sell signal indicator that works magically on most of the timeframes and currency pairs when used correctly.
The indicator uses calculations based on moving averages, RSI, and MACD. It is usually appropriate for scalping and trend trading - whether you are a novice or an experienced trader, the signals generated by this indicator are simple to understand and implement.
Overview The indicator comprises green and red dots arranged in wavy lines. These dots corre

In MetaTrader, plotting multiple horizontal lines and then tracking their respective price levels can be a hassle. This indicator automatically plots multiple horizontal lines at equal intervals for setting price alerts, plotting support and resistance levels, and other manual purposes. This indicator is suitable for Forex traders who are new and looking for chances to make quick profits from buying and selling. Horizontal lines can help traders find possible areas to start trading when the

The KT De Munyuk is a trend-based indicator that uses Parabolic SAR to identify the market direction. The indicator shows the PSAR in the form of green/red dots using a separate window. Buy Signal: When a green dot appears after a series of at least three red dots. Buy Exit: When a red dot appears on the current or next higher time frame. Sell Signal: When a red dot appears after a series of at least three green dots. Sell Exit: When a green dot appears on the current or next higher
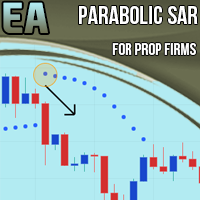
Parabolic SAR EA for Prop Firms is an Expert Advisor designed specifically to overcome the challenges of Proprietary Firms such as MyForexFunds and obtain a founded account. In fact, it has specific functions to comply with the rules imposed by the companies that offer managed accounts.
- It is based on a strategy with Parabolic SAR , EMA and ATR indicators that tell the EA when to open positions and where to set the stop loss.
- Works on all Forex pairs, recommended on M5, M6, M10 timefram

Do you know what is The Blue Ocean Strategy ?
It is when an entrepreneur goes on a brand new market with no concurrence because nobody knows about it. This way, the entrepreneur is in a situation of monopoly and can enjoy this situation as long as nobody comes into the market. And you know what ? This situation is reproducible in bot trading thanks to the Blue Ocean Strategy EA MT5.
I’m a prop firm trader and I use it myself to make all my trades. After many years of use, a friend told m

KT Forex Blau Balance combines elements of momentum and volatility. It helps you identify entry and exit points.
Blau Balance consists of two moving averages (a slow-moving average and a fast-moving average) intersecting key transition points in market price. The indicator turns green or red when one is above or below the other, signaling to buy or sell trade signals.
It can be used in currency pairs and other markets that your MT4 or MT5 platform supports. Both short-term and long-term tra

The EA works with 24 pairs, it has been programmed with specific indicators designed by me, it is not the result of optimizations on past facts and events. The EA is fully customizable from input. The EA is able to detect countertrend movements and therefore opens hedging positions until the new signal to protect the account from strong drawdowns (this is a rare fact. In the backtest 2 or 3 times at most) but it still manages to reduce the drawdoWn and avoid major stop losses. Don't judge EA by

2 copies left at 49 USD. Next price is 99 USD . set file
- This is a very aggressive trading strategy, based on a modified MACD indicator. It is used to analyze the anomalous zones of the market + author's methodology to restore the critical movement.
The strategy was developed taking into account the movement of the currency pair USDCHF and the best rates of trade just on it.
Recommendations:
- H1 USDCHF - Leverage of 1:500 or higher (ideally 1:1000 or 1:2000) - Minimum deposit 100 uni
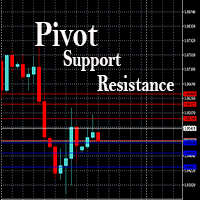
This EA is designed to calculate and draw Pivot Point, Support and Resistance for your selected time frame on the chart.
Works on all currency pair and on any time frames available on MT5.
To make sure the EA works, you need to select the pivot time frame as well as the candle shift that you want to calculate the pivot.
0 = Current candle on chart
1 = Previous 1 candle on the chart
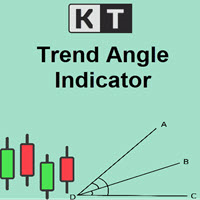
The KT Trend Angle helps to identify ranging and trending markets. The idea is to only enter a trade following the market trend if the slope is steep enough.
An angle is the ratio of the number of bars to the number of points: The bars mean the time offered by standard (M1, M5, etc.) and non-standard time frames. Points represent the unit of price measurement with an accuracy of 4 or 5 decimal places.
Input Parameters Period: An integer value to define the intensity of angled trendlines. A

Core TDM this bot works using the Trend TD indicator.
The essence of the work is to open a small series of orders and exit the market either in profit or with losses, but exit and not linger and open the next series on the signals of the indicator. The heart of this algorithm is the formula for exiting the market, when to exit and with what profit or loss, how many orders can be allowed to be used in a series. And the settings of the Trend TD indicator. The bot works throughout history, but y

Trend TD is a trend indicator. Thanks to the algorithm of this indicator, the signal will never go against the trend. Thanks to the two lines forming a narrow channel, the algorithm for analyzing entry points, the algorithm controls the reversal moments at the moment when the upper line of the channel has reversed and it is possible to visually draw a line crossing the upper line with itself in the past, while crossing the lower line at one point. If this rule is fixed, then the signal will b

Short TD this bot works using the Trend TD indicator.
The essence of the work is to open a small series of orders and exit the market either in profit or with losses, but exit and not linger and open the next series on the signals of the indicator. The heart of this algorithm is the formula for exiting the market, when to exit and with what profit or loss, how many orders can be allowed to be used in a series. And the settings of the Trend TD indicator. The bot works throughout history
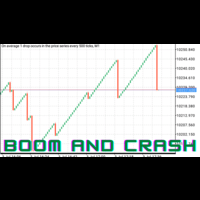
The BoomAndCrashEA , based on vector machine learning, is an advanced trading tool that uses the latest advances in computing technology to analyze the forex market and predict future price movements. The Expert Advisor will use vector machine learning to learn huge amounts of historical data and quickly and efficiently detect patterns in the market. It will use a sophisticated and complex proprietary algorithm which uses advanced mathematical calculations to solve complex problems and optimize
Alligator EA for Prop Firms is an Expert Advisor designed specifically to pass the challenges of Proprietary Firms such as MyForexFunds and obtain a founded account. In fact, it has specific functions to comply with the rules imposed by the companies that offer managed accounts. Link for tutorial, detailed description, manual and presets: https://www.mql5.com/en/blogs/post/751530
- It is based on a strategy with William's Alligator, EMA and ATR indicators that tell the EA when to open positio
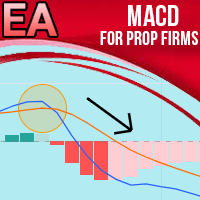
MACD EA for Prop Firms is an Expert Advisor designed specifically to overcome Proprietary Firms challenges such as MyForexFunds to obtain a founded account. In fact, it has specific functions to comply with the rules imposed by the companies that offer managed accounts.
- It is based on a strategy with MACD and EMA indicators that signals to the EA when to open positions
- Works on all Forex pairs, recommended on M5, M6, M10 timeframes.
- The EA should work on VPS 24/7
- Write to me pri

The Average Daily Range (ADR) is an indicator that shows how far a currency pair can move in a day.
Automatically displays the upper and lower ADR levels.
Automatically calculates the percentage and distance of ADR achieved by the currency pair for the day.
Changes the color and thickness of the ADR line when the price reaches it.
The payment is made in 14 days. It is displayed on timeframes from M1 to M30.
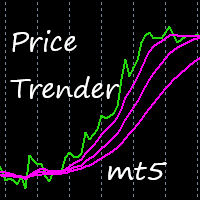
This indicator uses a special algorithm to plot the 4 lines for trading. Great for scalping. Features alerts. Settings for trend filters. How to use: Simply attach to any chart with default settings. Buy when the three pink lines converge below the green line. Sell when the three pink lines converge above the green line. Best results when looking at three or more time frames, and the three blue lines have just converged below or above the green line.
Use as you see fit for your strategy. Best r
5 EMA Scalping Strategy Multi Symbol Scanner
This EA utility will scan all symbols which are selected in marketwatch and alert when such condition is formed in chart when Candle low is above EMA 5 for Sell alert and Candle high is lower from EMA5 so you can be ready before selling or buying for scalping purpose on 5min chart For more details watch attached video Logic : When a candle closes above 5 EMA in 5 mins chart, Wait for its low to break and Sell when low is broken by wick, Your SL sh

The Envelopes M indicator is based on the popular Envelopes technical indicator, which is used to create flexible channels where prices stay most of the time. The boundaries of these corridors are two moving averages. But the application that the price is in the channel most of the time is not completely correct, since the channel often breaks out and the price falls far beyond the channel. The main difference of this indicator is that with each new channel breakout, the channel line expands fo

Core Long this bot works with the help of two iEnvelopesM indicators (modified iEnvelopes) and one iFractals trading principle for buying and selling at the same time.
The essence of the work is to open a series of orders and exit the market either in profit or with losses, but exit and not linger and open the next series according to indicator signals. The heart of this algorithm is market exit formula, when to exit and with what profit or loss, how many orders can be allowed to be used in a

Overview This expert advisor is based on statistic model created using historical data. Our model lead to prepare parameters to drive Martingale strategy. It plays on USDCAD pair. To work proper with full strategy EA should be able to open total positions of 3.62 lots (sum of all possible open positions at the same time) and some margin for safety. For example it can be approximately at least 1200GBP with 500:1 leverage on account. It must be able to play 0.01 lots positions. Screenshots presen

Seven copies left at $99 USD. Next price is 149 USD . set file Smooth Lift is an indicator-based trading system that includes 7 indicators, including trend indicators, volume indicators and indicators of possible price movement strength. They are used to confirm the analysis of the main Smooth Lift trading system. The trading is performed on 24/5. The strategy was developed taking into account the movement of the currency pair USDCHF and the best trading performance is on it.
Recommendations:

This EA watches for trend reversals and pullbacks and opens a position in the right direction based on them. It opens up to three positions in one direction. The exit from a position is based on several criteria. This EA is optimized for the EUR/USD currency pair and the M15 timeframe, but works good on: EUR/USD M10, M12, M20, M30 AUD/NZD M15, M20 NZD/CAD M15, M20 No need to worry about complicated settings. According to the size of your account, enter the starting lot.
Buy Start Lot
Sell Sta

Violence Great Wall is an MT5 intelligent trading robot. It takes into account the price support and pressure position, and provides phased prediction in the future, accurate opening position, and stable stop loss position. The main trading variety is gold! To be on the safe side, it is recommended that you provide funds above 3000 dollars, and leverage above 1:500. The position opening is extremely accurate, but due to the complexity of position opening factors, we must keep EA running stably
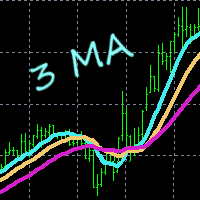
This indicator gives you a modified version of three Moving Averages. Great for scalping. Does not feature any alerts, and is best used manually after confirming multi line displays. Settings: Period1 Period2 Period3 Period4 How to use: Simply attach to any chart with default settings. Buy when the 4 lines converge below the price. Sell when the 4 lines converge above the price. Take note of the slope of Period4. See example pictures below. Best results when looking at three or more time frames
MetaTraderマーケットが取引戦略とテクニカル指標を販売するための最適な場所である理由をご存じですか?宣伝もソフトウェア保護も必要なく、支払いのトラブルもないことです。これらはすべて、MetaTraderマーケットで提供されます。
取引の機会を逃しています。
- 無料取引アプリ
- 8千を超えるシグナルをコピー
- 金融ニュースで金融マーケットを探索
新規登録
ログイン