YouTubeにあるマーケットチュートリアルビデオをご覧ください
ロボットや指標を購入する
仮想ホスティングで
EAを実行
EAを実行
ロボットや指標を購入前にテストする
マーケットで収入を得る
販売のためにプロダクトをプレゼンテーションする方法
MetaTrader 5のための有料のエキスパートアドバイザーとインディケータ - 15

50% off. Original price: $60 Triangle Finder is a multi symbol multi timeframe dashboard that finds symmetrical triangle pattern in 28 symbols and 9 timeframes with a deep scan feature to scan all market watch symbols (up to 1000 instruments!).
Download Demo here (Scans only M1, M5 and M10) Settings description here MT4 version here
Triangle Finder features: Realtime monitoring of 28 customizable instruments and 9 timeframes at the same time. Deep scan mode to scan all market watch sym
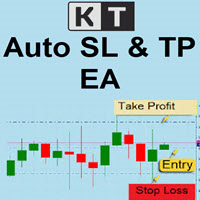
KT Auto SL TP automatically sets the stop-loss and take-profit as soon as it detects manually placed orders on the chart. It can effortlessly place the stop-loss and take profit for the market, limit and stop orders simultaneously.
Features
It can set the stop-loss and take-profit for all the active symbols from a single chart. Equipped with trailing stop-loss with steps. Seamlessly works for the market and pending orders. Shows the informational text information on the chart.
Inputs Cur

「Hypercon Pro MT5」は、古典的な取引戦略に基づいた多通貨エキスパートアドバイザーです。 市場のエントリーポイントは、ボラティリティの特性と取引される通貨ペアの現在のダイナミクスを考慮して、自動的に決定されます。 リスクを軽減するために、セント口座の使用をお勧めします。 信号。 入力データ: 1. ポジションをオープンする "Period_" : チャートの時間枠は、オープンポジションの強度を決定します。 期間が短いほど、取引はより積極的になります。 "Choosing_a_strategy" : 「Strategy_1: Lot_from_Take-Profit」 - 「Take-Profit」のデータを設定すると、ポジションボリューム (「Lot_」) が自動的に計算されます。 "Strategy_2: Take-Profit_from_Lot" - "Lot_" のデータを設定すると、"Take-Profit" ("Take-Profit_Closed" の場合) または "Stop-Loss" ("Trailing_SL_Closed" の場合) が自動的に

Aiトレンドスポッター(Dオリジナルズ)。
外国為替の崩壊。
私たちはよく「 証券会社はどうやってお金を稼いでいるのですか? 」と尋ねますが、私たちは小さな取引で勝ったことを祝います。
しかし、(D Originals) を使用した後は、「どうやって一晩で金持ちになったのか?」と自問するでしょう。
とても深いので、行動は声よりも雄弁です。
Ai Trend Spotter を使用すると、次のことを恐れる必要はありません。
*市場操作
*相場反転
* スナイパーの登場と存在
*キャンドルジャンプ
このインジケーターは MT5 プラットフォームで取引可能なすべてのペアに対応しており、98.9% の取引能力を強化する 3 年間のプロジェクトです。
ぜひ手に入れて、使って、後で私に感謝してください。
あなたのスターがやって来ました

Royal Wave is a Trend-Power oscillator which has been programmed to locate and signal low-risk entry and exit zones. Its core algorithm statistically analyzes the market and generates trading signals for overbought, oversold and low volatile areas. By using a well-designed alerting system, this indicator makes it easier to make proper decisions regarding where to enter and where to exit trades. Features Trend-Power Algorithm Low risk Entry Zones and Exit Zones Predictions for Overbought and Over

RSI Entry Points is the upgrade of the standard RSI indicator to avoid lagging. Indicator draws the clouds and the arrows to have clear picture where price is and what to wait for. Why standard RSI is lagging? because mostly we do not use it correctly and it is with very weak visual flexibility, less informativity. With my current upgrade I tried to Fix both problems same time and I got much better results and more exact entries than standard RSI has. To make yourself sure check out the screens

To get access to MT4 version please click here . This is the exact conversion from TradingView: QQE MT4 Glaz-modified by JustUncleL This is a light-load processing and non-repaint indicator. All input options are available. This is not a multi time frame indicator. Buffers are available for processing in EAs. You can message in private chat for further changes you need.

Entry base on Quantitative method. DCA if the trend is not support the first Entry.
Requirement Account leverage min 1:500 Deposit min:50.000 Cents (please use for Cents account). Recommend Symbol trade: Any Currency or XAUUSD Deposit min: use Cents account, mininum 10.000 Cent (100 usd) for ONE CURRENCY ONLY. If you use 20.000 Cents, you change MultiLevel to 2 and so on ... Leverage 1:500 DCA method: Exponential DCA auto range = true DCA range: 1$ (100 points) Volume start: 0.01 lot DCA tra

Automate your MACD strategy!
This EA alerts and/or places orders according to MACD strategies with additional filters. It means that you can use it by 2 different ways: Receive alerts based on your MACD strategy with filters on multiple symbols simultaneously in a single chart window; Choose the fully automated mode and let EA place orders based on your MACD strategy, filter choice and money management. This EA works with all broker symbols and contains multi-symbol modes (market monitoring,

Welcome! We are delighted to introduce our latest expert, which is a semi-automatic trading system that includes all the features you need for position management. Simply draw a line on a significant trend or supply-demand level, and the expert will take care of the rest for you. It comes with a wide range of risk management and position management tools, such as trailing stop, partial closure, break even, determination of stop loss and take profit levels using ATR, as well as automatic lot siz

Professional range bar charting on a custom symbol chart accurate pricing to the tick accurate timeline (no future date projections) very responsive charts An Expert Advisor (EA) is used to create a RangeBar custom chart and provide real-time updates. It is an MT4 "offline" range bars chart equivalent. The simplicity of use - Attach the EA to any time-based chart that you wish to see Range Bars for, input your desired parameters and you are ready to go! You can attach any MT5 compatible indicat

The Relative Strenght Index presented to the world in 1978 by J. Welles Wilder Jr. in his book " New Concepts in Technical Trading Systems " is widely used around the world in several ways, not only with the traditional approach of Overbought and Oversold states, which in several cases and depending on the assets and timeframes it just simply doesn't work anymore . BUT, this indicator has its value when used, for instance, looking for divergences between its measuring system and the Prices appea

The indicator is designed to close positions on the market in time. For example: to take profits ahead of schedule if the price has not reached TakeProfit, and the market is turning around. The indicator analyzes the momentum, not the trend. He does not give any information about the trend. The indicator is well suited for finding divergence. The Ershov 38 Parrots indicator dynamically adjusts to the market and detects price movement impulses of medium and high amplitude. It almost does not rea

BUY INDICATOR AND GET A PIVOT POINT EA FOR FREE AS A BONUS + SOME OTHER GIFTS! Attention, the MT5 version of this application does not work on strategy tester, only on live accounts or demo accounts on live market. If you need an MT5 demo version of the Indicator send me a private message here: https://www.mql5.com/en/users/italobr ITALO PIVOTS INDICATOR is the best pivot point indicator for strong price reversals and continuations of price movements ever created, and why is that? You

It's a comprehensive solution designed to navigate the complexities of the forex market. With a meticulous focus on risk management, diversified strategies, and extensive backtesting, this EA offers confidence to navigate the markets with precision and poise.
Key Features: 1. Proven Performance: Backtested rigorously over almost 6.5 years with history quality of 100% including trading costs like swap, slippage, live spreads and commission , providing a robust foundation for consistent performa

MetaForecastは、価格データのハーモニクスに基づいて、どんな市場の未来を予測し視覚化します。市場が常に予測可能ではありませんが、価格にパターンがある場合、MetaForecastは可能な限り正確な未来を予測できます。他の類似製品と比較して、MetaForecastは市場のトレンドを分析することでより正確な結果を生成することができます。
入力パラメータ Past size (過去のサイズ) MetaForecastが将来の予測を生成するために使用するバーの数を指定します。モデルは選択したバー上に描かれた黄色の線で表されます。 Future size (将来のサイズ) 予測すべき将来のバーの数を指定します。予測された将来は、ピンクの線で表示され、その上に青い回帰線が描かれます。 Degree (程度) この入力は、MetaForecastが市場で行う分析のレベルを決定します。 Degree 説明 0 Degree 0の場合、価格の全てのピークや谷、そして詳細をカバーするために、「Past size」の入力に大きな値を使用することが推奨されています。 1 (推奨) Degr
Indicator that synchronizes the charts, that is, when the asset is replaced in one of the charts, all those that appear with the synchronized indicator are changed, with the same timeframe (Same_Timeframe = true) or with different timeframes (Same_Timeframe = false). The graphics to be synchronized are identified by color (Label). To synchronize the indicators, the indicator must be inserted in all charts to be synchronized, using the same color (Label). A box with the chosen color (Label) and

Hello, Every one
This is "Close All Button" future 2
A script to manage order and close all market positions and/or pending orders.
----------------------------------------------------------------------------------- This is Close All Market positions and/or pending orders button
You can close all or manage orders in 1 second by one click
------------------------------------------------------------------------------------
Download for Demo Account: Demo version: Close 1s manage v1.7 D

MACD (short for M oving A verage C onvergence/ D ivergence) is a popular trading indicator used in technical analysis of securities prices. It is designed to identify changes in the strength, direction, momentum, and duration of a trend in a security's price.
History Gerald Appel created the MACD line in the late 1970s. Thomas Aspray added the histogram feature to Appel's MACD in 1986.
The three major components and their formula 1. The MACD line: First, "PM Colored MACD" employs two

The GGP SuperTrend MT5 Indicator is a technical analysis tool that can assist investors in identifying market trends. The indicator is based on ATR and is very useful for capturing the direction of an asset’s momentum and is widely employed when looking at stocks, currencies, and commodities. It plots a line on the price chart, which acts as a dynamic level of support or resistance, helping traders and investors make informed decisions about entry and exit points. This indicator is MT5 conversi

An indicator for making all time frames Easily create any time frame you want. From one minute to 10,000 minutes Applicable in all symbols, markets and ... Just run this indicator in the time frame "one minute" (in the desired symbol) Select the desired timeframe settings and then run the indicator You can also choose the color of the candlesticks yourself
Features of this indicator:
Applicable to all symbols
Can be used in all time frames (it is better to run in 1 minute time frame)

KT Trend Magic shows the trend depiction on chart using the combination of market momentum and volatility. A smoothing coefficient is used to smooth out the noise from the signal.It can be used to find out the new entries or confirm the trades produced by other EA or indicator.
Features
Drag n drop MTF scanner which scans for the new signals across multiple time-frames. Find new entries in the trend direction. Improve the accuracy of other indicators when used in conjunction. Can be used as a

Hedging Pro Ultimate uses a trend follow strategy coupled with virtual pending orders to maximize profits, virtual close partial to minimize drawdown and close by opposite signals if there is a change in trend to minimize losses. Hedging Pro Ultimate works fully automatically without manual intervention and is equipped with a news filter. MT4 Version | Product Guidance | Setfile Suggested pairs: EURUSD, GBPUSD, XAUUSD
Expert parameters: 1. Manage Open Positions + Open Position Mode: Select

AI TRADER SetFile: https://www.mql5.com/en/market/product/96974#!tab=comments&page=1&comment=46266446 AI Trader has been refined and backtested more than 1000 times! Introducing the AI Trader - the revolutionary new tool for traders who want to maximize their profits and stay ahead of the curve. With its intelligent algorithm, the AI Trader analyzes the market, trades and adapts to it, ensuring that both your market entries and exits are on point. Unlike most indicators which lag or repaint, the

Allows multiple indicators to be combined into a single indicator, both visually and in terms of an alert. Indicators can include standard indicators, e.g. RSI, CCI, etc., and also Custom Indicators, even those purchased through Market, or where just have the ex4 file. An early alert is provided, say when 4 out 5 indicators have lined up, and a confirmed alert when all are in agreement. Also features a statistics panel reporting the success of the combined indicator by examining the current cha

Gold Venamax - これは最高の株式テクニカル指標です。 指標アルゴリズムは資産の価格変動を分析し、ボラティリティと潜在的なエントリーゾーンを反映します。
インジケーターの機能:
これは、快適で収益性の高い取引のためのマジックとトレンド矢印の 2 つのブロックを備えたスーパー インジケーターです。 チャート上にブロックを切り替えるための赤いボタンが表示されます。 マジックはインジケーター設定で設定されているため、異なるブロックを表示する 2 つのチャートにインジケーターをインストールできます。 Gold Venamax は、異なる矢印バッファー (GV と SF) を備えた 2 つのチャートに配置できます。 これを行うには、設定で異なる Magic を選択する必要があります。たとえば、あるマジック = 999、別のマジック = 666 を選択します。次に、チャート上の赤いボタンで矢印バッファを選択できます。 入力するのに最適な信号 = 両方のバッファ (GV および SF) の信号矢印 + 3 本すべての MA ライン (赤または青) の方向に従います。
イ
UPDATE MAR/20 OBS: Please after purchase contact US via CHAT to suport. This Product is a Market Scanner based on Didi Index Indicator. He can scan all time frames of Symbols in Market Watch, client can customize according the demand, its can scan a single symbol or more than 100.
Manual: Link Driver Link do Manual Video: LINK The Scanner informs 4 kind of signals, all alerts are providing from Didi Index Indicator:
1 - Didi Index - Alert of Buy : Cross up of "Curta" short moving averag

The market is unfair if only because 10% of participants manage 90% of funds. An ordinary trader has slim changes to stand against these "vultures". This problem can be solved. You just need to be among these 10%, learn to predict their intentions and move with them. Volume is the only preemptive factor that faultlessly works on any timeframe and symbol. First, the volume appears and is accumulated, and only then the price moves. The price moves from one volume to another. Areas of volume accumu

Only 2 copies available for $99.00. Next price 199 USD
AI Breakdown is a scalping strategy based on artificial intelligence. Most trading parameters will be automatically retrained and adjusted to the current market thanks to the author's algorithm of market analysis. The strategy does not require any optimization. Set it on the chart according to the recommendation and enjoy trading!!!
Advantages of AI Breakdown: - self-learning parameters - optimal SL/TP ratio - low SL, which makes th

Easy Trend , as the name implies, is an indicator that easily shows the prevailing trend by bringing several indicators into one. The strategy is: when all indicators point in the same direction a signal is triggered. When red, is a signal to sell, when blue, signal to buy. It is that simple :) There are a total of 9 indicators: Moving Average, RSI, CCI, Parabolic SAR, William's Range, Stochastic, MACD, ADX and Heiken Ashi. It is possible to configure each of these indicators to suit your way of
ピボットポイントマスターは、伝統的なテクニカル分析と人工知能を組み合わせて市場の動きを予測する完全自動のExpert Advisorです。このEAは、様々なシンボルからのデータを使って学習された強化学習(RL)を利用します。したがって、Pivot Points Masterは、適切なパラメータを設定しさえすれば、ありとあらゆる資産で機能します。US100、US500、US30などの米国の主要な指数は、ピボットポイントに非常に敏感であるため、このストラテジーに最も適した資産と言えます。 このストラテジーの詳細については、このブログ記事をお読みください。 : https://www.mql5.com/en/blogs/post/752239 注:本商品は限定紹介商品です: このEAを現在の価格で販売するのは5枚中2枚のみです。次の価格:250ドル このEAの価格は、このシステムで取引するユーザー数を制限するために、着実に引き上げられる予定です。 MT4 バージョン : https://www.mql5.com/en/market/product/95981 設定方法 以下のスクリ

現在の、すべての、または選択されたチャートの取引手段を変更し、時間枠を変更し、すべてのチャートを履歴内で(自動的にまたはクリックして)同時に移動するように設計されたユーティリティ。シンボルのリストは、「市場の概要」から読み取られます。ボタンの色、サイズ、位置を変更できます。チャートの同期は、同期ボタンをクリックしたとき、またはマウス/キーボードを自動モードで移動したときに、アクティブなチャートの最初の表示バーの時点で発生します。 TFは、カーソルキー(左/右)と取引記号(上/下)を使用して変更できます。 8つの主要通貨のボタンを使用すると、通貨ペアのリストからチャートを開くことができます(市場の概要またはユーザー文字列から取得)。新しいチャートのテンプレートは、「新しいチャートのテンプレート名」パラメーターで指定できます。通貨を変更すると、現在のチャートのテンプレートが保存され、インジケーターによって開かれたチャートでペアの通貨が置き換えられます。通貨を再度選択すると、対応するテンプレートが読み込まれます。
複製モードでは、オブジェクトを現在のツールのすべてのチャートに一度にコピーで

このツールで市場構造を素早く分析し、重要な価格水準を活用しましょう。
市場構造 このカスタムインジケーターは、重要な価格水準をプロットし、エントリーポイントや利益目標として使用できます。
取引レンジの特定 このインジケーターを使用して、相場の転換点を考慮しながらスキャルピングを行いましょう。
ブレイクアウトの取引機会 このインディケータを使用して、ブレイクアウトの機会を見極めましょう。この取引戦略は、優れたリスクリワードレシオを可能にします。
カスタムアラート 価格が特定の取引レンジをブレイクアウトすると、携帯電話やEメールで通知されます。アラートをカスタマイズしたい場合は、お気軽にメッセージをお送りください。
スマートマネーのコンセプト このインジケーターは、自己勘定トレーダーのスマートマネーのコンセプトに従って開発されました。
シンプルなデザイン チャート上にすべての可能なゾーンをプロットするのではなく、フォローすべき主要なレベルのみをプロットすることにしました。従って、このインジケータはシンプルで、初心者に適したツールとなって

Arguably THE MOST PROFITABLE SYSTEM..... WITH EXTREMELY ::::::::::TIGHT STOPLOSS::::::: Introduction PRICE of only 199/- (limited period)
- Extremely TIGHT STOP LOSS on EVERY TRADE (only 20 pips STOP LOSS) - EXTREMELY HIGH WIN RATIO STILL :::::::::: 90% ::::::::::::: - SUPER HIGH PROFITS ::::::::::: BACK TEST SHOWS 1000 ==> 3.2 million in 13 years - QUICK SCALPING ... TIGHT SCALPING...
IS THE HOLY GRAIL of All Systems as it has EVERYTHING - 90% WIN RATE - Super high return $ 10
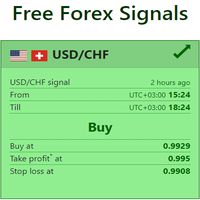
Live Forex Signals サイト信号での取引用に設計されています https://live-forex-signals.com/en と https://foresignal.com/en . Live Forex Signal for MetaTrader 4 https://www.mql5.com/en/market/product/81445
パラメータ サイトへのサブスクリプションを持っている場合は、ユーザー名とパスワードlive-forex-signals.com/foresignal.com サブスクリプションがない場合は、フィールドを空のままにします; オープンされているお得な情報へのコメント リスクリスクは、取引のための預金の割合として、リスク=0の場合、値ロットが使用されます 取引のためのロット固定ボリューム UseTakeProfitは、サイトから利益を取る使用します 当サイトからのご利用停止のご案内 F r e c h encysignalupdateinminute顧問のサイトへの訪問頻度を指定します MaximumSpreadFor

Here we have the Start Midas Fibo Bands , I confess that it is an indicator that excited me enough to operate because I was able to find more defined rules. Well, the indicator has the functions of the other indicators of the Start line , which is a possibility to plot several Midas on the screen, you can move the anchor point using keyboard shortcuts and use the legend to differentiate one anchor from another. The rules that I have analyzed for my possible setup are recommended to the entry, st

Ilan is a well known algorithmic trading system with its advantages and inconveniences. He is reputed to have good results when the prices are in a range but also to blow up the accounts in the case of strong trend. From a basic Ilan system, I added a trend filter to detect range periods, so that it trades only during these periods. I have also added a feature allowing it to adapt to economic news, it will not trade from one to several hours before and after a news depending on its importance. O

HYT (Help Your Trading) is a tool designed to help you average down your losing positions using two main techniques: Standard averaging . Hedging with subsequent opening of positions in the direction of the trend . Buy 1 and 1 get FREE This tool allows you to manage multiple positions opened in different directions, both for buying and selling. HYT automatically calculates the size of the next position , order price, direction for averaging, and closing the position with a specified take-profit

AlphaWaveインジケーターでトレーディングの潜在力を解放しましょう! トレーディングに静けさをもたらす: AlphaWaveインジケーターは、チャートを滑らかにし、トレンドの方向を正確に読み取ることで、トレーディングに静けさをもたらすように設計されました。明確なトレードの決定を行うことはこれまでになく簡単です。 10つのモードを備えた革命的なスムージングテクノロジー: AlphaWaveインジケーターを使用して、スムーズでクリアなチャートの表示を体験してください。この革命的なスムージングテクノロジーは1つではなく、なんと10つのモードを提供し、トレーディングの体験を新たな次元に引き上げます!あなたのトレーディングスタイルに最適なモードを選択してください。 あらゆるアセットに対応可能: AlphaWaveインジケーターはどんなアセットにも最適に適応し、多岐にわたる市場でサポートします。どんな取引インストゥルメントでもその潜在力を引き出しましょう。 上昇および下降トレンド用のカスタムアラート: 特別なボーナスをお楽しみください!AlphaWaveインジケーターは上昇および下降トレン

Fully automatic multicurrency trading machine MT5/4
The advisor's strategy is based on trading volumes and statistics of the movement of trading instruments, the author's trading method, which shows excellent results over the past 7 years Multicurrency testing since 2016 with 99.9% real ticks, testing was carried out on the MT5 platform, with all traded currency pairs at the same time. The Expert Advisor has three trading strategies with a smart dynamic lot, which depends on the load on the d

この EA の開発における主な焦点は、市場のほとんどのグリッド システムに一般的に関連する大きなドローダウンのリスクを排除することによる安全性でした。最終結果は、類似のシステムよりもはるかに優れたパフォーマンスです。 信号およびその他の製品: https://www.mql5.com/en/users/mike_explosion/seller シグナルに関する注意: 私のシグナルは、通常スプレッドが高いスタンダード口座 (ECN ではない) でのハイリスクテストです。これは、EA が長期的には収益性があることを示すための私なりの方法です。私があなたに推奨するのは、常にデフォルトのリスク設定です。 市場で販売されている他のシステムや製品とは異なり、これは過度に最適化されておらず、リスクがなくドローダウンがほとんどない 100% の勝利取引を示しません。それは単に存在しません。バックテストをこれらの製品のライブ シグナルと比較すると、私が話していることが理解できます。この EA の動作は 100% 本物です。利益はリスクと対称であるため、リスクのない利益はあり得ません。分かり

BestPointOfInitiation是一个很好的短线交易指示器,能与 ShortBS ( https://www.mql5.com/zh/market/product/96796 )完美的配合,可以很好的指出最佳的buy和sell位置,指标不含有未来函数,不会重新绘制,不仅能够应用到自己的手动交易过程中,还能完全可以写入到自己的EA中。(如果你感觉到这个指标能够帮助你进行更准确的交易,请帮忙给个好评,希望我的作品能够帮助更多多有需要的人) ===================参数列表===================== fastPeriod: 9 slowPeriod:30 PassivationCoefficient:5 =================参考使用方法=================== 此指标可以适用于任何交易品种,能够用在任何周期。

Volality 75 Fractal Scalper Non-repaint The arrows appear on the current candle. momentum and trend based strategy Works on all timeframes from the 1 Minute to the Monthly timeframe Bollinger bands have been added to show the trend direction whether its bullish or bearish Blue fractal arrow is your buy entry Orange fractal arrow is your sell entry you can use the Vix 75 fractal scalper in combination with other indicators.
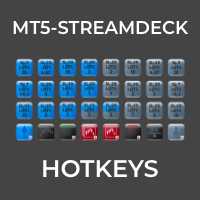
MT5-StreamDeck offers the possibility to use a certain number of pre-programmed Hot-keys with a clearly defined role. So by the push of a button you can open a trade with a pre-defined lot size, stoploss and take profit. Close all your trades, close the ones in profit, or in loss, set Break-even or set a trailing stop. All this with a Hot key button. See the feature list for all the actions that can take place at the push of a button. Ideal for Quick Scalping or day trading with set risk manage
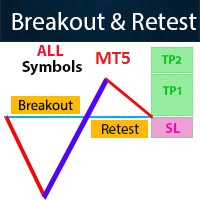
Contact me for instruction, any questions! Introduction The breakout and retest strategy is traded support and resistance levels. it involves price breaking through a previous level. The strategy is designed to help traders do two main things, the first is to avoid false breakouts. Many false breakouts start with a candlestick that breaks out of a level but ends with an immediate candlestick that brings the price back into the level. The second thing that the breakout and retest strategy does

Contact me for instruction, any questions! Introduction The Elliott Wave in technical analysis describes price movements in the financial market that are related to changes in trader sentiment and psychology. The 5 W Pattern (Known as 3 Drives) is an Elliott Wave pattern that is formed by 5 consecutive symmetrical moves up or down. In its bullish form, the market is making 5 drives to a bottom before an uptrend forms. In a bearish 5-drive, it is peaking before the bears take over. 5W Pattern S

1. Why did I develop this series of indicators
I found that most traders need to use multiple time frame indicators. They usually switch time frame to see indicators. However, once the timeframe is switched, you cannot see the corresponding relationship between the price in the smaller timeframe and the indicator in the larger timeframe . For example: if your price chart is in H1 timeframe, you can see H4, D1 and W1 indicators in H1 timeframe Chart. This is more helpful for you to find t

BeST_Darvas Boxes is a Metatrader Indicator based on the trading method developed in the 50’s by the Hungarian Nicolas Darvas . BeST_Darvas Boxes indicator draws the Top and the Bottom of every Darvas Box that can be confirmed on the current Chart draws Buy and Sell Arrows for every confirmed Upwards or Downwards Breakout of the above levels draws always only after the bar closing and so is non-repainting or backpainting it can be used as a standalone trading system/method
Inputs
Basic Sett
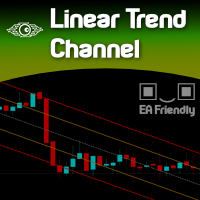
Imagine a way to automatically and clearly recognize the direction of the current market. Uptrend or Downtrend?
Forget about moving averages, there is a simple way to determine that. Welcome to the world of statistics. Welcome to the simple yet powerful world of Linear Regression. Just a complicated name for a genius and simple measurement.
Calibrating this indicator is pretty clear and obvious since the degree of freedom is total and deep.
Once calibrated to your desired Symbol/Asset,

If you’re searching for EA to pass prop firm challenge and reach minimum first payout, your search has come to the end. Avoid paying for prop firm challenge passing service and use Forex Prop Firm EA to pass the challenge and reach first payout within one week of trading or recover up to 200% of the challenge fee back. Forex Prop Firm EA is not HFT, martingale, grid or a speculative EA with unrealistic promises but a risk-free expert advisor based on winning mathematical formula designed to pa

Market Heartbeat is in your hand! Introduction The Market Heartbeat indicator with a special enhanced algorithm (volume, money flow, cycle of market and a secret value) is a very repetitive trend finder with a high success rate . Interestingly, this Winner indicator indicates that the trend has changed its direction or the end of a trend retracement or even appears at the range market. The Market Heartbeat can use in scalping trading or trend trading. It finds immediately with alarm, notificatio

The Breaker Blocks with Signals indicator aims to highlight a complete methodology based on breaker blocks. Breakout signals between the price and breaker blocks are highlighted and premium/discount swing levels are included to provide potential take profit/stop loss levels.
This script also includes alerts for each signal highlighted.
SETTINGS
Breaker Blocks
Length: Sensitivity of the detected swings used to construct breaker blocks. Higher values will return longer te

注目に値するエキスパートアドバイザー(2つのインデックスの6つのエキスパートアドバイザーで、必要な数の戦略を同時に取引し、1つのプログラムに圧縮)は、できるだけユーザーフレンドリーになるようにユーザーを念頭に置いて設計された、シンプルで理解しやすいインターフェースを備えています。意図された設計は、Boom1000/500/300とCrash1000/500/300を異なる戦略で同時に両方向(売買)で取引するエキスパートアドバイザーを忘れて、強力なプログラムにすることです。 初心者トレーダー: EAをデフォルト設定のままにして、Boom1000とBoom500とCrash1000とCrash500でエキスパートアドバイザーをアクティブにします。Boom300とCrash300インデックスはまだ最適化されていません。 経験豊富なトレーダー: 「使用する取引ルール」を「自動」から「ユーザー定義」に変更すると、取引したいすべてのインデックスに対して独自の戦略と入力パラメータを開発できるようになります。 あなたは私の プロフィールページ(ここ)にアクセスして私 に連絡して、私にメッセー

This Scalper uses a Quick Trading Strategy on Gold (XAUUSD). Dynamic Trading Grid Allows better risk management. Choose Between Higher and Lower Risk settings. Intelligent inbuilt news filter to filter out major news events. Safe stop loss and max lot size options for compatibility with funded accounts like FTMO. MQL5 Signal (default settings): https://www.mql5.com/en/signals/2112918 REAL BACKTEST DATA - no manipulation or backtest conditioning like other EAs! 99.9% Modelling Quality. MAIN SE
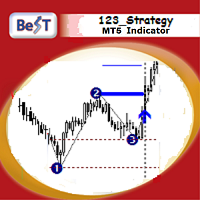
BeST_123 Strategy is clearly based on the 123 Pattern which is a frequent Reversal Chart Pattern of a very high Success Ratio .It occurs at the end of trends and swings and it’s a serious indication of high probability for a change in trend.Theoretically an 123_pattern is valid when the price closes beyond the level of #2 local top/bottom, a moment when the indicator draws an Entry Arrow, raises an Alert, and a corresponding Position can be opened.
The BeST 123_Strategy Indicator is non-repai

この指標は、W.D。Gannが書いた「市場予測の数式」の記事に基づく市場分析手法であり、9の2乗と144の2乗に依存しています。
ユーザーマニュアル:
Add Your review And contact us to get it
MT4のフルバージョンは次の場所から購入できます。
https://www.mql5.com/en/market/product/15316
あなたは無料でMT4でテストすることができます:
https://www.mql5.com/en/market/product/15320?source=Site +Profile+Seller#!tab=reviews
この製品は、レベル/スター/グリッド/ガンファン/として9の正方形を描くことができます。
ガンスクエアも描画します:52/90/144。
チャート上で直接移動可能なフリーガンスターを描画します。
また、ガンダイヤモンドを描画します。
それはあなたがあなたのエントリーのために最高のロットを計算することができるようにするロット計算機を

トレンドトレーディング は、タイミングのプルバックとブレイクアウトにより、市場で起こっているトレンドから可能な限り利益を得るように設計された指標です。確立されたトレンドの中で価格が何をしているかを分析することにより、取引の機会を見つけます。 [ インストールガイド | 更新ガイド | トラブルシューティング | よくある質問 | すべての製品 ]
自信を持って効率的に金融市場を取引する むち打ちにならずに確立されたトレンドから利益を得る 収益性の高いプルバック、ブレイクアウト、早期の逆転を認識する この指標は、独自の品質とパフォーマンスを分析します 複数時間枠のダッシュボードを実装します インジケーターは再描画されていません 電子メール/音声/視覚アラートを実装します 確立されたトレンドは多くの取引機会を提供しますが、ほとんどのトレンド指標はそれらを完全に無視しています。インジケーターの解釈はかなり簡単です:
(1) トレンドの変化
(2) トレンドの方向への後退 (3) トレンドの方向へのブレイクアウト 赤いダッシュ は下降トレンド中の修正です 青いダッシュ は上昇ト

The indicator is designed for pair trading with 2 highly correlated instruments.
Indicator charts can be displayed as lines or histograms. There is an MTF mode, the maximum and minimum deltas for the calculated number of bars are displayed with a check for a specified minimum value. It is possible to enable the calculation of trade operations with checking the current correlation coefficient for the minimum specified, the current delta in points or percent of the maximum (minimum) delta and
This is a simple utility which will put automatic Stop Loss and Take Profit on all your open trades based on ATR indicator values. Whenever you open a trade, it will put ATR times Stop Loss and Take Profit automatically. Stop loss and take profit are two important tools used by traders to manage risk and set profit targets in financial markets. The Average True Range (ATR) indicator can be a valuable tool in helping traders determine appropriate levels for these orders. Here's an explanation of

The market price usually falls between the borders of the channel .
If the price is out of range, it is a trading signal or trading opportunity.
Basically, Fit Channel can be used to help determine overbought and oversold conditions in the market. When the market price is close to the upper limit, the market is considered overbought (sell zone). Conversely, when the market price is close to the bottom range, the market is considered oversold (buy zone).
However, the research can be used

The Multitimeframe-Candles (MCandles) - Indicator for MT5 shows the contour of an higher, free selectable, timeframe as an overlay on the current timeframe. You can freely choose the timeframe, number of candles and color of the overlays. The indicator only calculates the current candle frequently, so it saves computing capacities. If you like the indicator, please left a comment.

A fully featured BB indicator You're no longer limited to the built in default of using BB off a SMA method, now you can choose from: SMA - SMMA - EMA - LWMA - ADAPTIVE - FRACTAL ADAPTIVE - DEMA - TEMA - VARIABLE INDEX DYNAMIC
You now also have up to 5 standard deviation levels, with price labels. Styling wise, there are color gradients provided for deviation filling, candles (bars too), deviation lines and texts.
Options: - MTF - 9 choices of MA to base the BB off
- 5 adjustable deviation

Easy BySell is a market indicator for opening and closing positions. It becomes easy to track market entries with the alerts.
It indicates the trend reversal points when a price reaches extreme values and the most favorable time to enter the market.
My other products with its advanced technology ( artificial neural networks ) : https://www.mql5.com/en/users/incepline/seller
The algorithm is based on ATR and Stochastic Oscillator indicators. You can modify these two parameters as you

LIVE SIGNAL Crazy Move is a trading algorithm whose basic principle of trading strategy is based on the axeom of overbought/oversold levels. Crazy Move opens a large number of orders, which maintains the necessary balance even when the price moves against the prediction of the trading algorithm. Crazy Move:
- a system of deposit acceleration, which can multiply it several times in a short period of time
- conservative trading option
- system of maintaining the balance of funds by hedging
- t
このスクリーナーを使用すると、選択した期間(時間枠)内に通常よりも買われ過ぎ(成長率)または売られ過ぎ(減少率)の資産を特定できます。 市場は法律によって支配されており、より安く購入し、より高価に販売しますが、自動スキャナーがないと、たとえば今週内に、通常よりも買われ過ぎまたは売られ過ぎの通貨/株を特定することは非常に困難です。現在の時間、または月。 数十または数百の機器が存在する可能性があり、すべてを手動で分析する時間がないことが物理的に可能な場合もあります。これらの問題は、Screenerを使用して簡単に解決できます。 スクリーナーができること スキャナーはどのTFでも使用できます スキャナーは、通貨、株式、暗号通貨、商品、インデックス、およびその他の機器で動作します 資産を特定するロジックは、市場の基本法則に基づいているため、普遍的です。 スクリーナーの助けを借りて、あなたはさまざまな戦略に従って作業することができます、最も一般的なものの1つはポンプとダンプです 各商品の平均値を明らかにする-SoftimoTradeScreenerは、選択したTFの資産の買われ過ぎと売られ過ぎ

An indicator based on candlestick patterns
To catch short-term and long-term trends
If it gives a signal in the direction of the trend, it is long term
And if it gives a signal in the opposite direction of the trend, it is short term
Too many signals
Can be used in all symbols
Can be used in all time frames
Attributes: Too many signals Can be used in all symbols Can be used in all time frames Simple settings Simple and fast usage With author lifetime support
Settings: Candle back: Th

This indicator accurately identifies and informs market reversals and continuation patterns by analyzing and signaling the Three White Soldiers / Three Black Crows pattern. It also offers a "real-time backtesting" panel in the indicator itself in a way that every change made on the indicator parameters will immediately show the user how many signals are occurred, how many take profits and stop losses were hit and, by having these informations, the Win Rate and the Profit Factor of the setup b

Need to open a pending order at news time, or need to open a pending/instant order at a specific time? CAP News Trading EA is the right tool for you. The News Trading EA opens pending orders at a specific time or specific date for you avoiding human errors and enhancing your trading activity. It is useful for news traders who open pending orders before the news come out. News trading is one of the most difficult disciplines – but it can also be one of the most profitable ones if you know

あなたは小さなstoplossを持つEAをしたいですか? あなたはちょうど市場に出ているEAをしたいですか?
このEAは、dax(ドイツ指数)、またはDow Jonesのブレイクアウトに作用しています。 それは、市場が開いたときにのみ購入し、10分以下のウィンドウで購入しています。
この戦略(はい、それがあります2で使用することができます異なる戦略3異なるチャート)タイトなストップロスと多くの場合、数秒以内に到達するtakeprofitを持
戦略はよく証明されています。 私は良い結果を得て何年も手動でそれらを使用してきました。 設定ファイルは、私が使用する設定のコメントセクションの下に見つけることができます(あなたが時間をかけてより良い何かを見つけた場合は、TP
このEAの特徴 それだけで一日と戦略ごとに一つの貿易を取ります(時には貿易なし) すべての取引でTPとSLを使用します(SLとTPがタイトであるため、EAに組み込まれています) 買いと売りの逆指値注文の使用の可能性 ノー-マーチンゲール ヘッジなし 裁定なし 複数の取引はありません
プロモーション価格:$

Market volume profile indicator. It works on almost all instruments - currency pairs, stocks, futures, on real volumes and on ticks. It can be set as automatic determination of the range of building a profile, for example, for a week or a month, etc. and set the range manually by moving the borders (two vertical lines red and blue). Shown as a bar graph. The width of the histogram at a given level means, conventionally, the number of trades made on it. With the "Mode level line color" para
MetaTraderマーケットは、開発者がトレーディングアプリを販売するシンプルで便利なサイトです。
プロダクトを投稿するのをお手伝いし、マーケットのためにプロダクト記載を準備する方法を説明します。マーケットのすべてのアプリは暗号化によって守られ、購入者のコンピュータでしか動作しません。違法なコピーは不可能です。
取引の機会を逃しています。
- 無料取引アプリ
- 8千を超えるシグナルをコピー
- 金融ニュースで金融マーケットを探索
新規登録
ログイン