YouTubeにあるマーケットチュートリアルビデオをご覧ください
ロボットや指標を購入する
仮想ホスティングで
EAを実行
EAを実行
ロボットや指標を購入前にテストする
マーケットで収入を得る
販売のためにプロダクトをプレゼンテーションする方法
MetaTrader 5のための有料のエキスパートアドバイザーとインディケータ - 113

The implementation of the Trend Self trend indicator is simple - in the form of two-color lines. The indicator will help users determine the direction of the trend. It will also become an indispensable adviser for entering the market or for closing a position. The indicator algorithm is based on standard indicators as well as their own mathematical calculations.
How to read information from the indicator. We buy when the color of the indicator line changes from pink to green. Hold a long

The Trend Rendezvous indicator searches for and displays pivot points on the price chart. The goal, which was pursued during its creation, is to obtain signals that will produce less noise and respond more quickly to price changes. The Trend Rendezvous indicator is a trend indicator that is used to search for reversals in the breakdown of its borders. The indicator is its signal and has one interesting property. It is necessary to take into account that this indicator reflects extrema and shoul
Injikētā wa, kaku chāto jikan no muttsu no shingō nimotozuite, onaji shisan no itsutsu no kotonaru chāto jikan no torendo o tsuiseki shimasu. Shihyō no omona mokuteki wa, sore ga oka reta kin'yū shisan no dai tasū no keikō o shimesu kotodesu. Shisutemu wa sū-kai no gurafikku jikan de keikō no jōhō o sōshin shimasu. Kore ni yori, yūzā wa shisan no ugoki no hiroi shiya o motsu koto ga dekimasu. Kono taipu no tsūru wa, operētā ga chūmon o jikkō suru no o shien suru koto de, yūzā no hitto-ritsu o ta

ichimoku indicator with alert; audible alert, email alert, push alert you can enable or disable the settings as you wish When there is a crossing of tenkansen and kijun you will get an alert When there is a cross between Senkouspan A and Senkouspan B you will get an alert Affordable sound settings possibility to modify the parameters of the ichimoku indicator

SYSTEM INTRODUCTION: The Binary Options Conqueror System Is Specifically Designed For Binary Options Trading. Unlike Other Systems And Indicators That Were Adopted From Other Trading Environments For Binary Options. Little Wonder Why Many Of Such Systems Fail To Make Money . Many End Up Loosing Money For Their Users. Forward Testing Of The System Has Shown Remarkable Results . The Results Of Forward Testing On Live Trading Account Is Consistent With The Results Obtained By Back Testing .

The Tik Tok indicator was created on the basis of the original extreme search indicators, the indicator is well suited for determining a reversal or a big sharp jerk in one direction, thanks to it you will know when this happens it will notify you when a blue dot for buying red for sale appears.
It basically uses the process of detecting the rate of change in price growth and allows you to find entry and exit points from the market. fundamental technical indicator that allows you to assess th

The Trend Mix indicator reliably monitors the market trend, ignoring sharp market fluctuations and noise around the average price. This is a promising arrow indicator. He catches the trend and shows favorable moments of entering the market with arrows. The indicator can be used both for pipsing on small periods, and for long-term trading. The indicator implements a kind of technical analysis based on the idea that the market is cyclical in nature.
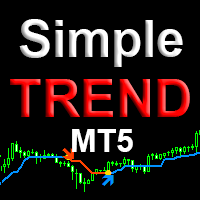
Simple trend mt5 is a professional version of the trend indicator and entry points. It uses Price action and a unique filtering algorithm to determine the trend. Shows the change in the direction of price movement on any currency pairs, without redrawing the result. Suitable for determining entry points for scalping and swing, as well as for intraday, medium-term trading. Features Marks trend reversal locations and directions. Suitable for all types of trading, in any markets. Allows you to en

the indicator will show signal arrows on the graph at the crossing of a given level it has push and audible alerts. By crossing from low to high level 0.3, a blue arrow will come out for the purchase, at the same time an audible signal will sound. By crossing from low to high level 0.7, a red arrow will come out for the sale, at the same time an audible signal will sound. Possibility to deactivate push and audible alerts. MT4 version of this product here

Great dashboard for market analytics. The panel helps analyze the values of the Bollinger Bands indicator and prices.
Using this panel you can: watch the current signal from the Bollinger Bands for all time frames; watch the current signal with the Bollinger Bands for different characters; look at how far the Bollinger Bands is from the price; look at how much the Bollinger Bands value has changed; several types of signals for analytics. Value of cell: Bollinger Bands main line; Bollinger
FiboPlusWave Series products Ready-made trading system based on Elliott waves and Fibonacci retracement levels . It is simple and affordable. Display of the marking of Elliott waves (main or alternative option) on the chart. Construction of horizontal levels, support and resistance lines, a channel. Superposition of Fibonacci levels on waves 1, 3, 5, A Alert system (on-screen, E-Mail, Push notifications). Features: without delving into the Elliott wave theory, you can immediately open one of

I recommend you to read the product's blog (manual) from start to end so that it is clear from the beginning what the indicator offers. This multi time frame and multi symbol indicator scans for engulfing and tweezer formations. The indicator can also be used in single chart mode. Combined with your own rules and techniques, this indicator will allow you to create (or enhance) your own powerful system. Features Can monitor all symbols visible in your Market Watch window at the same time. A

By launching the Trend Info indicator, the user will see two lines and bars of different colors, which can change color to green during an uptrend, to red during a downtrend or to be yellow during an uncertainty. The indicator is based on the calculation of price values, in order to answer questions about what direction the trend is acting on the market at the moment and when this trend will end.
The trader uses the Trend Info indicator to determine the market situation. This is a trending al

这是一款使用 ichimoku kinko hyo 指标开发的 EA 程序
本程序的MT4版本 适合的商品:EURUSD, GBPUSD, XAUUSD
运行的周期:H1 参数用法介绍: auto_volume : 自动手数 volume_fixed:设置固定手数 volume_init:自动初始手数 auto_indic_param: 自动设置指标参数 后面是指标参数,共使用4个指标,为版权及商业秘密考虑,具体细节已隐藏。但仍开放5种参数位置,供交易者自行优化运算。
本人以混沌理论为主要研究方向,研究中发现 指标 ichimoku kinko hyo 对我们的交易思想贴合的非常好。 ichimoku kinko hyo 是一款综合能力很强的指标,依靠它的能力,再加上几款简单的辅助指标过滤,即最终完成这款趋势型EA程序。
EA具有时效性,任何程序都不能保证完全适应未来的行情,不过本程序会经常更新,以使之适应最新的市场特征。

Voyager it is a Secure Automated Software for trade Forex market and indices.
The architecture is a Fully Automatic Autonomous Robot Expert capable of
Independently analyzing the market and making trading decisions
Voyager have 10 neural net working in parallel. Voyager It is an advanced trading system. This is a fully automatic Expert Advisor. Voyager . It is a 100% automatic system, The system is self-sufficient, performing all the work. Is a revolution in the

参考混沌理论的思想而开发的一款 EA 程序 本程序的MT4版本 适合的商品:EURUSD EURJPY 运行的周期:H1 参数用法介绍: auto_volume : 自动手数 volume_fixed:设置固定手数 volume_init:自动初始手数 auto_indic_param: 自动设置指标参数 signal_D1_period:D1图表的指标信号计算周期 signal_D1_value:D1图表的指标信号参数值 signal_H1_period:H1图表的指标信号计算周期 signal_H1_value:H1图表的指标信号参数值
混沌理论具有三原则: 1、动能永远会遵循阻力最小的方向行进 2、始终存在这通常不可见的根本结构,这个结构决定阻力最小的方向。 3、这种根本结构可以被人发现,并加以利用
本程序以混沌理论为主导思想,结合几个合适的指标,对看似无规律的市场价格行为能够进行相对准确的分析,从而抓住转瞬即逝的短暂信号进行剥头皮型的交易。 EA具有时效性,任何程序都不能保证完全适应未来的行情,不过本程序会经常更新,以使之适应最新的市场特征。

The Recorder indicator, in addition to the trend direction, shows a change in the angle of inclination, the analysis of which allows you to filter signals using angle filters, this can be used to build a bot with this signal indicator based on it. This indicator is very sensitive to current price activity and displays signals rather well.
The color version of the indicator signals a trend change. The indicator allows you to see a rising or falling trend. Quickly responds to a trend change, cl

The OCTO Indicator is a new and easy to use zero-crossing trend/trend reversal indicator that provides entry signals for both long and short positions. It is based on High/Low divergence and correlation of the values over time.
Reliability of the indicator has been backtested with an example trading robot.
How to use The OCTO indicator is added in a separate window, showing a red and a green indicator line, as well as the zero line for crossing. You can see an example of the standard look a
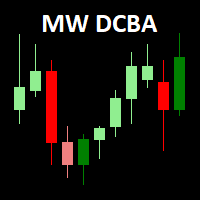
The Martinware Direction by Candle Body Analysis indicator is a direction indicator that shows the current asset direction, up or down, by checking if previous candle bodies' bases were respected or broken. It works similarly to a moving average, but it's more objective due to its lesser amount of configuration parameters.
The algorithm assumes the theory that although the highs and lows of candles have their value, it is the body that shows the conclusive market sentiment over that asset in

Fully automatic multicurrency expert advisor working on any type of accounts and with any type of spreads. The timeframe on the chart does not matter, you can set any. Directly working timeframe is set in the settings. The EA always sets TakeProfit and is thus less sensitive to the speed of the broker. The "deposit protection" function allows the EA to set StopLoss after the last order and thereby limit possible losses. The additional " Magnetic TP " function search the levels near the TakeProfi

Main: Not martingale, not a grid; Working on all symbols; Use on EURUSD; Use on M5.
Signals: There is a good rational algorithm. Work of two indicators: Ichimoku and Alligator (you can set a separate Timeframe for each indicator)
Stop Loss/Take Profit: There is a good money management system (there are several type for trailing stop loss); There is virtual levels of Stop Loss / Take Profit; There is smart lot (percent by risk) or fix lot
Important: EA can work on closed candles, and on c
This OCO Closer is one of the most useful things in my toolbox. You can place as many pending orders as you want on your chart, then after adding this to the chart it will delete them all once a Buy or Sell Position Opens. This is great for those times when you think the price might reverse trend, or if you simply want to hedge your bets both ways. Bear in mind that this will only delete the pending orders on the current currency pair, so you can set Buy and Sell pending orders on as many pairs
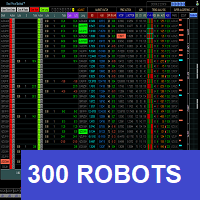
Product Manual : drive.google.com/file/d/1eAPn7HKd6pNple9sJPGBVxnXZbOUjZgP/view?usp=share_link This Dashboard is also an Expert Advisor with manual and automatic order submission. Don't be little, study, analyze, adapt this method to your own style, understand, feel the market before you take any decision. Here, in many times, do nothing, it is also a strategy. Beyond the semi-automatic and automatic mode of operation, we will see almost 300 robots which road the market 24h a day tirelessl

ArcTrader is designed to trade any markets (Stocks, Forex, Commodities, Futures, Cryptos). The strategies are developed based on various Price Actions that will be observed on different Fibonacci Arc Levels. Product Home Page: https://www.mql5.com/en/market/product/51336
ADVANTAGES:
Works on any market and time frames Multiple Strategies in 4 categories: Retracement, Breakout, Trend Follow, Reversal Trades simultaneously on any number of markets under the same account Display Fibonacci Ar

Эта панель предназначена для быстрого визуального поиска паттернов "price action" по нескольким торговым инструментам одновременно. Есть возможность добавлять и удалять торговые инструменты. По клику на сигнальную кнопку осуществляется быстрый переход на график с данным паттерном и таймфреймом. Панель ищет 8 свечных паттернов: PIN-BAR, EXTERNAL BAR, INSIDE BAR, DOJI, LEVEL, HIGH/LOW OF N BAR, FAKEY, ONE-WAY N BAR. Отключение любого из паттернов осуществляется кликом по его заголовку. Также имеет
Description
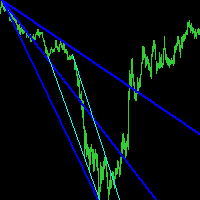
Reverse Rayer Pro is an indicator that draws rays on inclined trend levels.
Recommendations
You can use this indicator to determine the trend and, accordingly, to determine the direction of opening a position or closing an opposite position.
Parameters
===== _INDICATOR_SETTINGS_ ===== - indicator settings Maximum History Bars - maximum number of history bars for calculating the indicator. Average True Range Period - ATR indicator period (used to calculate the differenc

Description
Reverse Rayer is an indicator that draws rays on inclined trend levels.
Recommendations
You can use this indicator to determine the trend and, accordingly, to determine the direction of opening a position or closing an opposite position.
Parameters
===== _INDICATOR_SETTINGS_ ===== - indicator settings Maximum History Bars - maximum number of history bars for calculating the indicator. Average True Range Period - ATR indicator period (used to calculate the difference be

FanTrader is designed to trade any markets (Stocks, Forex, Commodities, Futures, Cryptos). The strategies are developed based on various Price Actions that will be observed on different Fibonacci Fan Levels. Product Home Page: https://www.mql5.com/en/market/product/51333
ADVANTAGES:
Works on any market and time frames Multiple Strategies in 4 categories: Retracement, Breakout, Trend Follow, Reversal Trades simultaneously on any number of markets under the same account Display Fibonacci Fa

Extensiver is designed to trade any markets (Stocks, Forex, Commodities, Futures, Cryptos). The strategies are developed based on various Price Actions that will be observed on different Fibonacci Extension Levels. Product Home Page: https://www.mql5.com/en/market/product/51242
ADVANTAGES:
Works on any market and time frames Multiple Strategies in 4 categories: Extension, Breakout, Trend Follow, Reversal Trades simultaneously on any number of markets under the same account Display Fibonac
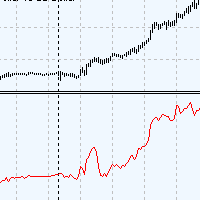
Ara volatility - это индикатор волатильности, показывает силу трендового движения. Удобен в использовании. Не перерисовывается. Для расчёта индикатора была применена авторская разработка. Индикатор будет вам очень полезен как самостоятельный инструмент показывающий периоды тренда или затишья. Также индикатор может служить как дополнительный фильтр к вашей торговой системе. Ara volatility очень прост в настройках, всего один параметр Period Volatility . Рекомендуемые значения от 24 до 1000.
Our Moving Average Crossover EA offers a unique and complete 100% automated trading solution with over 34 different types of Moving Average calculations to choose from! Yes, that right 34! See the list at the bottom of the description! So many great features! Position Sizing & Money Management - Position sizes are either fixed or calculated dynamically based on percentage of Capital available divided by pip count or ATR multiplier. Stop Loss, Target Profit, Trailing Stop & Partial Position Closi
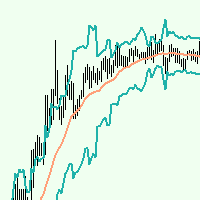
Ara Channel это канальный индикатор призван помогать определять вероятные точки разворота цены. Будет полезен трейдерам торгующим как в тренд так и в контртренд. Сигналы индикатора могут служить как полностью самостоятельными для торговли , так и как дополнительными , подтверждающими. Индикатор имеет всего две настройки: Period_MA это обычная скользящая средняя рекомендуемые значения от 8 до 480, Period_Channel это период для расчёта границ динамического канала. Преимущества : не перерисовывает
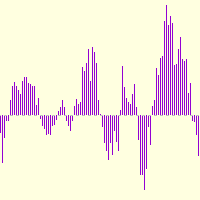
Ara metod , индикатор-осцилятор. Создан для отображения вероятных экстремумов. Представляет из себя гистограмму отображающую вероятные изменения цены. Преимущества , не перерисовывается, прост в настройках. Будет полезен как основной инструмент для поиска сигналов для входа, так и как дополнительный инструмент подтверждения точек входа. Из настроек только один параметр Reg_Period , допустимые значения от 10 до 1000, рекомендованные 120-480 .

EQUITY PROTECTION EA -MT5- 大きな損失を避け、アカウントを保護します
一般的な機能: 取引セッションの結果を完全に制御。 すべての外国為替記号、指数、金属、株式などの全体的な結果を制御します。制御はグローバル株式に対して行われます。 利益率または損失率に達したときに、すべてのシンボルのすべての取引を閉じます。 量とパーセンテージの両方で変更可能な構成。 トレーリングストップグローバルによる結果の保護。 セッションで達成された結果の記録(より高い資本とより低い資本)。 すべての計算はログイン時に常に貸借対照表で実行されるため、取引のクローズまたはオープンには影響しません。 新機能! テイクプロフィットまたはストップロスがトリガーされたときにプラットフォームを自動的に閉じるオプション- 通知機能:TP / SLレベルがトリガーされたときにレポートを電話に送信するオプション(プッシュ通知)または電子メール。 TP / SLがトリガーされたときに保留中の注文を削除するオプション。 TP / SLがトリガーされたときにスクリーンショットを撮ってファイルに保存するオ

Delta Single Volume is a very powerful indicator that reads the supply on the Market.
It calculates the Delta from movement of the price and the difference of BUY and SELL volumes. Its special structure allows you to get all timeframe values available on the MT5 platform. It works on Tick Volumes and Real Volumes (if avalaibles on your Broker). A good observation of this instrument can suggest great entry points and possible reversal. We are confident that this tool will help you to improve yo

The EA uses a trending strategy based on numerous technical indicators "Moving Average" on the timeframe: M4, M5, M6, M10, M12, M15, M20, M30, H1. The Expert Advisor uses elements from strategies such as Martingale, Grid and Averaging. In trading, up to 3 orders can be opened simultaneously on each of the currency pairs. The EA uses a partial order closing algorithm and hidden Stop Loss, Take Profit, Break Even and Trailing Stop. A multi-currency adviser trades in 17 currency pairs. EA uses time

This Indicator draws Fibonacci Arc levels in two different ways. You can select whether to draw Fibonacci Arc levels based on your favourite ZigZag settings or you can let the indicator to draw Arc levels based on given number of bars or candles. You can also set Mobile and Email notification for your favourite Arc levels individually. With this indicator you will not have to feel lonely as the it can generate Voice alerts, which will keep you focused on your trading and remove boredom. Produc

This Indicator draws Fibonacci Fan levels in two different ways. You can select whether to draw Fibonacci Fan levels based on your favourite ZigZag settings or you can let the indicator to draw Fan levels based on given number of bars or candles. You can also set Mobile and Email notification for your favourite Fan levels individually. With this indicator you will not have to feel lonely as the it can generate Voice alerts, which will keep you focused on your trading and remove boredom. Prod

Tortoise Scalper is an Expert Advisor for trading on Forex markets using MT 5 platform. This scalper is useful for day traders. This is slow and steady strategy, which helps you to win the race like tortoise .... regular small profits with calculated draw downs … It will keep you always on the winning side at the end of the race, just like tortoise… We made this scalper with the belief that, for day trading most recent data should be used for analysis and to create a trading system. So, we made

Want to make the graph cleaner?
Don't you use the opening price in your analysis?
Want to use a chart model that was used by Richard Wyckoff?
Then you need to know the Color HLC Candles and Bars indicator. In the same indicator you can switch to the display of candles or bars.
Take a look at the other volume indicators to complement your operating. And don't forget to look at the best Vwap Custom (Midas)!
Leave your comment!
Success and good trades!

The Glider indicator gives accurate and timely signals to enter and exit the transaction that appear on the current candle. Using the indicator is very simple. When a dot and a blue line appear, open a buy deal. When a dot and a red line appear, open a sell deal.
The main purpose of this indicator is to determine the moments of entry and exit from transactions, therefore the Glider indicator will display only the trend line and entry points, i.e. displays displays the entry points to the mark

GALAXY it is a Secure Automated Software for trade Forex market and indices. Architecture is a Fully Automatic Autonomous Robot Expert capable
Independently analyzing the market and making trading decisions
GALAXY It is an advanced trading system. This is a fully automatic Expert Advisor.
NO INPUT TO SELECT FOR THE TRADER ALL AUTO MATED
THIS SYSTEM IS ALWAIS IN THE MARKET IN THE TWO DIRECCTION MAKE WINING CYCLES
GALAXY . It is a 100% automatic system, the s

The principle of this indicator is very simple: detecting the trend with Moving Average, then monitoring the return point of graph by using the crossing of Stochastic Oscillator and finally predicting BUY and SELL signal with arrows, alerts and notifications. The parameters are fixed and automatically calculated on each time frame. Example: If you install indicator on EURUSD, timeframe M5: the indicator will detect the main trend with the Moving Average on this timeframe (for example the Moving

私に書いてください、そして私はあなたに暗号、株式USA、株価指数、金のためのスーパーボット戦略を送ります。購入前にテストできます。 497ドルで生涯ライセンスを購入した後、私にプライベートメッセージを送ってください。オンラインコースにアクセスできます:「スーパーボット:Metatrader 5内でアルゴリズム取引戦略を高速かつコード行なしで作成する方法」(すべてのコース情報は英語で表示されます)。 スーパーボットを使用した信号のカップル: https://www.mql5.com/en/signals/1414140 https://www.mql5.com/en/signals/1529750
Superbotを使用すると、Metatrader5をソフトウェアパッケージに変換して、モスクワ証券取引所とシカゴ証券取引所のデリバティブおよび株式市場でトレンドおよびリバーストレーディングシステムを作成およびテストできます。 5つのモードがあります。 コンストラクター:使用可能なブロックから戦略を手動でアセンブルします。 ジェネレーター:遺伝的最適化を使用して、取引システムを自動的に生成

Display the date, time and price according to the movement of the mouse cursor on the chart This is useful for discretionary trading.
It is an indispensable tool for verifying and studying past market prices and trades. Large and easy-to-read characters It is easy to see even if your eyesight is weak.
Also, you can tell the date and price to YouTube and webinar viewers in an easy-to-understand manner. Characteristic Date,Time and Price are displayed. The value follows the movement of the mous

The indicator shows buy and sell signals. The " CounterTrend 5 " is designed to recognize profitable counter trend patterns from your chart. Features: The CounterTrend 5 is a Counter-Trend Trading with Simple Range Exhaustion System. Signals based on the daily trading range. The indicator calculates the trading range for the last few days and compare the price movements on short time intervals and generating short term reversal points. This is a leading indicator. It works on any instruments.

This EA includes 11 SmartForexExpert EAs. These EAs belong to 3 different area types, momentum, reversal, trend. Using all EAs we can diversify risk and trade better and take advantage of different market behaviors where specific type of EA works better than others. Version 3.0 on MT5 include SFE Crypto Master!
A big effort has made to include the different EAs in 1 mt5 file, and keeping the low demand of the computer resources. The EA runs very smoothly and only take care of his own trades,

Buy and sell signals based on Larry Williams's exponential moving average strategy 9.1 for trend reversals.
How does it work? The indicator activates the buy and sell signal when a candle closes turning the 9 period EMA.
How to use it? One way of using it, proposed by Larry Williams, is to enter a trade with a buy stop order one tick above the high of the candle with the buy signal, placing the stop loss order one tick below the candle's low. When there's a sell signal instead, place a sell

Relative Strength Ratio (RSR)
The Relative Strength Ratio (RSR) indicator compares the performance of one security against another, dividing the base security by the comparative security, and showing the ratio of this division in a line c hart. This indicator is also known as the Relative Strength indicator, Price Relative , or Relative Strength Comparative .
It is one of the main tools for Intermarket Analysis professionals, to help them identify Sector Rotations and other global relations

Multicurrency and multitimeframe modification of the indicator Bollinger Bands. On the dashboard you can see breakouts and touches of the Bollinger Bands. In the parameters you can specify any desired currencies and timeframes. The indicator can also send notifications when the price touches the Bollinger Bands, when the current volatility changes (expands or falls), and when the price touches all the bands. By clicking on a cell with a period, this symbol and period will be opened. This is MTF

このエキスパートアドバイザーは、長年の開発の結果です。私は主にグリッドとヘッジ戦略を専門としており、このエキスパートアドバイザーですべての経験と知識を移転しました。その結果、高度にカスタマイズ可能なExpert Advisorテンプレートと、トレーダーが選択できるいくつかの優れた戦略があります。取引戦略は常に追加され、Expert Advisorは関連性を維持し、10年後もトップになります。つまり、この製品を購入することで、継続的なサポートと最新の更新を備えた、柔軟にカスタマイズ可能なExpertAdvisorを入手できます。あなたの戦略と願いは改訂で使用することができます。
EAは市場と保留中の注文を取引します。ストップロス、テイクプロフィット、トレーリングストップは取引を成立させるために使用されます。これらは、単方向または双方向の注文のバスケットに対して、注文ごとに個別に使用できます。注文のグリッドは、固定または拡大するステップとポジションのボリュームのいずれかを使用できます。貿易統計がチャートに表示されます。
ストップロス、テイクプロフィット、トレーリングストップはリア

En base a cálculos matemáticos de determino una linea Horizontal que cruza a todas las señales de trading, mostrando los máximos y mínimos. La linea horizontal parte en dos las subidas y bajadas de las señales de trading, de tan manera que es fácil identificar los máximos y mínimos, y es inteligente por que es sensible a las subidas y bajadas, afín de no quedarse en un solo lado por siempre, trabaja excelentemente con otros indicadores suavizadores ya que les garantiza que en un intervalo de tie
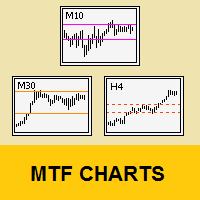
Tool that allows viewing more than one timetime in the same window (up to 3 timeframes). Then, the tool helps the analysis in multiple timesframes.
This is another product developed by Renato Fiche Junior and available to all MetaTrader 5 users!
Input Parameters
- Timeframes 1, 2 and 3: Timeframes of sub-charts
- Show Dates: Shows the dates on the sub-charts on the X-axis (Yes / No)
- Show Prices: Shows on the Y-axis the prices in the sub-charts (Yes / No)
- Show Subwindow: Sh

The Decision indicator determines the long-term and short-term trend. The indicator allows you to examine in more detail the real and historical market trends! Shows the opening points of transactions for sale or purchase, and also indicates the direction of the trend for: short-term and long-term periods. The analysis is based on the selected timeframe.
The indicator not only signals an immediate purchase or sale. It indicates a short-term and long-term trend. operations. The easiest way to

ONLY 10 COPIES AT $199! After that, the price will return to $499 How to run backtest: https://www.youtube.com/watch?v=D8NGbHGp1-k I recommend SETUP 1 to anyone starting out. To run the backtest correctly, download the set's on our drive: https://drive.google.com/drive/folders/1yFz4tJbJwl71_T3YU7f8fqHBoq0aYMsi?usp=sharing The expert DSC PRICE ACTION EURUSD was created for the EURUSD asset in the M5 time under Hedge account. It´s a Expert to leverage the account quickly. It is a high hit rate an
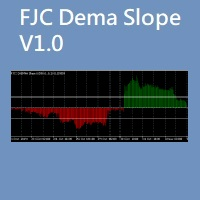
FJC Dema Slope indicator helps finding and meassuring trend force better than Ema or Dema Alone. You can set levels for filtering low force trends and for detecting exit trade point when the trend force is reducing. Bullish trend shows in green color and Bearish trend in red. It can be use for manual trading but you can also use it when programming EAs, this is an example of use: demaSlopeHandle[i]=iCustom(NULL,PERIOD_CURRENT,"::Indicators\\FJC_DEMA_SLOPE.ex5", 500, PRICE_CLOSE, 0.0,1);

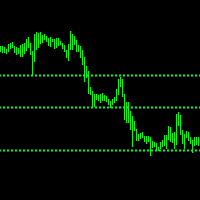
Description
ABC Trend Levels Pro is an indicator that identifies market trends and important trend support and resistance levels.
Recommendations
You can use this indicator to determine the trend and, accordingly, to determine the direction of opening a position or closing an opposite position.
Parameters
===== _INDICATOR_SETTINGS_ ===== - indicator settings Maximum History Bars - maximum number of history bars for calculating the indicator. Average True Range Period - ATR indicat

Description
ABC Trend Levels is an indicator that identifies market trends and important trend support and resistance levels.
Recommendations
You can use this indicator to determine the trend and, accordingly, to determine the direction of opening a position or closing an opposite position.
Parameters
===== _INDICATOR_SETTINGS_ ===== - indicator settings Maximum History Bars - maximum number of history bars for calculating the indicator. Average True Range Period - ATR indicator p

The principle of this indicator is very simple: detecting the trend with Moving Average, then monitoring the return point of graph by using the crossing of Stochastic Oscillator and finally predicting BUY and SELL signal with arrows, alerts and notifications. The parameters are fixed and automatically calculated on each time frame. Example: If you install indicator on EURUSD, timeframe M5: the indicator will detect the main trend with the Moving Average on this timeframe (for example the Moving

粗化されたフラクタルに基づく回帰チャネル。
パラメータ:
期間の再計算-インジケータ計算期間
スイッチゼロ(最後の)バー-最後に開いているバーを数えますか?
チャネルに対する丸め価格の位置を変更するときにプッシュ通知を切り替えます
ラインリスク-リスクラインの表示
Coeff Risk,%-トランザクションの最大割合をパーセンテージとして表します
このチャネルでは、市場における傾向とその強さを評価し、必要なリスクを伴う取引の要求を正しく行うことができます。
基本的な分析を考慮して、より高い時間枠のチャートで取引することをお勧めします。
取引のための可能な信号:1. チャンネル境界吹き出物
2. チャネル境界からのリバウンド
3. チャネルトレンド別

The principle of this indicator is very simple: detecting the trend with Moving Average, then monitoring the return point of graph by using the crossing of Stochastic Oscillator and finally predicting BUY and SELL signal with arrows, alerts and notifications. The parameters are fixed and automatically calculated on each time frame. Example: If you install indicator on EURUSD, timeframe M5: the indicator will detect the main trend with the Moving Average on this timeframe (for example the Moving

Halley´s comet it is a Secure Automated Software for trade Forex market and indices.
The architecture is a Fully Automatic Autonomous Robot Expert capable of
Independently analyzing the market and making trading decisions
Halley´s comet It is an advanced trading system. This is a fully automatic Expert Advisor.
Halley´s comet . It is a 100% automatic system, The system is self-sufficient, performing all the work. Is a revolution in the customization of the tra

AnaliTIck is a financial instrument analysis and testing program based on the Metatrader5 platform. The object of analysis is the sequence of changes in the prices of Bid and Ask - ticks. The program may be useful to developers of scalping advisers and strategies, those who work on the news. When the program is loaded, an array of ticks for the financial instrument, on the chart of which the program is installed, is filled for the current period. The analyzed period is 4 trading days. On this pe

The result as the name explain, displays the result of a swing. Sometimes weis waves show a big effort, but a little result... The weis waves result is a better revelation about the volume, if united with weis waves. it is a volume indicator, but it is different from a conventional volume indicator, this indicator came from the wyckoff method, if you use the result you will have a different view of the market, regardless of which asset is operating.

The indicator predict the future candles direction, by scanning past candle movement. Based on the principal: “ The history repeat itself”. Programmed according to Kendall Correlation. In the settings menu, different scanning options are available. When the indicator find a match, start painting future candles from the current candle to the right, also from the current candle to the left as well, showing you the candle pattern what the actual signal is based on. The left side candle are option

The strategy which is applied in finance market all around the world is known as CTA strategy. A successful CTA always includes multi-strategies, multi-instruments and multi-timeframe. The series of Multi Instruments TrendSystem (MITS) provide a profitable strategy which can be used in different instruments with different timeframe. Multi Instruments TrendSystem 7 LB (Level Break) MT5 is a fully automated multi-instrument Expert Advisor. This EA works well in BTCUSD. This EA is one of our trend

Indicador Para Opções Binarias. Indicator for Binary Options Usa dois gales. Instalar em mt5 Esse indicador é para ser usado no tempo de vela de 5 minutos e em M5. Este também funciona em M1, porém é mais eficiente em M5. Só descompactar e copiar os arquivos na pasta de dados do seu MT5. Arquivos indicator na pasta MQL5 - Indicator. Baixe também a Media Movel totalmente gratis:
https://www.mql5.com/pt/market/product/50400
Esse Indicador é para a próxima vela. Apareceu a seta, só aguardar a pr
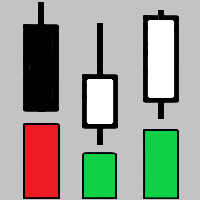
The indicator shows key volumes confirmed by the price movement.
The indicator allows you to analyze volumes in the direction, frequency of occurrence, and their value.
There are 2 modes of operation: taking into account the trend and not taking into account the trend (if the parameter Period_Trend = 0, then the trend is not taken into account; if the parameter Period_Trend is greater than zero, then the trend is taken into account in volumes).
The indicator does not redraw .
Settings Histo
MT4 Version Available Here: https://www.mql5.com/en/market/product/48040
Telegram Channel & Group : https://t.me/bluedigitsfx
V.I.P Group Access: Send Payment Proof to our Inbox
Recommended Broker: https://eb4.app/BDFXOsprey
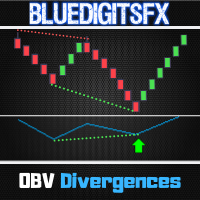
* Non-Repainting Indicator To Trade Divergences for any Newbie or Expert Trader ! BlueDigitsFx's OBV Divergence draws divergence lines on the chart and on the On Balance Volume (OBV) Indicator. Performs Amazingly at significant price areas such as support
MetaTraderマーケットは自動売買ロボットとテクニカル指標を販売するための最もいい場所です。
魅力的なデザインと説明を備えたMetaTraderプラットフォーム用アプリを開発するだけでいいのです。マーケットでプロダクトをパブリッシュして何百万ものMetaTraderユーザーに提供する方法をご覧ください。
取引の機会を逃しています。
- 無料取引アプリ
- 8千を超えるシグナルをコピー
- 金融ニュースで金融マーケットを探索
新規登録
ログイン