 MetaTrader 5
 エキスパート
 インディケータ
 ライブラリ
ライブラリ
 ユーティリティ
 ウィジェット
 ルール
ルール
YouTubeにあるマーケットチュートリアルビデオをご覧ください
ロボットや指標を購入する
仮想ホスティングで
EAを実行
EAを実行
ロボットや指標を購入前にテストする
マーケットで収入を得る
販売のためにプロダクトをプレゼンテーションする方法
MetaTrader 5のためのエキスパートアドバイザーとインディケータ - 493
 自動売買ロボットとインジケータを使用して、外国為替取引の収益性を高めます。 自動売買ロボットを使用すると、取引の開始と終了を自動化でき、インジケータは市場の行動をより正確に予測するのに役立ちます。
このページには、MetaTrader5アプリケーションのカタログが掲載されています。
自動売買ロボットとインジケータを使用して、外国為替取引の収益性を高めます。 自動売買ロボットを使用すると、取引の開始と終了を自動化でき、インジケータは市場の行動をより正確に予測するのに役立ちます。
このページには、MetaTrader5アプリケーションのカタログが掲載されています。 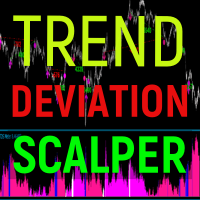
Trend deviation scalper - is the manual system to scalp choppy market places. Indicator defines bull/bear trend and it's force. Inside exact trend system also defines "weak" places, when trend is ready to reverse. So as a rule, system plots a sell arrow when bull trend becomes weak and possibly reverses to bear trend. For buy arrow is opposite : arrow is plotted on bear weak trend. Such arrangement allows you to get a favorable price and stand up market noise. Loss arrows are closing by common p

Top indicator for MT5 providing accurate signals to enter Trades.
This Indicator will provide pretty accurate trading signals and tell you when it's best to open a trade by giving alerts to buy or sell. Mainly was created to target Volatility Index on Deriv broker however, the Spot Detector Arrow Indicator can be applied to any financial assets(Forex, Crypto, Indices, Volatilities) on MT5 Brokers.
HOW TO BUY Wait for signal Alert to Buy will be sent to your MT5 Terminal Blue arrow facing

ヒートマップ - 通貨相対強度マトリックス Heat Map FXは、FX市場の主要8通貨(EUR、USD、AUD、GBP、NZD、CAD、CHF、JPY)の強弱をリアルタイムでスキャンするために設計された、直感的で強力なインジケーターです。チャートに統合されたダイナミックなヒートマップにより、すべての通貨ペアの騰落率を監視し、通貨ごとの平均強度を算出することで、強度の乖離による最適な取引機会を即座に特定することができます。
設定パラメータガイド update seconds: インジケーターがテーブルの数値を更新する頻度(秒単位)。 variation of the last hours: 価格の騰落率を計算するために使用される過去の時間数。 Symbol Prefix: 口座で必要な場合にブローカーが要求するシンボル名のプレフィックス(例: 「demo.」)。 Symbol Suffix: ブローカーによって適用されるシンボル名のサフィックス(例: 「.ecn」または「m」)。 positive variation color: 騰落率がプラスの通貨ペアの強調色。 negati

В основу алгоритма этого трендового индикатора положен анализ веера сигнальных линий универсального мувинга I . Алгоритм вычисления сигнальных линий выглядит следующим образом. В качестве исходных данных имеем входные параметры индикатора: StartLength - минимальное стартовое значение первой сигнальной линии; Step - шаг изменения периода; StepsTotal - количество изменений периода. Любое значение периода из множества сигнальных линий вычисляется по формуле арифметической прогрессии: SignalPeriod(

Wink IND is an indicator that tell you: -when MACD is saying buy or sell -when RSI is saying buy or sell -work on multi timeframes MT4 Version
by Wink IND: you don't need to have Knowledge about MACD or RSI don't need to check and compare MACD and RSI respectly don't need to check all of timeframes and compare the resaults don't lose time, save more time for your decisions in trading
Wink IND: multi timeframe indicator multi currency indicator show the positions by graphic shapes, arrows and

Индикатор iVeles_Perfect_Oscilator является опережающим и одним из самых лучших осциляторов на сегодняшний день, использует специализированный расчет текущих цен графика. Очень качественно и своевременно показывает смену направления, очень точный подход к уровням перекупленности и перепроданности, что позволяет своевременно принять решение по сделке. Работает качественно на любом ТФ и с любым инструментом. Параметры: Period - период расчетов Average - усреднение МА Method - применяемый мето

В основу алгоритма этого осциллятора положен анализ веера сигнальных линий технического индикатора RSI . Алгоритм вычисления сигнальных линий выглядит следующим образом. В качестве исходных данных имеем входные параметры индикатора: StartLength - минимальное стартовое значение первой сигнальной линии; Step - шаг изменения периода; StepsTotal - количество изменений периода. Любое значение периода из множества сигнальных линий вычисляется по формуле арифметической прогрессии: SignalPeriod(Number)

FX STEWARDS Trading Signals Alert - Financials v5.00 (Heritage Edition) (Fundamental + Technical Edition) Built for precision. Powered by data. Driven by market context. FX STEWARDS Trading Signals Alert - Financials layers a live fundamental bias engine, a graduated news-event filter, and a full weekend trading gate on top of everything in the core Technical Edition — the same 73-feature neural network, 30+ pattern candlestick engine, institutional-style probability model, and auto-timefr

Close All and Change Take Profit and Stop Loss All Orders. Main Features
Ability to Close All Orders the Symbol you put this EA. Ability to Change Take Profit to All Order. Ability to Change Stop Loss to All Order. Show Order count. Show Average price with info and Horizontal Line. Show lot open.
Show Price diff from average to price now Show broken price with info and Horizontal Line. Easy to use . How to use
Close All (Symbol) PC : you can click on CloseAl

Accelerator Oscillator by Bill Williams with the ability to fine-tune and replace the averaging algorithms of the indicator, which significantly expands the possibilities of using this oscillator in algorithmic trading and brings it closer in its properties to such an indicator as MACD.
To reduce price noise, the final indicator is processed with an additional Smooth averaging. The indicator has the ability to give alerts, send mail messages and push signals when the direction of movement o
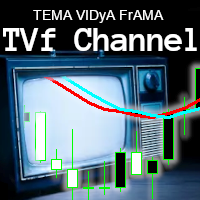
I really like this indicator. But I made it, so of course I would.. NOW FREE. But please consider supporting me by buying my 2 for sale indicators. You can multiply the weight of each indicator used to give more emphasis on it's value when averaging between the 3. Boost fast TEMA and it can move the indicator faster. Boost slow FrAMA and watch it smooth out. I like to use them as open/close lines and set them up so they move quick, but have the FrAMA smooth it out more.
Check out my other indi
This utility tool shows the ticker symbol, timeframe, and description information as a watermark on the chart. Text resizes automatically according to chart size. It is useful to identify the correct chart when multiple charts are shown on the screen. Premium version supports changing font name and color independently for symbol name and description, and defining screen location for symbol placement. See the demonstration video below!
Symbol Name Inputs: Font Name: Specifies font used. Needs
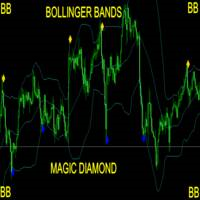
Take Your Trading Experience To the Next Level ! and get the Magic Bollinger Bands Diamond Indicator MagicBB Diamond Indicator is MT5 Indicator which can suggest signals for you while on MT5. The indicator is created with Non Lag Bollinger Bands strategy for the best entries. This is a system to target 10 to 20 pips per trade. The indicator will give alerts on the pair where signal was originated including timeframe. If signal sent, you then enter your trade and set the recommended pips targ

SUPPLY DEMAND EA PRO は、必要な金融商品を取引するための新しい方法を提供しています。それはあなたの取引経験を高めそしてあなたの利益を急上昇させるであろうはるかに多くの機能を備えたMTF需給指標に基づいています。ワンクリックで指値注文と成行注文を出す可能性があります。 EAはトレードのロットサイズを自動的に調整し、StopLossを半分または損益分岐点で管理します。私の意図は、すべての需給ゾーンでランダムな取引を行うEAを作成することではありませんでした。このEAは、手動取引を促進し、より簡単で快適にするために作成しました。あなたがしなければならないのは、チャートをスキャンして、取引したいゾーンを選択することです。次に、チャートから離れて、EAを機能させることができます。
How to Place Trades | How to Manage Trades | Alerts Settings | Adjust Panel Size | Nested Zones Strategy |
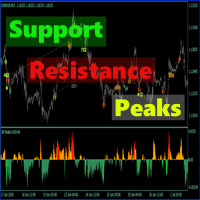
SupportResistancePeaks Indicator indicator - is the combination of dynamic support/resitance and price action pattern. As a rule support/resistance indicators uses already calculated, history levels. The most disadvantage of this method - new(incomming) levels always are not the same as were on history, in other words accuracy is not so high as expected. My indicator is looking for dynamic/live levels that are forming right now after trend lost it's power and choppy market starts. As a rule exac

OPTIMIZE EA BEFORE BACKTEST AND USE In times of high inflation, hedging with gold is valid. Trade this EA on the XAU/USD 5 minute chart. It is important to optimize sl a tp before use if out of date. This was built on this years data 2022. Also continual optimization of tp and sl is required for any EA. The strategy uses Williams Percent Range and ADX for entries and Standard Deviation and Moving Averages for exits. The lots are fixed and every trade has a stop loss and a take profit.

Awesome Oscillator by Bill Williams with the ability to fine-tune and replace the averaging algorithms of the indicator, which significantly expands the possibilities of using this oscillator in algorithmic trading and brings it closer in its properties to such an indicator as the MACD. To reduce price noise, the final indicator is processed with an additional Smooth averaging. The indicator has the ability to give alerts, send mail messages and push signals when the direction of movement of th

テストおよび使用前に EA を最適化してください。
Bitcoin M5 は、5 分チャートで BTC/USD を取引するためのものです。SL と TP は 50000 から開始する必要があります。使用前に最適化してください。
この取引戦略では、ボリンジャー バンドとエンベロープ インジケーターを使用して取引を行います。価格がバンドを突破するブレイクアウト ポイントを捉えて取引し、価格がエンベロープを越えたときに終了します。すべての取引で固定ロット数が使用され、SL と TP があります。EA は、ロジックでマーチンゲールやヘッジを使用しません。
テストおよび使用前に EA を最適化してください。
Bitcoin M5 は、5 分チャートで BTC/USD を取引するためのものです。SL と TP は 50000 から開始する必要があります。使用前に最適化してください。
この取引戦略では、ボリンジャー バンドとエンベロープ インジケーターを使用して取引を行います。価格がバンドを突破するブレイクアウト ポイントを捉えて取引し、価格がエンベロープを越えたときに終了します。すべて
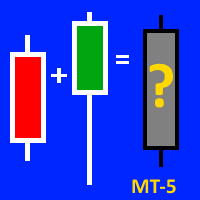
This indicator will be VERY USEFUL for anyone who works with candlestick patterns. This indicator is designed to display the average figure from two adjacent candles (current and previous). Accordingly, it shows IN CONTEXT the strength or weakness of bulls / bears (!). But please, don't forget about the classical basics of technical analysis (!). All indicators are just an auxiliary tool for reading a chart (!). A demo version on the example of mt-4 can be found here: https://www.mql5.com/ru/ma

MartexPO MT5 is a moderately aggressive advisor working on a martingale strategy and with the ability to hedge unprofitable positions. Uses pending orders for opening the first order and for hedging. With an asymmetric "lock" - the MartexPO MT5 EA is able to independently exit the "lock" with a profit. The MartexPO MT5 EA can average orders manually opened by a trader and orders opened by another EA. The EA will be of interest to both beginners and experienced traders. A set files and a guide to

The Black Dragon robot is designed to operate seamlessly across various trading symbols, such as currency pairs and metals, using its default settings, which eliminates the need for additional user intervention in most cases. When applying the robot to a single currency pair, no further adjustments are necessary, making it straightforward for beginners or those focusing on a specific market. However, for users who wish to expand its use to multiple currency pairs or symbols simultaneously, it’s

This robot features a simple user interface design, yet beneath its surface lies a wealth of advanced capabilities that enable a variety of functions. You have the freedom to create various order types, including market, stop, and limit orders, and you can choose to buy or sell. The strategy is fully customizable to suit your preferences, and you can select the calculation method for all exit levels, choosing between percentages or pips. What’s particularly interesting about this robot is that i
UR フロントエンドバックエンド
UR FrontEndBackEnd は、サポートとレジスタンスの最も正確なレベルを見つけるための私のお気に入りの公式です。 また、それらをさまざまなカテゴリ (破線、実線、および領域) に分割して、その強度を示しています。 すべてがバッファに格納されるため、簡単にアクセスして他のツール内で実装できます。
追加: ツールは、適用される資産に合わせて調整する必要がある場合があります。資産は、ツールに影響する価格の桁数に関して異なります。 そのために必要なパラメーターは、設定で提供されます。
UR FrontEndBackEnd を使用する利点:
計算の密度と距離を設定するための 2 つのパラメーターのみ サポートとレジスタンスはバッファ内に保存され、指定された資産の価格から上昇/下降します サポート/レジスタンスラインの強さをすばやく視覚的にフィードバックするための 3 種類のライン -> DASHED、SOLID、AREA ツールの最新情報を入手できる特別な電報チャットがあり、何か不足していると感じた場合はリクエストを送信することもで

RISK TO REWARD TOOL for MT5 with UI on chart: (creates similar RR boxes like on tradingview) -creates and deletes draggable boxes on chart, ANY SYMBOL, ANY TF. Menu buttons:
NEW BUY, NEW SELL, DELETE ALL, ( and minimize) -draggable target TP level
-draggable SL limit level
-text labels with pips SL TP, RR ratio-there is no limit of boxes
-but program remembers first 100 boxes after changing input. there is parameter "delete_on_init" so false = every created box stays as it is, true

Smart Market Scanner and Dashboard The trend is very important when trading a financial instrument. The trend can be identified by checking various of structures and indicators. Trend shifts can be identified by trendline breakouts and horizontal support/resistance levels. Scanner will scan the selected symbols and show you the direction/trend on selected timeframes. Algo is based on: Price Cycles, Fractals, Order Blocks, Hi-Lo
Advantages: Multi timeframe Multi instruments including Currencies,

Three Triple Exponential Average oscillators merged into one. Fast period will pull on the slower period, and the slower will smooth out the faster and avoid early positions. You can use 2 fast and 1 slow, or Fibonacci range or 2 slow, 1 fast. NOW FREE. But please consider supporting me by buying my 2 for sale indicators.
You can use this as an entry indicator and exit indicator. Open when the tripleTRIX line crosses the zero line and close when it starts to reverse. When the peaks get bigger,
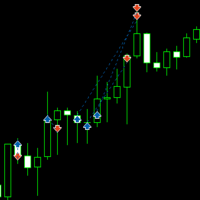
This robot is based on an MACD strategy for trending markets. The description of the strategy can be found on the attached youtube video. The video explains the strategy and shows a basic backtest and optimisation on a few symbols. It is advised to carry out a a backetst and optimisation of your own before using the robot. The video can be found at >> https://www.youtube.com/watch?v=wU_XCM_kV0Y  ;

Nade com os grandes ou evite-os a todo custo. Com esse indicador, a escolha é sua! Indicador por coloração de barras, com respostas simples se os "grandes" estão negociando ou não. Saiba quando agir se o mercado está calmo ou agitado, de forma simples, pelo valor de retorno do indicador ou pela aparência das barras.
Indispensável indicador para a construção do seu robô ou para seu setup. Resultado do Indicador: 0 - 5. Participantes do mercado: 0 e 1 = Big Players! 2 e 3 = Dia normal. 4 e 5 = Mo

Две простых симметричных пробойных трендовых системы для лонгов и шортов, которые работают абсолютно независимо друг от друга. В основе алгоритма открытия позиций пробой ценой по тренду мувинга, сдвинутого по вертикали на фиксированное в настройках эксперта количество пунктов. Входные параметры эксперта разбиты на две большие группы: Для лонгов с префиксом "L";
Для шортов с префиксом "S". Поскольку в данном эксперте две торговые системы, то оптимизировать и тестировать их сперва следует отдельн

OPTIMIZE For settings. SL and TP should Start with 50000 Important to get the optimization before backrest and use. I optimized on the last month option in the strategy tester. BTC Miner was build for trading BTCUSD on 1 hour time frames. About the EA and strategy: It uses ADX and Envelopes to enter trades and uses Momentum and Moving Average crossovers for exits. There is a fixed lot size and all trades have a SL and TP. The EA does not use martingale or hedging as its strategy, it is based

The Weis Wave Chart for MT5 is a Price and Volume indicator. The Price and Volume reading was widely disseminated through Richard Demille Wyckoff based on the three laws created by him: Supply and Demand, Cause and Effect and Effort vs. Result. In 1900 R.Wyckoff already used the wave chart in his analyses. Many years later, around 1990, David Weis Automated R. Wyckoff's wave chart and today we bring you the evolution of David Weis' wave chart. It shows the amount of Volume and the amount of pips

The Weis Wave Chart Forex for MT5 is a Price and Volume indicator. The Price and Volume reading was widely disseminated through Richard Demille Wyckoff based on the three laws created by him: Supply and Demand, Cause and Effect and Effort vs. Result. In 1900 R.Wyckoff already used the wave chart in his analyses. Many years later, around 1990, David Weis Automated R. Wyckoff's wave chart and today we bring you the evolution of David Weis' wave chart. It shows the amount of Volume and the amount o
This product generates signals at closing bars thanks to channel scaling. It visualizes these signals with an arrow. The color of the arrow indicates the direction of the trade. The default settings are valid for the H1 period. You can backtest for each period and product. The code content of the indicator has been applied in accordance with price movements as much as possible. For this reason, it detects trend beginnings and ends well.
Parameter descriptions:
PER: Indicates the number of bar

Archiは指標に基づいており、その数は将来的に増加するでしょう。 「トレーリング位置」と「ステップトレーリング」で「トレーリングストップ」を使用することができます。 乗算と加算の両方によって、損失を被る現在のトランザクションを使用して、後続のトランザクションのボリュームを増やすことができます。 不採算の取引よりも肯定的な取引の優位性に達した後、ボリュームは元の取引に戻ります。
アーチベーシックセッティング:
マジックナンバーは、すべてのオープン取引の一意の番号です。 注意!!! アドバイザは履歴を処理するため、以前の番号とは異なる一意の番号を使用する必要があります
Volume-開いているトランザクションの最初のボリューム
選択した係数でロットを増やすための記号–ボリュームを増やすための記号
ボリューム増加率-ボリュームが増加する値
スリッページ-お得な情報を開くときの価格スリッページ
利益を取る-ポイントで所望の利益
ストップロス-ポイントの損失に達したときに取引を閉じる
Trailing Activator-後続操作のアクティブ化
トレーリングストップ-現

数列の一つに「森林火災数列」があります。これは、最も美しい新しいシーケンスの 1 つとして認識されています。その主な特徴は、このシーケンスが線形トレンドを回避することです。最短のものであってもです。この指標の基礎を形成したのはこのプロパティです。 財務時系列を分析する場合、この指標は可能なすべての傾向オプションを拒否しようとします。そして失敗した場合にのみ、トレンドの存在を認識し、適切なシグナルを発します。このアプローチにより、新しいトレンドの始まりの瞬間を正しく判断できます。ただし、偽陽性の可能性もあります。それらの数を減らすために、このインジケーターに追加のフィルターが追加されました。新しいバーが開くとシグナルが生成されます。いずれの場合も再描画は発生しません。 指標パラメータ: Applied Price - 適用価格定数; Period Main - インディケータのメイン期間、その有効な値は 5 ~ 60 です。 Period Additional - 追加の期間。このパラメーターの有効な値は 5 ~ 40 です。 Signal Filter - 追加の信号
A basic tool for traders to trade percentile of the value. It indicates both values in the for of digits appeared on the left corner of the screen.
Instructions Manual : First choose your desired symbol and then select this tool. Please be remined that this tool is just a helping tool. its upon trader what he desired so. The function of this tool is just to provide a help in trading.
UR モメンター
UR Moenter は、オシレータとして表される価格変動の枯渇に相関する価格のモメンタムを完全に計算します。 したがって、これは潜在的な反転またはリトレースメントの本当に初期のシグナルを提供します. この公式は、2018 年に市場バブルが崩壊した後に発見されました。
UR Moenter を使用する利点:
パラメータなし 価格の動きを表す 2 本の線があります。白線は、オシレーター (青い線) として表される価格の移動平均偏差と相関する価格のモメンタムです。 ヒストグラムは、価格の勢いに応じた最大偏差を視覚化したものです インターフェースは、両極端 (上部の赤と下部の緑の領域) のいずれかの線の枯渇を示しています。 最大の利点: 簡単で、すべてのアセットに合わせて調整できます。 ツールの最新情報を入手できる特別な電報チャットがあり、何か不足していると感じた場合はリクエストを送信することもできます!
UR モメンターを選ぶ理由
このインジケーターは、スタンドアロンのエントリーまたはエグジット インジケーターとして使用できます。 価格に依存しているため

Best helping tool for Professional and Experienced traders. A best Tool To find the trend. Instruction Manual: First Select your desired Symbol. Then attach this tool and wait till it identify the trend for you. Then it will be more feasible to trade.
Once again best tool to trade. Demo version is available you can fully test its functionality. More importantly there are always trend breaks Once Trend break is observed un-attach this tool and then re-attach to get the fresh trend. Precautions:

A value indicator for experienced and professional traders. It is helping tool to indicate the direction value gain. A best helping tool to trade value. This indicator is equipped with a colored line and a digital tool to indicate value numerically .
This indicator also helps to indicate value during trends. A study based on this indicator shows value of trade significantly changes during trends best tool to cash the trends.
A technical Indicator Providing Price Convergence Signals along with value for experienced and professional traders. Easy to comprehend, Easy to understand.
This is a helping tool provides best signals. This indicator is designed based on the fundamentals of trade. A very good indicator you can customized its color. A best tool to find trade direction.
An adaptive indicator. It constantly adapts to the trade.

Drawdown Limit EA Prop Firm trading MT5
If you found this EA, it's probably because you want to get a funded account with a prop firm, but you see a rule that most of traders fear : Maximum Daily Drawdown. I've been through this problem myself as I'm a prop firm trader and I've made a bot to solve this rule, and you can get it to solve this problem too.
How does it work ?
When you first setup this EA, you need to input the initial deposit which corresponds to the size of your funded account.

LAZY TRADER MT5
Lazy Trader was designed to do all of the complex trading for you, so you can you relax on your couch, or sleep the night away. There is no reason to learn how to trade Forex when using Lazy Trader.
YOU DO NEED TO UNDERSTAND RISK AND MONEY MANAGEMENT HOWEVER...... Ok to Be Lazy and Smart, but PLEASE not Lazy and Stupid. READ THE RISK WARNING BELOW.
It's time for you to put your feet up and allow your trading bot do all the complicated work for you. After all, you deserve

Hello;
This indicator provides input and output signals of real volume levels with some mathematical calculations. It is simple and safe to use. As a result of the intersection of real volume levels with averages, it creates buy and count signals.
Indicator parameter descriptions:
A-PERIOD: Indicates the number of bars to be calculated.
B-GAMMA: A fixed Fibonacci trend average of 0.618 is used.
Use C-VOLUME TYPE:Tick volume as a constant.
D-HIGH LEVEL 2: Represents the level of the second
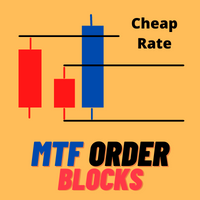
Very precise patterns to detect High Accurate Order Blocks: It Draw zone after market Structure Breakout with a high Accuracy, institutional orders with the potential to change the price’s direction and keep moving towards it, have been placed. Features Auto Order Blocks Draw MTF Order Blocks Double Signal One Alert Signal Second Long Wick Rejection Signal Market Structure BOS LINE How to show MTF order Block Go on indicator setting at the end of scroll you see OTF Setting change Timeframe

В основе индикатора EasyBands лежит тот же принцип, что и при построении Bollinger Band. Однако, данная модификация индикатора использует вместо стандартного отклонения средний торговый диапазон (Average True Range). Соответственно, с данныи индикатором абсолютно аналогично можно использовать все стратегии, которые применяются с Bollinger Band. В данной версии индикатора используется двенадцать уровней и средняя линия (белый цвет). Индикация тренда выполнена в виде окраски свечей в зависимости

TRACKINGLEVELS (SUPPORTS AND RESISTANCES)
TrackingLevels is a useful indicator that saves considerable time when a trader starts analyzing a chart. This indicator draw on the chart all the resistances and supports that the market is creating. The resistance and support levels are very important, this levels define areas where there can be a considerable accumulation of sell or buy orders. These are a key areas that every trader must know and keep in mind all the time. This indicator helps the t

GM Bounty Hunter MT5 is a fully automated/semi-automatic, The robot trades according to the overbought and oversold levels of the market. The EA's unique trading strategy has a high probability of winning. GM Bounty Hunter MT5 is optimized for use with low spread currency pairs. Info:
Working symbol XAUUSD, EURUSD, GBPUSD, USDJPY,.... Working Timeframe: M1, .....(The larger the timeframe, the more stable the signal) Min deposit $125 with Stop Loss settings (or equivalent in cents ) The minimum
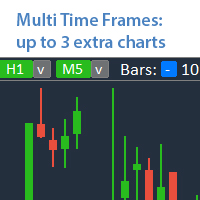
他の時間枠の最大3つの追加チャートを分析 ,メインのチャートを切り替えずに。 多機能ユーティリティ : 66+ の機能を含むこのツール | ご質問があればお問い合わせください | MT4 バージョン このインジケーターは 別ウィンドウ で開きます: ウィンドウ を移動 可能( [<M>] ボタンを使用)。 ウィンドウはスペースを節約するために最小化することもできます ( [ <^>] ボタン) 表示されたウィンドウで設定可能です: 1番目のチャート の期間(左);
2番目のチャート の期間(中央); 3番目のチャート の期間(右);
(各時間枠は無効化可能);
各時間枠の バーの数 。
最大バーの数:
a) 3つのアクティブチャート:30;
b) 2つのアクティブチャート:45;
c) 1つのアクティブチャート:90;
Hello friends. I wrote this utility specifically for use in my profile with a large number of Expert Advisors and sets ("Joint_profiles_from_grid_sets" https://www.mql5.com/en/blogs/post/747929 ). Now, in order to limit losses on the account, there is no need to change the "Close_positions_at_percentage_of_loss" parameter on each chart. Just open one additional chart, attach this utility and set the desired percentage for closing all trades on the account. The utility has the following fu
This indicator scans the 1-3 Trendline pattern . The indicator is a 100 % non repaint low risk breakout system . The patterns are formed around swing high and swing lows which make them a low risk pattern with high reward.
PATTERN BACKGROUND The 1-3 Trendline Breakout pattern is formed by four(4) points which are composed of three (3) primary points and the pattern neck. A trendline is always formed by the point 1 and the neck of the pattern . When price breaks out of the trendline formed , it
Automatic Expert Advisor. Night scalp system, with trend detection and pullback entry. Dynamic exit signal, for SL or TP. Every trade has fix SL. No usage of risky strategies like martingale, hedge, grid etc.
About EA Scalper strategy Technical strategy Can use with small deposits Pairs with best rezults: AUDNZD, AUDCAD, AUDCHF, EURAUD, GBPAUD, USDCHF, CADCHF, EURNZD, EURGBP, GBPCAD, GBPCHF, EURCHF Time Frame: M15 Recommendations Broker account with ECN and low spread Test it first to find out

** All Symbols x All Timeframes scan just by pressing scanner button ** ***Contact me to send you instruction and add you in "RSI scanner group" for sharing or seeing experiences with other users. + FREE Trading Utility MT5
Introduction RSI divergence is a main technique used to determine trend reversing when it’s time to sell or buy because prices are likely to drop or pick in the charts. The RSI Divergence indicator can help you locate the top and bottom of the market. This indicator finds

Trade any currency, crypto, cfd or stock in any timeframe depending on 2 moving averages , from scalping to position trading. All parameters and functions can be modified and de/activated in the settings, there's no hidden algorithm. The Universal Moving Average Expert Advisor ( UniMA EA ) trades a simple strategy that works well with dozens of profitable settings.
All backtest results shown in the screenshots below and tradet in the signals can be tested with the provided set files in the com
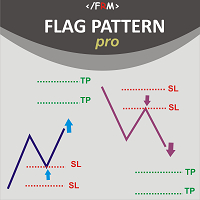
Flag Pattern pro is a Price Action (PA) analytical tool that scans the continuation patterns known as "Flag and Pennant Patterns" .
Flag and Pennant patterns are continuation patterns characterized by a move in a previous trend direction after a shallow retracement usually below 50% of the original move . Deep retracements can however be sometimes found at the 61.8 % levels. The original move is know as the flag pole and the retracement is called the flag.
Indicator Fundam

Description :
A utility to create and save screenshots automatically and send to a chat/group/channel on telegram.
The saved/sent image file will include all objects that exist on the chart and also all indicators are displayed on the chart.
Features: Save screenshot of chart including all objects, indicators, ... Send screenshots to a telegram chat/group/channel
Wide range options to select when create screenshots
Logo and text adding feature
Inputs and How to setup the EA :
Various option
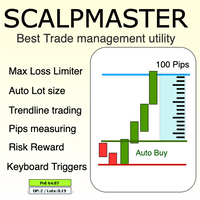
The Scalp Master tool not only provides proper trade management but also helps a trader to build a proper psychology and discipline to gain consistent results in his trading. It offers Max loss Limiter ( Risk per position ) and RPT limiter (Risk per trade), Auto calculates Lot size, CLOSE multiple trades with single click. Buy, Sell, Close with default Trend line and Horizontal line , Pips measuring tool, risk reward measuring tool and many other features. This tool offers to place quick

This EA is suitable for trading on the pair and else several. The EA itself uses universal strategies, but so far they are optimized for some currency pairs. Many settings can be adjusted. There are two panels on the chart, for visualization and settings. He displays his decision on the graph in the form of arrows. There are only two types of arrows. It does not use martingale. It works fine in the tester by default in the settings. It is already configured by default. You can also specify the
EUR/USD通貨ペアでの取引のためのシンプルなExpert Advisorだけでなく
BuxソロのLiteバージョン https://www.mql5.com/ru/market/product/84862
BUX EA エンジンを搭載
オプトVAR:S1 (OPT.VER: S1)
信号生成のための最適なインジケータセット シグナルでの取引の開始/終了/シグナルなし、保留中の注文 マーチンゲールモード 仮想トレーリングストップ(ブローカーには表示されません)
ストラテジーテスターを使用して、取引戦略をテストし、最適化します
必要な情報はすべてFAQにあります。 https://docs.google.com/document/d/1mIEhAeDSlmc5OtgwMSnlw7HSDK0Yvjk_1H36rMX7QZU/edit?usp=sharing

EUR/USD通貨ペアでの取引のためのシンプルなExpert Advisorだけでなく
BUX EA エンジンを搭載 https://www.mql5.com/en/market/product/82887
オプトVAR:S1 (OPT.VER: S1)
信号生成のための最適なインジケータセット シグナルでの取引の開始/終了/シグナルなし、保留中の注文 マーチンゲールモード(ダイナミックマーチンゲールを含む) 仮想トレーリングストップ(ブローカーには表示されません)
ストラテジーテスターを使用して、取引戦略をテストし、最適化します
必要な情報はすべてFAQにあります。 https://docs.google.com/document/d/1mIEhAeDSlmc5OtgwMSnlw7HSDK0Yvjk_1H36rMX7QZU/edit?usp=sharing

M & W Pattern Pro is an advanced scanner for M and W patters , it uses extra filters to ensure scanned patterns are profitable.
The indicator can be used with all symbols and time frames.
The indicator is a non repaint indicator with accurate statistics calculations.
To use , simply scan the most profitable pair using the statistics dashboard accuracy , then enter trades on signal arrow and exit at the TP and SL levels.
STATISTICS : Accuracy 1 : This is the percentage of the times price hits TP
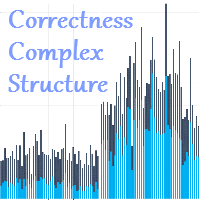
The Correctness Complex Structure indicator displays the complex structure of the bar, taking into account tick volumes in digital terms. How to interpret the information provided by the indicator. It's very simple, it's enough to analyze the chart. We will explain the work using an example, take the EURUSD instrument on the D1 timeframe, install this indicator and analyze the information provided by the indicator. The indicator works in the bottom of the chart and gives the result in the form

Of all the tasks that a trader faces when entering a market, the main task is to determine the direction of the trend. The Artificial Power indicator will help you with this task. Whatever goal the trader sets for himself, the tool to achieve it will be mainly trend indicators.
The Artificial Power indicator without delay and redrawing is used by traders in trend strategies in trading on financial markets (Forex, CFD, binary options). This indicator is designed to detect trends in price moveme
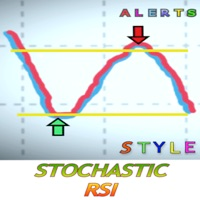
ストキャスティックRSIとは?
ストキャスティックRSI(StochRSI)は、0から1(またはいくつかのチャートプラットフォームでは0から100)の間で、標準的な価格データではなく、相対強度指数(RSI)の値のセットにストキャスティックオシレータ式を適用することによって作成されるテクニカル分析で使用される指標です。このバージョンでは、本当に良い機会を逃さないための警告が含まれています。あなたは、シグナル買い注文またはシグナル売り注文を受信したいときにパラメータを設定します。シグナルを受信するためには、MetaQuotes IDを介してデスクトップ版とMetatraderアプリを接続する必要があります。MetaQuotes IDは、MT4/5アプリのSetting >>Chat and Messagesで確認できます。デスクトップ版では、Tool>>Option>>Notificationsにあります。デスクトップ版にIDを入れ、通知をアクティブにすれば準備完了です。
MT4版を試すにはこちら
スタイルが重要だから
私はそれがろうそくの色、明るいまたは暗いへの背景を変更し、

MartexMT5 is a moderately aggressive EA working on a martingale strategy with hedge. The EA independently monitors the risk and, if the risk is high, takes measures to exit the market with a minimum profit. In the hedging mode, the EA independently leaves the "lock" with a profit. A complete guide to the MartexMT5 EA can be found in the "Comments" section. Benefits automatic magic number, individual for each currency pair; automatic breakeven and automatic trailing stop; at high risk, reducing t
CalcFlat Creative is a flat indicator.
This is a more advanced version of the CalcFlat indicator. Three lines have been added for this indicator, which significantly improve the performance of the predecessor indicator. In addition to the two existing levels that the user reacted to and which were static, now the indicator has three dynamic lines on top of the main chart and interpreted as: signal line base, signal minimum, signal maximum.
These lines are formed due to the additional indicato

Multicurrency Expert Advisor works on the basis of determining several candlestick patterns, which should simultaneously form on several trading instruments.
Please test the Expert Advisor with 100% quality of quotes!
Built-in hedging system allows you to increase the stability of the work, reduces the drawdown and greatly increases the probability of reaching the take profit, specified in the settings of the expert. Version for MT4: https://www.mql5.com/en/market/product/84876
Check that

Gann 9+ Indicator Introduction The "Gann Matrix Chart" is the most simple and clear technical analysis in Gann theory, which is the calculation tool that Gann has always been committed to using. It is the essence of Gann's whole life. The Gann 9+ indicator uses the matrix chart to find the future high or low points of stocks or futures. Indicator Input: The base and step size can be set as 1 by default; When the multiple is -1, the multiple will be automatically obtained, or it can be filled in

NeodymiumX is an expert advisor specialized to trade indices NASDAQ/ NDX100/ US100/ NAS100. It uses no dangerous strategy (matingale, grid, etc) and gives a safe and steady growth of an account. Unlike some commons NAS100 EA that only use buy order/position, NeodymiumX use buy or sell position according to the market trend. So it can make profit on both directions and still profitable even when US100 price drop (like at the beginning of 2022 until around June 2022). NeodymiumX live performance

Mega Recuroid is a professional expert system developed for market analysis based on the Recuroid indicator. The Expert Advisor works with one order (not a series), each order is accompanied by a stop loss and a take profit. Thus, the expert system uses safe orders for its work. The indicator entry itself can also be considered reliable, since a reliable Recuroid indicator is used. The principle of entry and holding/maintaining a position on the market is clear, there is a signal, close the opp

STARGOGS PRICE ACTION EA ABOUT: This Robot is based on Price Action mostly Trendlines and Support & Restistance. The Robot Also uses 2 Strategies which you can choose from by choosing which one to use (True/False) Strategy 1: One Entry at a time with Fixed TP and SL. Strategy 2: Grid and Matingale. You can also use this EA as a Indicator by Turning Trading off also by using (True/False). You can aslo use Lot multiply on loss if you want or use fixed lotsize. MINIMUM BALANCE:
The Minimum Balanc
MetaTraderマーケットは、他に類のない自動売買ロボットやテクニカル指標の販売場所です。
MQL5.community ユーザーメモを読んで、取引シグナルのコピー、フリーランサーによるカスタムアプリの開発、支払いシステムを経由した自動支払い、MQL5Cloud Networkなど、当社がトレーダーに対して提供するユニークなサービスについて詳しくご覧ください。

取引の機会を逃しています。
- 無料取引アプリ
- 8千を超えるシグナルをコピー
- 金融ニュースで金融マーケットを探索