 MetaTrader 5
 エキスパート
 インディケータ
 ライブラリ
ライブラリ
 ユーティリティ
 ウィジェット
 ルール
ルール
YouTubeにあるマーケットチュートリアルビデオをご覧ください
ロボットや指標を購入する
仮想ホスティングで
EAを実行
EAを実行
ロボットや指標を購入前にテストする
マーケットで収入を得る
販売のためにプロダクトをプレゼンテーションする方法
MetaTrader 5のための新しいエキスパートアドバイザーとインディケータ - 477
 自動売買ロボットとインジケータを使用して、外国為替取引の収益性を高めます。 自動売買ロボットを使用すると、取引の開始と終了を自動化でき、インジケータは市場の行動をより正確に予測するのに役立ちます。
このページには、MetaTrader5アプリケーションのカタログが掲載されています。
自動売買ロボットとインジケータを使用して、外国為替取引の収益性を高めます。 自動売買ロボットを使用すると、取引の開始と終了を自動化でき、インジケータは市場の行動をより正確に予測するのに役立ちます。
このページには、MetaTrader5アプリケーションのカタログが掲載されています。 
The robo t opens a buy or sell position using the signs.
Know our products
Position openings are based on the parameters identified as signals, if you activate all the robot will issue a trading order only if the number of signals is greater than the minimum stipulated by the user.
The filters are used to increase the accuracy of the signals and if activated and not met your criteria, the order is not sent.
EA also offers MOBILE STOP with the Parabolic SAR indicator and also by distance

(暗号通貨チャート)
指定した数のバーの数だけ履歴が表示され、インスタントデータが直接表示され始めます。
すべての時間枠で働く機会を提供します。
複数のシンボルを操作できます。
このアプリはバックグラウンドサービスです。
マーケットウォッチ画面に「F」で始まるすべてのシンボルの履歴をダウンロードし、ティックデータを表示します。
BinanceFuturesのリアルタイム取引データをMT5に自動的に転送します。
リンク内のスクリプトを実行して、プログラムを使用します。 https://www.mql5.com/en/market/product/68691
このプログラムはインストールが必要です。
https://www.mql5.com/tr/market/product/73887
[ツール]メニュー>> [オプション] >> [エキスパートアドバイザー]からWebRequestを許可し、URLを追加する必要があります:https://fapi.binance.com
このインジケーターは、さまざまなタイムスケールでの多くのチャートのレビューをより迅速かつ簡単に行えるように設計されています。 複数のチャートで時間と価格を追跡 1 つのチャートでシンボルを変更すると、同じシンボルの他のすべてのチャートも変更されます。 使いやすく、すぐにマスターできます このインジケーターを使用すると、同じシンボルで開いている他のすべてのチャートで、マウス ポインターが現在のチャートにある価格と時間を特定できます。これにより、複数のチャートで情報をすばやく確認できますが、通常は同じ場所を特定するのに時間がかかります。 開いているすべてのチャートで時間だけを追跡することもできます。これにより、発散ハンティング時に簡単にナビゲートできます。 1 つのチャートでシンボルを変更すると、同じシンボルの他のすべてのチャートが新しいシンボルに切り替わり、時間枠の設定が維持されます。 使い方
チャートを確認するとき、傾向と取引レベルを特定するために、いくつかの時間枠を見るのが好きです。このツールを作成したのは、それを支援するためであり、長期にわたっていくつかのチャートを見渡すビジュアル

(暗号通貨チャート)
BinanceFutureのすべてのシンボルをカスタムシンボルに保存します。
BinanceFutureのシンボルに「F」プレフィックスを追加します。
BinanceFutureのシンボルをたどることができるインフラストラクチャを作成します。
[ツール]メニュー>> [オプション] >> [エキスパートアドバイザー]からWebRequestを許可し、URLを追加する必要があります:https://fapi.binance.com
スクリプトをダブルクリックするだけです。
リスト全体が数秒で表示されます。
リンク https://www.mql5.com/en/market/product/68694の製品を参照してください
FREE

算術平均または中央値を使用して、時系列の中心的な傾向の尺度を決定できます。どちらの方法にもいくつかの欠点があります。算術平均は、単純移動平均インジケーターによって計算されます。エミッションやノイズに敏感です。中央値はより安定して動作しますが、間隔の境界で情報が失われます。 これらの欠点を減らすために、疑似メディアン信号フィルタリングを使用できます。これを行うには、短い長さの中央値を取得し、調査中の財務時系列の期間のすべての値に再帰的に適用します。このアプローチのおかげで、インディケータを使用すると、定期的およびトレンドの価格変動をより正確に識別できます。 インジケーターの外部パラメーター: インジケーターを開始するとき、[パラメーター]タブで、計算に使用される価格定数を選択します(デフォルトでは閉じる)。 iPeriod-インジケーター期間。このパラメーターの値が高いほど、最新の価格変動に対するインジケーターの感度が低くなります。このパラメーターの最小値は3です。 MaxBars-計算の履歴の深さを制限します。インジケーターの起動に時間がかかる場合に便利です。 MaxBars = 0

Comprehensive on chart trade panel with the unique ability to be controllable from mobile as well. Plus has a library of downloadable configuration, e.g. exit rules, extra panel buttons, pending order setup and more. Please see our product video. Works with all symbols not just currency pairs. Features On chart panel plus controllable from free app for Windows, iPhone and Android Built-in script engine with library of downloadable configuration, e.g. add 'Close All Trades in Profit' button, exit

The EA is based on a scalping strategy in a calm market time. In quiet times, the price on the chart is almost always in the Flat, and the EA trades in the flat. The EA provide a variety of filters to filter out trend situations and trade only during flat price periods. Each trade uses a stop loss and take profit. Also, smart filters for fixing the transfer of stops to profit. To create a strategy, we used historical data with a history quality of 99.9%. The EA has the following features: Uses a

Plug & Play portfolio - series of high-quality EURUSD H1 strategies for maximized success. This EA alone can bring you great profits, but for the best results check also rest of the EUR portfolio . Strategy is using CCI indicator for finding suitable trade and then sets the pending order according to daily extremes. No grid, no martingale, no tuned backtest, no fairytales, but real results. This EA has passed 9 robustness tests, indicating good strategy quality.
Benefits for you Plug & Pla
Трендовая торговая система для работы на рынке Forex на одной из десяти валютных пар - EURUSD, GBPUSD, AUDUSD, USDCAD, USDCHF, USDJPY, EURJPY, GBPJPY, AUDJPY,XAUUSD. Система может открывать одновременно до десяти позиций с использованием десяти различных, независимых друг от друга алгоритмов входа в пределах одного трендового направления с индивидуальными стопами для каждой позиции. Для каждого алгоритма предусмотрен свой магик-номер. При смене тренда все открытые позиции закрываются одновременн
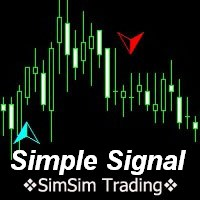
MT5 trend indicator works without redrawing. Provides signals for entering trades, works on charts of any instrument. Трендовый индикатор МТ5, работает без перерисовки. Выдает сигналы для входа в сделки, работает на графиках любого инструмента. Input parameters are for styling and messages only. / Входные параметры только для оформления и сообщений. All original signal calculations do not need additional parameters. / Все оригинальные расчеты сигнала, не нуждаются в дополнительных параметрах.
In order to detect "Big activity", new elements of the VWAP standard indicator were incorporated into this project.
In short, the plotted lines represent the moving average with EMA[VWAP]=VWAP[EMA].
Averages of the prices have been combined with volumetric weights and exponential decay.
Also, it was included the same weights to compute the standard deviation.
The parameter called as "strain" is a linear constant shifting the result (strain)xSD(VWAP).
So, a any set of bands can be plotted.
Also,

BEHOLD!!!
One of the best Breakout Indicator of all time is here. Multi Breakout Pattern looks at the preceding candles and timeframes to help you recognize the breakouts in real time.
The In-built function of supply and demand can help you evaluate your take profits and Stop losses
SEE THE SCREENSHOTS TO WITNESS SOME OF THE BEST BREAKOUTS
INPUTS
MaxBarsback: The max bars to look back
Slow length 1: Period lookback
Slow length 2: Period lookback
Slow length 3: Period lookback
Slow leng
FREE
An indicator of pattern #49 ("Triangle, symmetrical") from Encyclopedia of Chart Patterns by Thomas N. Bulkowski. Parameters: Alerts - show alert when an arrow appears Push - send a push notification when an arrow appears (requires configuration in the terminal) PeriodBars - indicator period K - an additional parameter that influences the accuracy of pattern shape recognition ArrowType - a symbol from 1 to 17
ArrowVShift - vertical shift of arrows in pixels ShowLevels - show lines ColUp - co
An indicator of patterns #39 and #40 ("Rounding Tops" and "Rounding Bottoms") from Encyclopedia of Chart Patterns by Thomas N. Bulkowski. Parameters: Alerts - show alert when an arrow appears Push - send a push notification when an arrow appears (requires configuration in the terminal) PeriodBars - indicator period K - an additional parameter that influences the accuracy of pattern shape recognition. Changes from 0 to 1 ArrowType - a symbol from 1 to 17 ArrowVShift - vertical shift of arrows
An indicator of patterns #11 and #12 ("Diamond Tops" and "Diamond Bottoms") from Encyclopedia of Chart Patterns by Thomas N. Bulkowski. Parameters: Alerts - show alert when an arrow appears Push - send a push notification when an arrow appears (requires configuration in the terminal) PeriodBars - indicator period K - an additional parameter that influences the accuracy of pattern shape recognition ArrowType - a symbol from 1 to 17 ArrowVShift - vertical shift of arrows in pixels ShowLevels - s
An indicator of patterns #37 and #38 ("Rectangle Tops" and "Rectangle Bottoms") from Encyclopedia of Chart Patterns by Thomas N. Bulkowski. Parameters: Alerts - show alert when an arrow appears Push - send a push notification when an arrow appears (requires configuration in the terminal) PeriodBars - indicator period VertexCount - the number of tops and bottoms: 2, 3, 4. ArrowType - a symbol from 1 to 17 ArrowVShift - vertical shift of arrows in piхels ShowLevels - show levels ColUp - colo
An indicator of patterns #7 and #8 ("Bump-and-Run" and "Bump-and-Run Reversal") from Encyclopedia of Chart Patterns by Thomas N. Bulkowski. Parameters: Alerts - show alert when an arrow appears Push - send a push notification when an arrow appears (requires configuration in the terminal) PeriodBars - indicator period K - an additional parameter that influences the accuracy of pattern shape recognition ArrowType - Character: from 1 to 17 ArrowVShift - vertical shift of arrows in pixels ShowL

You can think of these indicators as moving pivot points. MasterChartsTrading Price Action Indicators show good price levels to enter or exit a trade. The Blue indicator line serves as a Bullish Trend setter. If your instrument closes above the Blue line, we think about going Long (buying). When your trading instrument closes below the Red line, we think about Shorting (selling). It is very easy to read price action if you have a reference point. These support/resistance lines are there to help
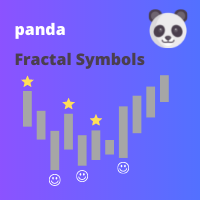
This indicator displays fractal symbols and bars Use this indicator to show different symbols for bearish and bullish fractals: Choose from 144 symbols (refer to table below) Colors, size and offset of fractals can be modified Fractal price bar or candle color can be changed Hide fractals and show fractal price bar only Frequency in fractal calculation can be changed
How to use 1. Select which symbols to use for bearish and bullish fractals; 2. Select which colors to use for bearish and bullis
FREE

DYJ Tradays Economic Calendar is calendar Indicators of macroeconomic events for fundamental market analysis. Therein you will find financial news and indicators for the largest global economies – from the US and the EU to Australia and Japan, a total of 23 economies, involving more than 60 currency pairs. More than 800 macroeconomic indicators and events are collected from public sources in real time. Historical, current and forecast values, as well as importance characteristics are available

EMA Crossover Pro MT5 this EA uses two exponential moving average crossover, a slow ema, and a fast ema on which it takes buy/sell decision.
A default ema configuration is 12 and 35 where 12 is the value of slow ema, and 35 is the value of fast ema.
Expert advisor parameters:
stop loss (greater than 40, but some brokers accept stop loss under 40)
take profit (greater than 40, but some brokers accept stop loss under 40)
trailing_stop (set it as 0 for disabling trailing stop)
slow ema (21 by defau

This reliable, professional trade copier system is without a doubt one of the best on the market, it is able to copy trades at very fast speeds from one master account (sender) to one or multiple slave accounts (receivers). The system works very fast and mimics the master account a full 100%. So changing stop losses, take profits, pending orders on the master account is executed on the slave accounts too, like each other action. It is a 100% full copy (unlike many other copiers who only copy ma
FREE

This is a tool created for scalping. it can generate pending orders with 4 input: 1. Volume : Lot for the Pending Orders 2. Distance : Distance within the Orders in Points 3. Total Order : Total Generated Orders 4. Take Profit : TP for the generated Orders in Points 5. Stop Loss : SL for the generated Orders in Points It also have another tools which can monitor the floating and close at defined profit using Closed at Profit Input What's new: - Stop Loss in Pip
FREE

This reliable, professional trade copier system is without a doubt one of the best on the market, it is able to copy trades at very fast speeds from one master account (sender) to one or multiple slave accounts (receivers). The system works very fast and mimics the master account a full 100%. So changing stop losses, take profits, pending orders on the master account is executed on the slave accounts too, like each other action. It is a 100% full copy (unlike many other copiers who only copy ma

Let the KING trades!!!
KING of TRADES is a trading system that can be optimized according to: - Trend indicator: Ichimoku Kinko Hyo (either in different timeframe) - Trigger system: Fractals - Filter - trade in: Stochastic Oscillator (values and upper and lower limits) - Stops definition: ATR (period and long and short takeprofit and stoploss) - General: magic number, autolot (% balance), symbol digits, max spread and max number of openned orders Default configuration on EURUSD, H1.

• Please test the product in the Strategy Tester before purchasing to understand how it works.
• If you face any issues, contact me via private message—I’m always available to help.
• After purchase, send me a screenshot of your order to receive a FREE EA as a gift.
Some users are very comfort 2 able keeping their trades for ages, while other users are happy to get the least and leave :)
If you cannot wait on your trades, then this expert will be the best for you!
The expert tries to en

Super Bollinger EA is an exclusive expert advisor that uses Bollinger Bands as indicator. It´s possible to configure the EA to trade as a low frequency or high frequency one - Scalping expert advisor. A Stochastic Oscillator filter is implemented to have some specific trades on Bollinger Bands. Takeprofit and Stoploss are calculated according to Bollinger Bands width or even with fixed TP and SL ( in points ). A trail and trade out system can also be configured and optimized. A number of orders
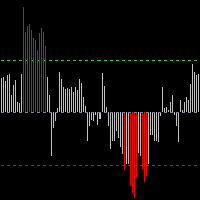
O Indicador BOPCoiote é uma releitura do indicador Balance of Power proposto por Igor Livshin em Agosto de 2001, publicado na Stocks and Commodities Magazine. Uma média móvel de 14 períodos é recomendada para gráficos diários. Embora o número de períodos possa variar dependendo da natureza do mercado e dos prazos.
O nível em que ele agrupa seus fundos e topos é considerado uma das propriedades mais importantes do indicador BOP.
Durante as tendências de alta, suas máximas frequentemente tocam os
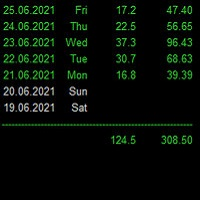
Statistics for each day
Индикатор показывает статистику - итоговую конечную прибыль/убыток по каждому отдельному торговому дню с учетом свопов и комиссий. Параметры : Dey - количество анализируемых дней; Weekday color - цвет будних дней; Weekend color - цвет выходных дней; Loss color - цвет убытка; font_size - размер шрифта; font_face - название шрифта; Для удобства просмотра статистики за большие временные периоды, при инициализации индикатор выгружает данные в Statistics.csv
Созданный файл иск

EQUITY DRAWDOWN MONITOR This is a simple mt5 advisor that monitors the drawdon levels Features:
Easy to use Useful for money managers How to Use Load the EA once a single chart Type the maximum drawdown desired in inputs
Leave the EA alone and never close that chart The EA monitors all trades and magic numbers in your account.
Input Parameter Drawdown Percent: Maximum drawdown in percentage terms allowable in the account. When the drawdown level is surpassed, the EA will close all trades
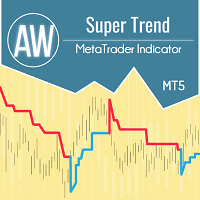
AW スーパー トレンド - これは、最も人気のある古典的なトレンド インジケーターの 1 つです。シンプルな設定で、トレンドだけでなく、このインジケーターによって計算されるストップロスレベルも表示できます。 利点:
楽器: 通貨ペア 、株、商品、指数、暗号通貨。 時間枠: М15 以上。 取引時間:24時間。 現在のトレンドの方向を示します。 ストップロスを計算します。 取引を行うときに使用できます。 3 種類の通知: プッシュ、メール、アラート。 MT4版 -> HERE / ニュース - HERE 機能:
インジケーターは、現在のトレンド方向を対応する色で表示します。
- 青色は、現在の時間枠で使用されているシンボルの上昇トレンドを示します。
- 線の赤い色は、選択したシンボルで使用された時間枠の下降トレンドを示します。
インディケータはストップロスを設定するために使用できます。
指標線はバーの上ではなく、バーに対していくらかシフトして表示されます。トレンド ラインが表示されるこの場所は、トレーダーがストップ ロスを設定するために使用できます。 ト
FREE

EA has a live track record with many months of stable trading with low drawdown: All Pairs 9 Pairs Night Hunter Pro is the advanced scalping system which utilizes smart entry/exit algorithms with sophisticated filtering methods to identify only the safest entry points during calm periods of the market. This system is focused on a long-term stable growth. It is a professional tool developed by me years ago that is constantly updated, incorporating all the latest innovations in the trading area.

The indicator identifies when a divergence occurs between price and an indicator or oscillator. It identifies both regular and hidden divergences. Combined with your own rules and techniques, this indicator will allow you to create (or enhance) your own powerful system. For higher probability setups I can recommend you to use my Supply Demand indicator and trade only if the divergence occurs inside a zone. Supply zone for bearish div and demand zone for bullish div. The optimal scenario is if it
FREE

この傾向により、価格の動きを予測し、取引の締結の主な方向を決定することができます。トレンドラインの構築は、トレーダーの取引スタイルに適したさまざまな方法を使用して可能です。 このインジケーターは、フォンミーゼス分布に基づいてトレンドの動きのパラメーターを計算します。この分布を使用すると、傾向方程式の安定した値を取得できます。トレンドの計算に加えて、上下の可能な偏差のレベルも計算されます。 インジケーターは、現在の価格値に従ってその値を更新します。彼の行動はビデオで示されています:
インジケーターパラメーター: iPeriod-トレンドとレベルの計算に使用されるバーの数 Shift-行を前方に続けるための小節の数 WidthTrend-トレンドラインの幅 WidthLvl-レベルの線の幅 StyleTrend-トレンドラインスタイル StyleLvl-レベルの線のスタイル ClrTrend-トレンドラインの色 ClrUp-レベルアップの線の色 ClrDown-レベルダウンの線の色

Cryptosecurency is a fully automatic trending trading advisor for cryptocurrency trading. The EA enters a trade at moments of increased volatility in the direction of momentum. The impulse is determined according to one of two algorithms: By the percentage change in the price for a certain time period or by the built-in indicators based on Bollinger bands. The ADX indicator can be used to measure the strength of a trend. Trades are closed by Stop Loss / Take Profit. It is not recommended to use
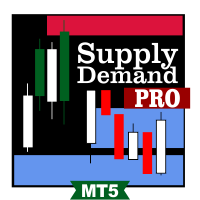
インジケータSupplyDemand RSJ PROは、グラフ上に「Supply」ゾーンと「Demand」ゾーンを計算してプロットし、ゾーンのタイプ(弱い、強い、検証済み、証明済み)を識別し、ゾーンの再テストの場合は、その回数を示します。 再テストされました。 「供給」ゾーンは、需要よりも供給が多く発生し、価格が下がる価格ゾーンです。 「需要」ゾーンは、供給よりも多くの需要が発生し、価格を押し上げる価格ゾーンです。
ゾーンの分類 弱い:再テストされた場合、違反される可能性が高い価格地域。 強い:トレンドの方向を変えており、すぐに再テストされる可能性が低い価格地域。 検証済み:価格が高い地域。最大で1〜3回の再テストがありましたが、価格が地域を破ることはできませんでした。 実証済み:3回以上の再テストがあったが、価格がこの地域を突破できなかった、価格の高い地域。 壊れた/ターンコート:壊れた価格領域。サポートの場合は抵抗になり、サポートの場合は抵抗になります。
設定 視覚的な設定: 弱いゾーンを表示:弱いゾーンとして分類されたゾーンが表示されます。 テストされていないゾーンを表示:テ

////////////////////////////////////////////////// //////////////////////////////// このインジケーターは、多項式回帰を使用して、それに応じて3つのチャネルと6つの線をプロットします。 最初のチャネルとその境界は大きな周期で、2番目は平均で、3番目は小さな周期です。 セットアップは簡単です。色を指定し、価格ラベルの表示を有効/無効にするだけです。 この指標の読みを理解することも非常に簡単です。 チャネルラインは、ストップロスを設定し、利益レベルを取得するために使用されます。 ストラテジーテスターにインジケーターの読み取り値が表示されない場合は、チャートウィンドウでズームアウトしてみてください。 ////////////////////////////////////////////////// ///////////////////////////////// この指標が取引の成功に非常に役立つことを願っています。 がんばろう。
//////////////////////////////////////////////// とても簡単です。設定はありません。 矢印の色とサイズのみを指定する必要があります。 この指標の読みを理解することも非常に簡単です。 上向き矢印は買いシグナルであり、下向き矢印は売りシグナルです。 ストラテジーテスターでテストしてみてください-あなたはそれを好きになるでしょう!!! ////////////////////////////////////////////////// ///////////////////////////////// この指標が取引の成功に非常に役立つことを願っています。 がんばろう。

FREE

An indicator for receiving a lot of signals Can be used in all time frames and all markets Trade professionally using professional indicators yourself . Using this indicator, you will have a signal at any time. Do not miss any market movement. Get the signal very simply and clearly.
----------------------------------------------------------------------------------------------------------------------------------------------------------------------------------------------------
How it work:
Thi
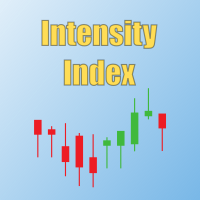
This new indicator allows you to know the intensity of the movements of a certain period. It is a powerful indicator with which it is easy to identify trend changes. It should be noted that this indicator is new and it is likely that nothing similar exists, it is also only available in MT. A high intensity indicates that during the established period the movement of the price in each bar has been of great amplitude, that is to say, that there is a great difference between the opening and closing

This Expert Advisor is a Combination of Averaging & Martingale.
1. Trend : to define what position the EA should Trade - LONG SHORT ( EA will open both BUY and Sell ) - LONG ONLY ( EA will only open BUY ) - SHORT ONLY ( EA will only open SELL ) 2. Distance between Each Positions - Point value of each Positions 100 : - if 100 Points reached between the last position and current price, new Position will be open by EA - EA will set up a higher volume for this new Position - new TP calculated us
FREE
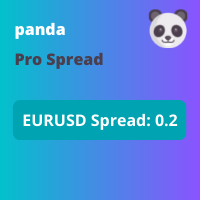
This indicator displays the spread with extra options Simple and easy to use and fully customisable: View as Pips or Pipettes Chart symbol can be hidden Text display can be changed Change colour and text styles Add or hide a decimal point Spacing options between inputs Default screen positions Screen position inputs
Pro version includes: Drag and drop box on the screen Add an alert when the spread is too high Alert colours for text and text box changeable
How to use 1. Simply use the default
FREE
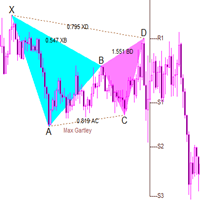
The full purchase discount is currently in progress! The best partner for any trader! This indicator is a classic butterfly indicator (harmonic trading). By default, it can identify 20 patterns and give prompts. You can also add custom shape parameters for custom prompts , prompting appropriate stop loss and profit levels. The built-in algorithm of this indicator is unique and is a unique band algorithm. Index characteristics Gartley pattern, also known as Gartley "222", was
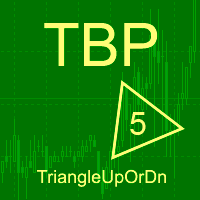
An indicator of patterns #47 and #48 ("Triangle, ascending" and "Triangle, descending") from Encyclopedia of Chart Patterns by Thomas N. Bulkowski.
Parameters: Alerts - show alert when an arrow appears Push - send a push notification when an arrow appears (requires configuration in the terminal) PeriodBars - indicator period K1 - an additional parameter that influences the accuracy of pattern shape recognition K2 - an additional parameter that influences the accuracy of pattern shape recognit

Monkey Springs EA is an expert advisor that analysis two moving averages difference (stretch) . It´s possible to trade on trend or reversal. It´s possible to configure each moving average and its difference value - stretch, as soon as a stochastic and OBV filter . Takeprofit and stoploss are configured according to a percent of the moving averages difference. A trail system can also be configured, according to moving averages and stochastic. It´s also possible to configure a average

Indicator works with two moving average, when this moving averages cross, then change of colors. You can change the color both moving average and chage all setup if you want, like a native moving average . If you want to put this indicator, all buffers are disponible and their are work fine. In case of doubt or any question don't exitate to write me, I'll read and aswer all the question.

Эксперт торгует по сигналам индикатора SystZ Trend Lines . Входные параметры: Take in atr, 0 - do not use a take profit - размер тейк профита по ATR (50) , рассчитанному на текущем таймфрейме. Если значение параметра равно 0, то не используется; Stop in atr, 0 - do not use a stop - размер стоп лосса. Если значение равно 0, то не используется; Risk factor, volume eq Equty*Risk factor/1000 - используется для расчета размера рабочего лота, который вычисляется как Эквити*Risk factor/1000. Нап
FREE

Sends price alerts conveniently to your Android/IOS device. Make sure push notifications are enabled in Metatrader settings and the PC/VPS is online 24/7. Price levels are updated automatically, but you can modify them in global variables, if needed. Suitable for any market instrument, but if notifications are too frequent, increase point value of the indicator parameter.
FREE
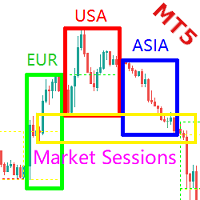
简介 本产品是迈达量化全系列产品中的一款显示交易时段及财经日历的系统,它是一款完美的工具,可将您的图表屏幕划分为3个主要市场时段。 借助 Market Sessions ,您可以看到确切时间发生了什么事件,及对应的K线波动幅度,不再盲目地分析图表,并为自己制定更有利的交易策略。 它将市场分成亚洲、欧洲、美洲等,通过 Market Sessions ,您可以立即了解自己所处的时间范围以及整个市场情况。它将对您的分析和交易产生积极影响。 设计原理 亚洲,欧洲,美洲分布地球的三个不同板块,由于地理位置的差异,生活习惯及投资思维都不同,所以如此划分。 市场交易的主要交易都是集中再每个时段开盘时间之后的一段时间,或者是重要财经日历发布的时间。 每天都是这三个时段的自己相互的博弈,对于研究以博弈为交易理念的投资者有参考价值。 Market Sessions的优点 不用翻看财经日历,节省分析时间 财经日历直接标注再图表上,直观显示财经日历对图表的影响 辅助学习博弈的交易策略 三个时段辅助寻找市场的拐点,寻找市场基本面波动的范围 如何设置 Show Continent Sessions - 显示洲交易

With my custom built formula, you can visualize the market similar to displaying a heat map; with color showing at a glance the strength of the current trend, and the bar length showing the intensity of current movement. In more detail: Length of the histogram bar shows the average bar size of the last period, and color (from red to blue) shows the strength of upward or downward movement. Purple zones can indicate a change into a new trend. Bar period is adjustable so as to measure larger or sm

NEW PROMO: Only a few copies copies available at 349$ Next price: 449$ Make sure to check out our " Ultimate EA combo package " in our promo blog ! Gecko runs a simple, yet very effective, proven strategy. It looks for important recent support and resistance levels and will trade the breakouts. This is a "real" trading system, which means it will use a SL to protect the account. It also means it will not use any dangerous techniques like martingale, grid or averaging down. The EA shows its
All words I spent time to describe this EA trading system does not worth a download that you can do to test this expert advisor.
MC Datrix EA is a trading system that combines trend filter, trigger points with specific conditions, smart takeprofit and stoploss calculations, a break orders system based on smart reversal trend.
Trend filter was developed with TRIX indicator and also can be enabled or not.
Trigger points were specially projected with MACD indicators values and signals. Trigger

" A successful trading means being able to master the art of timing, the art of execution and the art of protecting your capital in a very simple and faster way ". HermanGhost Manager is the most powerful tool that's actually designed to help you win in terms of executing different operations BUY,BUY STOP, BUY LIMIT, SELL,SELL STOP, SELL LIMIT, STOP LOSS, TAKE PROFIT, BREAKEVEN, TRAILING STOPS, all can be executed in seconds.
features : The intuitive interface One time configuration One click
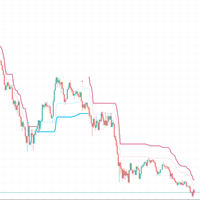
Using ATR to judge the trend, the dotted line is a short-term trend, and the solid line is a stable trend
Set different parameters according to different products. In most cases, please use the default parameters
Time cycle 5 minutes 15 minutes 1 hour
This indicator performs well in monetary products and gold
Index without future function
The entity part of the K line exceeds the entity trend part, which represents the trend conversion. Please wait for the K line to finish

市場はラウンド数を非常に好み、下落市場ではサポートとして機能し、価格が上昇するとレジスタンスとして機能することがよくあります。 この指標は、ラウンド値で価格レベルを描画するように設計されています。これは自動的に行われますが、それをオーバーライドして表示するレベルを決定するオプションもあります。 ラウンド レベルは、10、20、30 などの 10 のステップと同じくらい単純にすることができます。また、外国為替を使用している場合は、0.1 または 0.01 での変化を見たいと思うかもしれません。 インジケーターは、メジャーとマイナーの 2 つのクラスの線をそれぞれ異なる形式で描画します。これにより、レベルの 2 つの異なる変化の間の変化を同時に見ることができます。 アラート
このインジケーターには、価格が設定可能な距離内にある場合に、メジャー、マイナー、または両方の価格レベルでアラートを鳴らす機能が含まれています。 自動セットアップ デフォルトでは、指標はメジャー価格とマイナー価格の両方の適切なレベルを決定します。これは、いつでも画面に表示する行数を制御する構成可能な DensityInd
Aggression Wave PRO is an indicator developed to monitor the divergence, strength, and continuity of the aggression volume of sell and buy negotiations. The Agrression Wave PRO has features that allow you to view beyond the accumulated delta volume of the day.
Note: This indicator DOES NOT WORK for Brokers and/or Markets WITHOUT the type of aggression (BUY or SELL). Cryptocurrencies and Forex do not provide this type of information, that is, it does not work with it.
Operation
It is possib

This scalper helper helps you manage your trader by placing AUTOMATIC stops and takes. When you enter a position and the market quickly turns against you, it's pretty boring isn't it? but with this helper your StopsLoss and TakeProfit will be AUTOMATIC, just configure how many pips you want and that's it. Besides, the helper has AUTOMATIC BreakEven, you just choose the amount of pips you want to place, and finally it contains a stop protector, whenever a candle closes in profit in your favor, it

ScalpJumping July 50% OFF Hey, haven't you tried it yet? What are you waiting for???? Try yoursef. It is a buy scalper robot with a recommended risk of 6%.This is not magic, it works well in a bullish context. you can do a back test yourself and check its operation. It is a multi-currency robot although it was tested with greater success on the EURUSD pair. Recommendations: currency EURUSD, timeframe 5M, Stop Loss 60, Take Proffit 60, Trailing Stop 0, Dynamic Lots true although you can tes

Two Factor Customizer is an fully custimizable Expert Advisor. You can choose multiple parameters that act as a trigger to execute a buy or sell order. Additionally you can choose a previous step (Two Factor), where you can also combine multiple parameters previous to those configured for the buy and sell orders. The parameters available to configure to your liking are: lots, stop loss, take profit, dynamic lots, order type,timeframe. Indicator combinations for triggering orders and for precondi

The Donchian Channel Channels are among the most popular tools of technical analysis, as they visually convey to the analyst the limits within which most price movement tends to occur. Channel users know that valuable information can be obtained at any time, whether prices are in the central region of a band or close to one of the border lines.
One of the best known techniques to explore these concepts is Bollinger Bands. However, John Bollinger was not the only one to research the application
FREE

Convenient drawing of parabolic channels by four points (two lower and two upper extremums). Additional control keys: N (New) - Start drawing a new channel. C (Clear) - Deletes the current channel. By default, the current channel is the last channel. But you can click on the line of any channel to make it current. Click on the gear in the upper right corner to set some parameters for all channels or the current channel. All work is visible from the animated Gif.
Do not forget to express your w
FREE

The indicator draws the daily open line. Parameters
GMT shift (minutes) The time zone could be shifted. The value is given in minutes. Draw closest regular bar's open price This parameter could fine-tune the open price line when using GMT shift. Yes - Draw the open line based on the current chart period's closest regular bar No - Draw the open line based on the M1 chart's closest bar. Let's assume that your shift is 10 minutes, and you are using H1 chart and the first candle in every day is 0
FREE
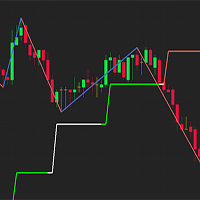
Simple indicator used in technical strategies to analyze tops, bottoms and reversal or continuation points. Developer information:
Line values and colors:
Buffer 0 : ZigZag line value;
Buffer 1 : ZigZag color value;
Buffer 2 : Median line value;
Buffer 3 : Median color value; Buffer to get the values of each top and bottom. Buffer 4 : Top value;
Buffer 5 : Bottoms value;
Buffer that returns the type of the last direction.
Buffer 9: 0 = Not updated, 1 = High, -1 = Low;
This indic
FREE

Ilon Clustering is an improved Ilon Classic robot, you need to read the description for the Ilon Classic bot and all statements will be true for this expert as well. This description provides general provisions and differences from the previous design.
General Provisions. The main goal of the bot is to save your deposit! A deposit of $ 10,000 is recommended for the bot to work and the work will be carried out with drawdowns of no more than a few percent. When working into the future, it can gr

Hello!
Tired of constantly subscribing to other people's signals and earning pennies?
Want to manage your own trading?
Then you are on the right page!
It's very simple ==> buy my indicator ==> put it on the chart ==> blue arrow - buy ==> red arrow - sell. Even an infant can do it!
A handy histogram to trace the market direction.
Are you still here? Then read the parameter descriptions and take a look at the screenshots: Stoch K period - period for calculating the% K oscillator line. Stoch
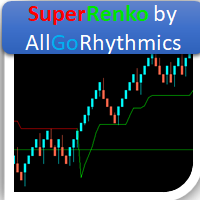
This indicator creates the perfect RENKO for you to work with timeless types of Candles! Due to RENKO characteristics of timeless, the indicator adjusts trading arrows (otherwise they would be lost) and leaves them exactly where the negotiation occurred in Renko Candles! In addition, this indicator shows exactly the division between days, in order to make it clear to user where each trading session started and ended! Furthermore, the following indicators were added, giving you bigger analysis p
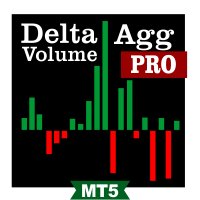
Delta Aggression Volume PRO is an indicator developed to monitor the strength and continuity of the aggression volume of sell and buy negotiations. Note: This indicator DOES NOT WORK for Brokers and/or Markets WITHOUT the type of aggression (BUY or SELL). Cryptocurrencies and Forex do not provide this type of data, that is, it does not work with them.
O Delta Agrression Volume PRO has features that allow you to view beyond the delta volume of the day.
Operation
Multi symbols (those who provid
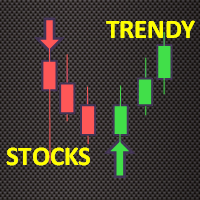
Trendy Stock is a price following indicator that uses Stochastic to show when the price is out of the oversold or overbought areas. The algorithm allows you to stay longer in a trend where the bulls or bears are in control. The indicator changes color immediately the price exits oversold/overbought state. In short, the downtrend [red] bars start to paint when the buying pressure decreases while the uptrend [green] bars form as the buy pressure kicks in. For MT4 version, follow :: https://www
FREE

Tom DeMark developed TD Sequential by hand, through a process of trial and error, in the 1970s. It never ceases to amaze me how something originally created to analyze daily price data can be applied so effectively, more than thirty years later, to any time frame—from one minute to one year—and to any market. The indicator has two components: TD Setup, which relies on momentum to define price ranges, and TD Countdown, which is trend based, and looks for low-risk opportunities to fade establishe
MetaTraderマーケットはトレーダーのための自動売買ロボットやテクニカル指標を備えており、 ターミナルから直接利用することができます。
MQL5.community支払いシステムはMetaTraderサービス上のトランザクションのためにMQL5.comサイトに登録したすべてのユーザーに利用可能です。WebMoney、PayPal または銀行カードを使っての入金や出金が可能です。

取引の機会を逃しています。
- 無料取引アプリ
- 8千を超えるシグナルをコピー
- 金融ニュースで金融マーケットを探索