 MetaTrader 5
 エキスパート
 インディケータ
 ライブラリ
ライブラリ ユーティリティ
 ウィジェット
 ルール
ルール
YouTubeにあるマーケットチュートリアルビデオをご覧ください
ロボットや指標を購入する
仮想ホスティングで
EAを実行
EAを実行
ロボットや指標を購入前にテストする
マーケットで収入を得る
販売のためにプロダクトをプレゼンテーションする方法
MetaTrader 5のための新しいエキスパートアドバイザーとインディケータ - 390
 自動売買ロボットとインジケータを使用して、外国為替取引の収益性を高めます。 自動売買ロボットを使用すると、取引の開始と終了を自動化でき、インジケータは市場の行動をより正確に予測するのに役立ちます。
このページには、MetaTrader5アプリケーションのカタログが掲載されています。
自動売買ロボットとインジケータを使用して、外国為替取引の収益性を高めます。 自動売買ロボットを使用すると、取引の開始と終了を自動化でき、インジケータは市場の行動をより正確に予測するのに役立ちます。
このページには、MetaTrader5アプリケーションのカタログが掲載されています。 
Demand and supply zones Support and Resistance areas Show broken zones Show tested and untested zones Show weak zones Fractal factors Notifications when price reaches point of Interest with Push notifications and pop ups Customizable History Clickable Works on all Timeframes Works on all pairs.
Free for a while till further notice and changes. The demand and supply bot coming soon
FREE

This is an EA that is suitable for those of you who want to explore the power of the Moving Average indicator. We created this application to show the advantages of the Moving Average.
MA Period and MA Shift settings are available, so the user can adjust the EA's performance by himself, to suit his needs. The recommended TFs are M1 and M5. Recommended assets are XAU (gold) and GBP.
Because MT5 no longer provides options for Buy_only or Sell_only, we provide the facility to set these trading o
FREE

It's a triangular arbitrage system (three pairs correlation system) to use 3 currencies to make 3 pairs to open hedge orders on those.
The expert starts opening six orders for each ring (3 plus and 3 minus) and waits to move prices in one direction to make a grid of orders.
The expert can use a maximum of 8 currencies to make 28 pairs and make 56 rings.
It is important the order of currencies is from the strongest to the weakest.
Strongest... EUR/GBP/AUD/NZD/USD/CAD/CHF/JPY ...weakest.
Can
FREE

1. The Expert Adviser is built with a basic, simple and stable breakout trading strategy with a touch of Price Action pattern that is highly effective with over 80% accurate entry on Scalping and Trend following trading pattern. 2. The EA created a good money management system with a low draw down and options for Number of Trades, Auto SL and Auto trade trailing.... 3. The EA has option to select trade direction (BUY ONLY, SELL ONLY OR BUY & SELL). 4. The EA has option to set TP in Pips or Mone
FREE

3 Moving averages crossover , with customizable Notifications and pop ups. Comment for any ideas. Its a demo version , could use some work, hope you at least find it useful. Hit me up with anything or any ideas you feel might be helpful and i will try and add them in if i get the time. Thank you. This version is free as of now . I can't promise anything about the future. But enjoy and have fun. Truly PVRPLE BLVCK. PS don't forget to share and like.
FREE
The Forex grid trading strategy is a technique that seeks to make a profit on the natural movement of the market. The robot is designed to trade on GBPUSD, but can also trade on other pairs. EA has the advantage of simplicity and a unique position enhancer. What is important. Positions are opened at the close of the candle.
Input parameters: Start Trend in pips. Comment; Max Spread (Digits 5) Slippage Magic Number Stop Loss Take Profit (first position) Average Take Profit PipsStep for gri

Всем привет. Представляю Вашему вниманию Индикатор TRUE ATR. Так же есть данный индикатор для mt4 https://www.mql5.com/ru/market/product/82414 Данный индикатор работает на всех рынках. TRUE ATR высчитывает среднестатистическое движение инструмента за 1 день и показывает сколько в инструменте осталось энергии внутри дня. В отличие от классического индикатора АТР которые без разбора учитывает все бары(свечи), TRUE ATR при расчете среднестатистического движения инструмента использует ближайших 5

Gold Crazy EA is an Expert Advisor designed specifically for trading Gold H1/ EU M15. It use some indicators to find the good Entry. And you can set SL or you can DCA if you want. It can be an Scalping or an Grid/ Martingale depend yours setting. This EA can Auto lot by Balance, set risk per trade. You also can set TP/ SL for earch trade or for basket of trade. - RSI_PERIOD - if = -1, then the default strategy works, if >0, then the RSI strategy works - MAX_ORDERS - to trade with only 1 order,

Advanced Bollinger Bands Scanner is a multi symbol multi timeframe Bollinger bands dashboard that monitors and analyzes the Bollinger Bands indicator from one chart. This panel scans the Bollinger bands indicator in up to 28 configurable instruments and 9 timeframes for price overbought/oversold, price consolidation (Bollinger bands squeeze), and consolidation breakout (squeeze break) with a deep scan feature to scan all market watch symbols (up to 1000 instruments!).
Download Demo here (

HiLo B3 Trader é o robô de negociação automatizada para a bolsa brasileira B3, para ativos miniíndice WIN, minidólar WDO e também ativos como milho (CCM). O robô opera calculando o indicador HiLo e emitindo ordens de acordo com a tendência. Além da configuração do período do HiLo, pode-se configurar filtros de tendência, bem como ajustar o takeprofit e stoploss para fixos ou dinâmicos com o indicador ATR. Ativos recomendados: WIN, WDO, CCM. Timeframes: M10. Atenção: alterar o parâmetro BR1 para
As you know, the logarithmic chart is essential for any Technical approach. This Expert Advisor create a customize symbol for any symbol you want and it plot logarithmic chart for that. You can easily switch between logarithmic and arithmetic charts. the Expert provide crosshair for last and actual price and you can add your personal LOGO to chart. also you can set individual zoom for each Time Frame. Important: The Expert Advisor doesn't work on Demo version. because Demo version work only on S
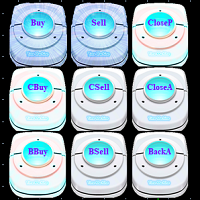
1.システム概要 それは3次元の便利な取引と信号指示ボタンであり、機能は以下を含む:買う、売る、平損倉、平利益倉、平倉を買う(1/5~1倉位を選択可能)、平倉を売る(1/5~1倉位を選択可能)、倉をきれいにする(すべての物体、すべての倉とすべての注文をクリアする)、逆手を買う(1~5倍逆手を選択可能)、逆手を売る(1~5倍逆手を選択可能)、すべて逆手(1~5倍逆手を選択可能)、3次元ボタンの点滅によって、現在のアカウントの単一品種とすべての品種の利益信号を提供することもできます。
2.システム設定 2.1 lot:倉庫を購入または売却する 2.2 cbuytimes:平倉倍数を買う 2.3 cselltimes:平倉倍数を売る 2.4 bbuytimes:バックハンド倍数の購入 2.5 bselltimes:販売バックハンド倍数 2.6 backatimes:すべての倉庫位置のバックハンド倍数 2.7 closepl:すべての利益、損失倉庫を平らにすることを選択する; 2.8 buttonstyle:ボタンスタイル。 2.9 buttonsize:ボタンサイズスタイル。 2.10
FREE

カスタムオシレータを使用して価格の反転を予測し、短期的な市場の変動を取引する完全に自動化された高度なツール。プラグ可能な自動ロット計算、組み込みのオーバーラップ回復アルゴリズム、注文間の調整可能なステップ戦略。 MT4版→ こちら / 問題解決→ こちら 利点: 手動注文を追加できる自動システム 固定および調整可能なダイナミック ピッチ 調整可能なオーバーラップ回復アルゴリズム 一方向または双方向で取引する能力 反対方向に移動するときに平均化を使用します プラグイン可能な自動ボリューム計算 あらゆる種類の通知を送信する組み込み機能 入力パラメータ: 主な設定 Size_of_the_first_order - 最初のオーダーのサイズを定義する変数
Enable_Autolot_calculation - この機能を使用すると、預金を変更するときにリスク設定を保存できます
Autolot_deposit_per_0.01_lots - オートロット使用時の0.01ロットあたりの入金額
Maximum_size_of_orders - ロット単位で測定された、1 つの注文の最大ボ

Bollinger bands out/in strategy A strategy created by Joe Ross, and very useful for finding trades when the market is overloaded. Indicator You don't need to find where there are entries on the chart, this indicator shows them for you. The entrance The trade is confirmed when the price closes outside the bollinger bands on a candle and the candle after the price closes inside the bands. comment I want to improve this indicator, so you can help me sending me your reviews and comments, thanks :).
FREE

LT HiLo Activator は、著名なトレーダー Robert Krausz 氏によって考案された定評あるトレンド追跡手法を、あなたのチャート上に表示します。大きな値動きを捉え、市場トレンドに逆らった取引を避けるための重要なテクニカルツールです。 実用的で客観的、そして直感的に読み取れる HiLo は、方向性を持つサポート/レジスタンスの「階段」のように機能し、エントリー、エグジット、資金保護のポイントをより簡単に判断できるようにします。
実践での活用方法 上昇トレンド(動的サポート): インジケーターのラインはローソク足の下に描画され、買いポジションの Stop Loss を配置・トレーリングするための優れたテクニカルゾーンとして機能します。 下降トレンド(動的レジスタンス): インジケーターは価格の上に描画され、相場の弱さを示し、売りポジションの保護に役立ちます。 サイクル反転: 価格が HiLo ラインを超えて終値を付けると、インジケーターは反対側へ「反転」し、新たなトレンドが始まる可能性を示します。
インジケーターの主な機能 明確でシンプルな
FREE

チャート上に超簡単に線を引いたり、移動したりできるツールです。
クリックしてから、ドラッグするとトレンドラインが引けます。 横に引くと価格線、縦に引くと日付線になります。 そこにある線やオブジェクトで、クリック&ドラッグすると移動できます。
クリックしたところから、ドラッグしたところに交差線が引かれ、間の時間と価格の差が表示されます。
クリック&ドラッグしたら、左右に振ると色が変わります。 クリック&ドラッグしたら、上下に振ると削除します。
クリック&ドラッグとは? 1.マウスの左ボタンを押す(カ) 2.マウスの左ボタンを放す(チ) 3.マウスの左ボタンを押す(カ) 4.左ボタンを押したまま、マウスを移動する(ツー)
この動きをすることでトレンドラインを引いたり、オブジェクトを移動したり、色を変えたり、消したりできます。
トレンドライン、価格ライン、日付ラインだけでなく、矢印や価格表示、フィボナッチ、ギャンライン、サイクルライン、図形なども移動させることができます。
他にも便利なところ
・うっかり線を引いてしまったら、チャート外でマウスボタンを離せば、線が消えます
FREE
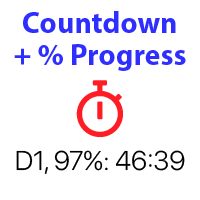
バー閉店までのカウントダウンタイマー、+ 進捗状況 %: #1 多機能ユーティリティ : 66+ 機能を含むこのツール | 質問があればご連絡ください | MT4 バージョン インジケーターの設定で、以下を構成できます: 計算用の時間枠; true / false: 高位時間枠オプション(現在使用中の次のもの:M15->M30、H4->D1...) 位置:
1 = 左下隅;
2 = 右下隅;
3 = 左上隅;
4 = 右上隅; フォントサイズ; 色; フォントスタイル; #1 多機能ユーティリティ : 66+ 機能を含むこのツール | 質問があればご連絡ください | MT4 バージョン #1 多機能ユーティリティ : 66+ 機能を含むこのツール | 質問があればご連絡ください | MT4 バージョン
FREE
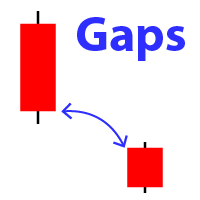
チャート上のギャップの表示 (前のバーの終値が新しいバーの始値と異なる場合)。 #1 多機能ユーティリティ: 66+ 機能、このインジケーターを含む | 質問がある場合は連絡してください | MT4 バージョン 初期設定で 以下を設定できます: ギャップサイズ : この値を超えるギャップが表示されます。 サイズタイプ: ピップ / ポイント / %; 矢印の色 : 上昇ギャップと下降ギャップで別々。 ターミナル / メール / プッシュ通知 チャート上のギャップ矢印にマウスを乗せると、 そのサイズが表示されます ; 異なる時間枠と通貨ペアに適したギャップサイズを選択することをお勧めします。 #1 多機能ユーティリティ: 66+ 機能、このインジケーターを含む | 質問がある場合は連絡してください | MT4 バージョン

Investopedia FIVEEAはこの記事に基づいています:
https://www.investopedia.com/articles/forex/08/five-minute-momo.asp
取引条件
-X期間のEMAとMACDの下で取引されている通貨ペアがマイナスの領域にあることを確認します。 -価格がX期間のEMAを超えるのを待ってから、MACDがネガティブからポジティブにクロスする過程にあるか、5バー以内でポジティブな領域にクロスしたことを確認します。 -X期間EMAの上に長いXピップを移動します。 -エントリー時のポジションのXとリスク額を売ります。後半のストップを損益分岐点に移動します。 -トレーリングストップを使用
-リスク警告 -ADX PROを購入する前に、関連するリスクに注意してください。 -過去のパフォーマンスは将来の収益性を保証するものではありません(EAも損失を出す可能性があります)。 -示されているバックテスト(スクリーンショットなど)は、最適なパラメーターを見つけるために高度に最適化されていますが、結果をライブ取引に転送すること
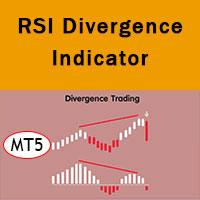
RSI divergence indicator finds divergences between price chart and RSI indicator and informs you with alerts (popup, mobile notification or email). Its main use is to find trend reversals in the chart. Always use the divergence indicators with other technical assets like support resistance zones, candlestick patterns and price action to have a higher possibility to find trend reversals. Three confirmation type for RSI divergences: RSI line cross 50 level Price returns to previous H/L C
FREE
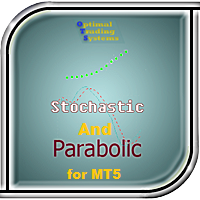
This Expert Advisor works on the signals of the Parabolic indicator, while analyzing the readings of other indicators, especially Stochastic. Sets pending orders, as a rule, they are triggered when a local trend reversal occurs. If the trading conditions become unsuitable, it can delete pending orders. It has many settings, the stop loss can also move along the parabolic with other parameters.
Recommended timeframes: M5, M15, M30, H1. Before trading, optimize the EA parameters for your account
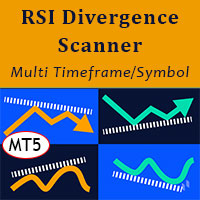
RSI Divergence Scanner is a multi-timeframe and multi-symbol dashboard and alert that checks all timeframes and symbols to find regular and hidden divergences between price chart and RSI indicator. This divergence scanner is integrated with support and resistance zones so you can check the RSI divergences in the most important areas of the chart to find trend reversals in price chart. Download demo version (works on M4,M6,M12,M20,H3,H8 timeframes of 20 symbols of Market Watch window) Full desc
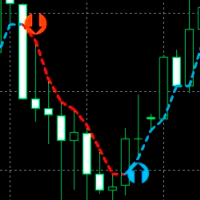
すべての時間枠とすべての通貨ペアの価格反転ポイントを正確に決定するための指標。市場の技術分析と数学的診断モデルの助けを借りて、この指標は価格の逆転点と現在の傾向の方向を非常に効率的に決定します。インジケーターは、この情報を矢印と線の形でチャートに表示します。矢印はトレンド反転ポイントを示し、線は現在のトレンド方向を示します。
この指標は、既存の取引戦略に統合することができ、スキャルピングまたは長期投資のための新しい取引戦略を構築するためにも使用できます。このインジケーターで頭皮を剥ぎ、日中に注文を開始する場合は、M5-M15の時間枠を使用し、インジケーターがチャートに矢印を描くときに取引を開始することをお勧めします。長期投資の場合は、H1、H4、D1の時間枠で取引することをお勧めします。この場合、インジケーターが引く線の方向にトレードする方が良いです。
インジケーターの利点: 値を再描画しません。 すべての時間枠で取引されます。 すべての通貨ペアで取引されます。 スキャルピングまたは長期取引に使用できます。 セットアップはとても簡単です。 インジケーター設定: Indicator

Taking into account the difference in trading sessions, the indicator shows the trend direction and the resistance level. All events are marked on the chart and alerts are sent. Using SessionAlert, you can trade calmly, steadily. You just need to specify the start and end time of the sessions. The indicator displays the resistance level, the arrow indicates the trend change event and additionally marks the price touching the resistance level. The principle of operation of the indicator is very s
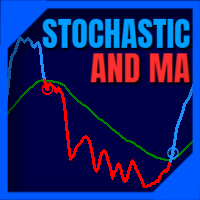
Using the Stochastic Oscillator with a Moving Average is a simple but very efficient strategy to predict a trend reversal or continuation.
The indicator automatically merges both indicators into one. It also gives you visual and sound alerts.
It is ready to be used with our programmable EA, Sandbox, which you can find below: Our programmable EA: https://www.mql5.com/en/market/product/76714 Enjoy the indicator!
This is a free indicator, but it took hours to develop. If you want to pay me a coff
FREE

EL BBot Aliens 100 DouKang se basa en cálculos matemáticos en función del precio especialmente tratando de disminuir los riesgos de las subidas y bajadas extremas, utiliza dos entradas opuestas y si el precio sube se fortalece con mas entradas y si baja también se fortalece con mas entradas, (ver video). Se recomienda usar el test para determinar el deposito mínimo para cada par, en el caso del oro con el dolar es de 3mil (ver video). Si aumenta la distancia=1,,, disminuye el riesgo, (distancia

Informações Importantes sobre o Brazil Index Bot (BACKTEST VISUAL desativado para proteger parte da Estratégia.)
Se você está procurando um robô que cumpre aquilo que promete, você acabou de encontrar! O Brazil Index Bot irá superar todas as suas expectativas com certeza! E o melhor de tudo, é só colocar na sua conta, ligar e já começar a lucrar! Deseja conhecer mais sobre o Brazil Index Bot e seus resultados? Baixe agora os relatórios detalhados em: https://bit.ly/INFOSBRAZILINDEXBOT (Utilize e

Informações Importantes sobre o Bra50 Index Bot (BACKTEST VISUAL desativado para proteger parte da Estratégia.)
Se você está procurando um robô que cumpre aquilo que promete, você acabou de encontrar! O Brazil Index Bot irá superar todas as suas expectativas com certeza! E o melhor de tudo, é só colocar na sua conta, ligar e já começar a lucrar! Deseja conhecer mais sobre o Bra50 Index Bot e seus resultados? Baixe agora os relatórios detalhados em: https://bit.ly/INFOSBRAZILINDEXBOT (Utilize es

Second To NoneFX Spike Catcher EA V1.1 Use This spike Catcher everyday or let it run on VPS, make profit and withdraw everyday. Very Cheap and accurate Spike Catcher... AFFORDABLE!!!
2nd To NoneFX Spike Catcher EA V1.1 -----> NEW FEATURE Multiply on loss to cover previous loss. This Robot is Also Developed To milk the BOOM and CRASH indices . It works On all Boom and Crash pairs (boom 300, 500, 1000 & Crash 300, 500, 1000) I would Highly recommend that you use this Robot to Catch spikes

Displays a digital clock or a countdown (until new bar) in the chart in realtime.
Benefits: Current time always in sight for market open/close, economic data, etc. Displays accurate time (server/broker time) Keep an eye on how much time is left until a new bar starts (countdown) Clearly visible (set color, size, font, position) Always runs/refreshes every second even without new price tick Hint: To display the most accurate time, use the server (broker) clock setting combined with the time (hou
FREE
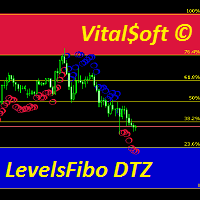
The combined Levels Ib DTZ indicator helps to determine the trend direction when trading. Displaying signals on the chart about a possible upcoming trend change. The indicator is a combination of Fibonacci levels with overbought and oversold zones and a trend indicator based on ZigZag and ATR indicators. The Levels Ib DTZ indicator helps traders predict future price movements and adjust their strategy accordingly. It works on all timeframes.
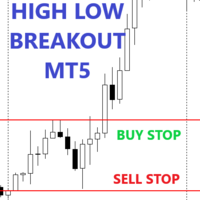
This expert advisor will make a pending order at a certain time, pending orders are made in the form of buying at the highest price and selling at the lowest price (in a predetermined time frame) you can make a pending order breakout at the highest and lowest prices according to your wishes, thus it can be used for the following strategies: - Asian Session BreakOut - European Session BreakOut - US Session Breakout - News Trading - Etc.
Main parameter description Notes : order type 4 is not part
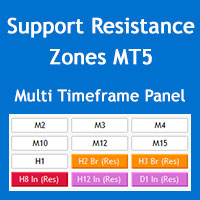
Support and Resistance zones indicator for MT5 is a multi-timeframe panel and alert that finds support and resistance zones and pivot points for all timeframes of MetaTrader 5 and gives alert when price has interaction with them. Download demo version (works on GBPUSD, EURJPY and NZDUSD symbols) Read the full description of scanner parameters in the blog page . Many unique features in one indicator: Integrating support and resistance zones and pivot points in one indicator with powerful filterin
Support and Resistance Dashboard for MT5 is a multi-timeframe and multi-symbol scanner and alert system that finds S/R zones and pivot points for all timeframes and symbols and alerts when price has interaction with them. If you are using support and resistance (or supply and demand) zones in your trading strategy, this dashboard and its alert and filtering system is a big time saver for you. Download demo version (works on M4,M5,M6,M12,H3,H8 timeframes) Full description of scanner parameters

This EA uses two moving averages one slow and one fast, when ever they cross it checks if the RSI value is greater or lesser than 50 depending on the signal given by the Moving averages. After that it checks if the Stochastics lines are going up or down and not in the Over Bought or Over sold zone. so in total it uses an RSI, 2 Moving Averages ,Stochastics and an ATR to try to evade stop hunting.Also has a trailing function to hold the profits if price moves X pips tested on a 5 min time frame
FREE
The idea of this trading system from the EMA with a Mediante price from the EMA indicators is based exactly 100% from Ripster47 trading system, me is just the person to create it on the MT5 platform, but with alerts for your own buy/sell settings. Hereby I make a copy from Ripster47 explanation for using that system: " EMA Cloud By Ripster
EMA Cloud System is a Trading System Invented by Ripster where areas are shaded between two desired EMAs. The concept implies the EMA cloud area serv
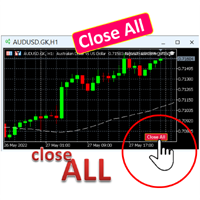
A simple button to completely close all existing open trades (both Buy and Sell) on the current chart .
Warning : Once the button is pressed, all open trades on the current chart will be deleted immediately without any more questions or dialogue.
Use this utility very carefully. We recommend that you do a trial of removing open trades on a demo account first, before trying to use this utility on a real account.
FREE
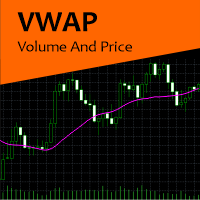
VWAP Volume And Price is the indicator for Volume Weighted Average Price, designed according to regular calculation. The average price is calculated using typical price - (high + low + close) / 3 - and weighted by volume for each candle. So, the indicator can be used to trend trades, balanced with volume. Try other products and expert advisors too. Any doubt, PM.

Supimpa B3 Trader é o robô de negociação automatizada para a bolsa brasileira B3, para os ativos miniíndice WIN e minidólar WDO. A estratégia de negociação é baseada na média VWAP - Volume Weighted Average Price - que utiliza uma média ponderada dos preços em relação ao volume de negociação em cada vela. O robô é de configuração simples, com entrada do valor do período da média de análise e do takeprofit e stoploss fixos. Além disso, pode-se configurar também o número de contratos, configuração

GBP Scalper 03 is a simple EA that can work automatically to carry out trading activities. Like the previous version (GBP Scalper 01 & GBP Scalper 02 (MT4 platform)), this EA is kept simple and only requires Lot, TP, and SL settings to use.
And because of the absence of the Buy_only and Sell_only options on the MT5 platform, an option is added to manage the activation of Buy Trade or Sell Trade
As the name implies, this EA is only suitable for trading with the GBPUSD pair, and is design

Торговая стратегия. Советник применяет в торговле 4 трендово-сеточные стратегии с различными параметрами. Тем самым обеспечивается распределение рисков по торговым объемам в рынке. Авторская система определения тренда и учет волатильности торгуемой пары позволяют автоматически подстраиваться советнику под настроения рынка. Используется автоматическая фиксация убытка при достижении заданной в настройках просадки. Доступно широкое количество фильтров сигналов, которые позволяют минимизировать л

British stuff The Expert Advisor tool has been developed for GBPJPY 1H based on SMA 200 and pending orders. It has been backtested on more than 18-year long tick data with 99% quality of modeling. The enclosed screenshots demonstrate the complexity. A broker with a small spread and slippage is recommended for better performance. There is no need to set up any parameters, except Magic number and Friday exit time, lot size . All other settings are already optimized and fine-tuned. Strategy worki

Camaleão Bands B3 Trader é o robô de negociação automatizado para a bolsa Brasileira B3, tanto para trade em miniínidice WIN, quanto para trade em minidólar WDO. O robô usa as Bandas de Bollinger para análise de ordens de entradas, permitindo trades a favor ou contra a tendência, dependendo da volatilidade das bandas, afinal, quando as bandas estão estreitas, é mais provável que o mercado fique lateral, realizando mais trades contra a tendência. Porém, quando o mercado explode, as bandas se alar

説明。 この製品は、プロジェクト「 PULSE_OF_MARKET 」の一部として作成されました。
EA「UndefeatedTriangle」は、AUD、CAD、NZD通貨間の独自の変動を利用する高度なシステムです。歴史的な結果は、構成で使用されるこれらのペアは、一方向への高速移動後に常に最初に移動したペアに戻ることを示しています。この観察により、これらの固有の状況の最大点を取得できるグリッドマーチンゲールシステムを含めることができます。
EA「UndefeatedTriangle」は、AUDCAD、AUDNZD、NZDCADの3つのペアのみを使用します。 MT4 version
利点。
実際のアカウントの監視。 同様の選択肢よりもはるかに安価です。 1米ドルでもミニアカウントで操作できます。 複雑な針のパラメーターはありません。 使いやすい。
パラメーター。
Short Name (In Comment Section) –コメントセクションのジャーナルまたはアカウント履歴に表示されます。 Print Logs On Chart -オン/オフ情報パネル; Display O
このインジケーターは、最適なテイクプロフィットとストップロスのレベルを表示します。これらのレベルは、履歴データに基づいて計算されます。最初の開始時に、インジケーターは履歴についてトレーニングされます。その後、彼は価格が将来このレベルまたはそのレベルを超える可能性を評価し、ストップオーダーを出すための最適なオプションを選択します。たとえば、利益が最大になり、価格がそのレベルに達する確率が可能な限り高くなるように、利益値を選択します。ストップロスレベルは最小限である必要がありますが、それに達する可能性は最小限である必要があります。これにより、勝つための数学的な期待値が可能な限り高いレベルになります。 また、このインジケーターは、サポートレベルとレジスタンスレベルの形で使用できます。これを行うには、さまざまな予測の長さとオフセットを組み合わせることができます。 インジケーターパラメーター: 長さ-予測の長さ。このパラメータは、バーの将来の取引の予想期間を示します。 Shift-バーをシフトします。このパラメーターのおかげで、過去のインジケーターの読み取り値を確認できます。 幅-線幅。 Cl

Plot History Mt5は、エキスパートアドバイザーが実行する取引端末とアカウントの取引履歴を分析するトレーダーにとって不可欠なスクリプトです。分析方法は、スクリプトが実行されるシンボル図と魔法の番号、1人または複数の専門家が使用するすべての魔法の特定または完全な分析に基づいています。スクリプトは取引データを分析し、これらをチャートにプロットし、エキスパートログに詳細な取引情報を印刷し、分析されたデータをcsvにエクスポートできます。 スクリプトの利点 アカウントで使用されている1つまたはすべての魔法を分析する機能 すべての取引データをcsvファイルにエクスポートします すべての取引、エントリー、エグジットをチャートにプロットします。これは、プロットするかどうかのように設定できます。 エキスパートログに詳細な取引情報を印刷する アカウント取引分析を実行する方法 分析するシンボルを選択することから始め、次に、分析を特定の魔法の番号付けで実行するか、アカウントで使用されるすべての魔法の完全な分析で実行するかを選択します。ノート;これはスクリプトであり、専門家のアドバイザーではあり

マルチチャートリフレッシュMt5は、高速でスムーズに不可欠なスクリプトであり、複数のチャートを同じものから同時にリフレッシュすることができます。マルチタスクにより、更新するシンボルを事前に選択できるため、これが可能になります。 それはどのように機能しますか?
チャートを開き、ナビゲーターからスクリプトをドラッグしてチャートにドロップします。目的の記号を設定し、[OK]をクリックします。これはスクリプトであり、エキスパートアドバイザーではないことに注意してください。プログラムは、タスクが完了するとチャートから自分自身を削除します。ターミナルのジャーナルの詳細情報は、どのシンボルが希望のバー数で更新されているか、更新されていないかについて印刷されます。これより簡単なことはありません!
スクリプトメニュー設定 シンボルの選択-目的のシンボルを設定します シンボルプレフィックス-シンボルプレフィックスが存在する場合は入力します。プレフィックスのみです。 記号の接尾辞-記号の接尾辞が存在する場合は入力します。その接尾辞のみです。 何本のバーでチャートを更新しますか? -更新/チャートするバ

価格観察への常識的なアプローチ 価格が上昇しているときに購入し、価格が低下しているときに販売する 価格が上昇しているときに購入する、または価格が下がっているときに販売するという上記のステートメントは広すぎる可能性があるため、いくつかのガイドラインとルールが必要になる場合があります。ここで3ダックが役立ちます。
価格平均Mt5インジケーターは、最後の上昇トレンドの方向での購入機会と最後の下降トレンドの方向での販売機会を識別するのに役立ちます。タイトルの「アヒル」は、「すべてのアヒルを並べる」という表現から来ており、すべてを正しい順序で並べることを意味します。アヒルは3つあり、最初のアヒルは最後の上昇トレンドまたは下降トレンドを識別するのに役立ち、2番目のアヒルはトレンドの方向を確認するのに役立ち、3番目のアヒルはトレンドの方向での売買の機会を識別するのに役立ちます。この指標には、4時間チャート(最初のアヒル)、1時間チャート(2番目のアヒル)、5分チャート(3番目のアヒル)の3つの異なる時間枠を使用することが含まれます。
最初に行う必要があるのは、最大の時間枠(4時間の最初のアヒル
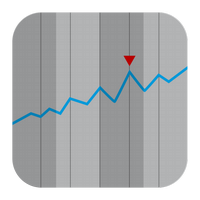
ハイパージオメトリックシリーズは、このフィルターの重み係数を計算するために使用されます。このアプローチにより、時系列のかなり興味深い平滑化を得ることができます。 超幾何フィルターの重みは、指数関数的および線形加重移動平均ほど速く減衰しませんが、平滑化された移動平均よりも速く減衰します。このため、このフィルターの動作は、移動平均の動作と多くの点で似ています。ただし、いくつかの利点があります。その遅れは移動平均のそれよりはるかに小さいです。しかし同時に、指数移動平均よりもはるかに多くの情報を保持します。このため、超幾何フィルターは、財務時系列の傾向と周期的コンポーネントをより適切に強調できます。したがって、この指標は、さまざまなタイプの移動平均を使用する取引戦略で使用できます。 インジケーターの動作は、単一のパラメーターに依存します。 iPeriod -このパラメータの有効な値は2-149です。 このパラメーターの値が小さいほど、インジケーターは最新の価格変動に強く反応します。このパラメータの値を大きくすると、長期的な傾向を強調することができます。さまざまなiPeriod値を使用したイン

In many strategies, it's quite common to use a scaled ATR to help define a stop-loss, and it's not uncommon to use it for take-profit targets as well. While it's possible to use the built-in ATR indicator and manually calculate the offset value, it's not particularly intuitive or efficient, and has the potential for miscalculations.
Features Configurable ATR offset Upper and Lower Band. configurable ATR scaling factor alternate(non-chart) ATR timeframe explicitly defined input types to improv
FREE

Donchian Channel is an indicator created by Richard Donchian. It is formed by taking the highest high and the lowest low of the last specified period in candles. The area between high and low is the channel for the chosen period.
Its configuration is simple. It is possible to have the average between the upper and lower lines, plus you have alerts when price hits one side. If you have any questions or find any bugs, please contact me. Enjoy!
FREE

Robo =Crisis= is a completely new unique approach to trading in the "swamp" of trading. Trading in automatic and semi-automatic mode. The robot works according to the current market situation, no stories, redraws, grids and other things. One of the main advantages of the robot is the love of strong volatility. He's not afraid of the news. Absolutely any volatility in the market is our friend. Features of trading: - The adviser includes ( Robo =Crisis= and the Flat indicator, which will be added
I'm sure after a lot of research on the internet, you haven't found any indicator that can help you with forex or binary trading in the latest probability strategy created by famous trader Ronald Cutrim. The strategy is based on a simple count of green and red candles, checking for a numerical imbalance between them over a certain period of time on an investment market chart. If this imbalance is confirmed and is equal to or greater than 16%, according to trader Ronald Cutrim, creator of the pro
FREE
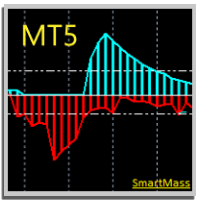
SMARTMASS INDICATOR
This indicator is different from all known volume indicators. It has a significant distinction; it is an algorithm that relates price movement to volume, attempting to find proportionality and efficient movement while filtering out noise and other movements that are more random and do not follow a trend or reversal. Ultimately, it reveals the true strength of the movement, indicating whether it has genuine support from bulls or bears or if it's merely a high-volume movement
Expert Advisor Stop and Reverse Cut Switch Hedge based on Parabolic SAR indicator. There are two setting in EA: 1. Cut Switch 2. Hedging
Recommended settings: TimeFrame = H4 Risk = 0.1 Minimum Balance = 1.000 MaxToBep = 4
Main Parameter Description: - Hedging Mode False = Cut Switch True = Hedging - Max Martingale Level = Lot / Volume will reset after "n" Losses - Risk = Based % of Balance -MaxOP to BEP = Target BEP will be active if there is a certain number op open position - Percent BEP =
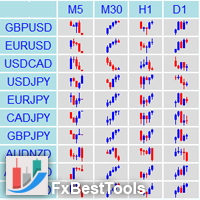
Definition : Market View is a dashboard (scanner) to view price graphs of all symbols and all timeframes at a glance. The utility is designed user friendly and added a wide range of customization options.
Main features of Market View : Visual settings window on the chart Customizable list of symbols and timeframes Different shapes : Real Candles, Schematic Candles, Arrows Customizable number of candles Changeable size of dashboard (scanner)
Highlight timeframes with gaps on candles Open approp

• Non Repaint
• DelayNo Lag
•Pop Up notification
• 98% Verified Accuracy
• Real time arrows to catch spikes at least 4-8 bars
We forward guide video how milk spikes
We also add in telegram group for better quality help
+see live trading results
https://youtu.be/DCG4CAWlg4I
you will see an arrow signal and open trade for spike
stop-loss of trade will be 8 or 10 candles if no spike exit
you just need to follow spike arrow signals and for more good results follow instruction in vid
FREE

The " Stochastic Advanced " indicator displays the signals of the 'Stochastic" indicator directly on the chart without the presence of the indicator itself at the bottom of the screen. The indicator signals can be displayed not only on the current timeframe, but also on a timeframe one level higher. In addition, we have implemented a filter system based on the Moving Average indicator.
Manual (Be sure to read before purchasing) | Version for MT4 Advantages
1. Displaying the signals of the "Stoch

Only 5 copies of the EA at $333! Next price --> $1111 The robot only works on the Nasdaq for 30 minutes or less
Please contact me for optimal settings.
The robot only trades two times a day in American Time. Very low risk. Limits specified. Opens only one position. Martingale does not. Absolutely scalp.
You can contact us via Instagram, Telegram, WhatsApp, email or here. We are ready to answer you.
Daily Projection Levels , as the name implies, is an indicator that project the price changes in percentage above and below the opening of the day (or closing of the previous day.
These are "psychological" support and resistance areas where price tries to retrace or break out.
With this you have a powerful tool to predict what these zones will be! You can define which projection levels you want (up to 5 above and below), in addition to have alert messages and visual customization. If you want to

This EA takes trades based on a configured RSI level. At each candle close, it will resume a position if the one closes above the previous one.... The SL and TP are positioned and it is the sum of all the trades initiated that will close the positions: Either in % of capital, or in pips. IMPORTANT :
it is the magic number that allows the EA to properly close positions. so be sure to put different magic numbers on each graph. Important : have a good money management with this type of EA (little
Important : have a good money management with this tpe of EA (little lot size....and avoid margin call)
The EA takes a trade when 2 conditions are met: The achievement of an RSI level, and the break of a moving average of your choice.
When the trade is initiated: the SL is positioned (in pips) the TP1 can be: the kijun, or another moving average, you can configure a value approaching the TP1 (which avoids the price shift of brokers) the partial close is done the SL after TP1 can be configured

Do you want an EA with small stoploss? Do you want an EA that is just in and out of market?
Gold looks at several MT5 It is ONLY buying when the market opens and with a window of 10 minutes or less.
It uses pre-market price so be sure your broker has that.
This strategies (yes, it is 2 different strategies that can be used with 3 different charts) have tight stoplosses and a takeprofit that often will be reached within seconds!
The strategies are well proven. I have used them manually for

1. The Expert Adviser is built with a basic, simple and stable trading strategy with i touch or Price Action Principle that is highly effective and accurate with a sniper entry system for a good money management.. 2. The expert advisor works best as from 15 minutes time frame and above.... 3. The expert advisor work with all broker all currency pair and synthetic indices... 4. Use a reasonable lot size and correct settings if you want to get the best of the Expert Advisor.. 5. With Default setti
FREE

1. The Expert Adviser is built with a basic, simple and stable trading strategy with a touch of Price Action Principle that is highly effective and accurate for a sniper entry system. The EA have a good money management System.. 2. The expert advisor works best as from 5minutes time frame and above, The higher the time frame, the more accurate is the signal.... 3. The expert advisor work with all broker all currency pair and synthetic indices... 4. Use a reasonable lot size and correct settings
FREE

1. The Expert Adviser is built with a basic, simple and stable trading strategy with a touch of Price Action Principle that is highly effective and accurate for a sniper entry system. The EA have a good money management System.. 2. The expert advisor works best as from 5minutes time frame and above, The higher the time frame, the more accurate is the signal.... 3. The expert advisor work with all broker all currency pair and synthetic indices... 4. Use a reasonable lot size and correct settings
FREE

Only gold and bitcoin can be profitable. Trade time is 30 minutes and trend time is 1 hour.
You should check the efficiency of this robot at the end of three months.
Strong trends make very good profits.
There are many inputs for your personalization, but the best settings are defined by default.
This indicator will have many updates and special settings will be added to it.
You can contact us via Instagram, Telegram, WhatsApp, email or here. We are ready to answer you.
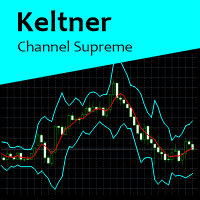
Keltner Channel Supreme is a indicator based on Keltner Channels, with some configuration besides period and Keltner multiplier factor. In this indicator, it is possible to change to an exponential moving average and if prices will be calculated according to close price or typical price. This indicator works on all graphics. If you have some doubt, please PM.
Скальпирующий алгоритм полностью автоматической торговли на FORTS для фьючерсов Сбербанка и Газпрома Московской биржи. Рабочий таймфрейм 5 минут. Алгоритм анализирует:
1) Импульсное изменение цены в моменте и на истории сопряженных активов. 2) Глубину рынка на наличие повышенных объемов в стакане. 3) Роботизированные и айсберг заявки в стакане. 4) Потенциальные ценовые и фрактальные уровни. 5) Историю на хорошо отработавшие паттерны прайс экшен. В случае когда алгоритму удалось выбрать подходящ

Donchian Channel DC is the indicator of Donchian Channels, that plots maximum and minimum values of a specific period, besides mean value line. It´s possible to configure simple period for analysis and the indicator will plot all three values. You can trade with this indicator as trend or reversal, according to each strategy. Do not let to test others indicators as soon as others expert advisors.
MetaTraderマーケットは、履歴データを使ったテストと最適化のための無料のデモ自動売買ロボットをダウンロードできる唯一のストアです。
アプリ概要と他のカスタマーからのレビューをご覧になり、ターミナルにダウンロードし、購入する前に自動売買ロボットをテストしてください。完全に無料でアプリをテストできるのはMetaTraderマーケットだけです。

取引の機会を逃しています。
- 無料取引アプリ
- 8千を超えるシグナルをコピー
- 金融ニュースで金融マーケットを探索