YouTubeにあるマーケットチュートリアルビデオをご覧ください
ロボットや指標を購入する
仮想ホスティングで
EAを実行
EAを実行
ロボットや指標を購入前にテストする
マーケットで収入を得る
販売のためにプロダクトをプレゼンテーションする方法
MetaTrader 5のための有料のテクニカル指標 - 54
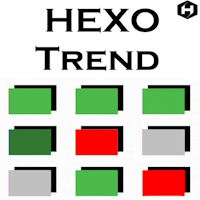
Hexo Trend は、金融市場を対象とした広範な研究開発作業を経て、最新の取引テクノロジーを導入した高度なトレンド トラッカーです。 私たちのインジケーターは金融市場で見られるフラクタル理論に基づいており、トレンドを特定し、中立的な市場センチメントの期間をフィルタリングします。市場でより収益を上げる方法はトレンド取引であることを理解しています。 トレンド取引は、現在の市場の動きの方向に取引します。 上方向: このような動きは強気の動きと呼ばれます。 下向きのトレンドは弱気と呼ばれます。 トレンドに従って運用するということは、同じ方向にポジションを持つことを意味します。 私たちのメソッドは、流れに逆らうよりも流れに乗って泳ぐほうが良いことを理解しているため、トレンドに合わせて行動する必要性を強調しています。 市場が動いている方向にトレードすることは、非常に簡単そうに見えて難しいことであり、主観的にトレンドを特定することに頻繁にさらされることを意味します。 現在の市場の方向でのトレードが成功するかどうかを決定する要因は数多くあります。たとえば、トレンドの「健全性」を定義することは常に困

Unlock the power of precise trend analysis and supercharge your trading strategy with Momentum Trend on MT5! Our cutting-edge trading tool is designed to provide traders with the essential insights and data needed to navigate the dynamic world of financial markets. Key Features: Accurate Trend Analysis : Momentum Trend utilizes advanced algorithms to accurately identify market trends, helping you stay ahead of the curve and make informed trading decisions. Real-Time Data : Stay updated with real

ATR Stops is an indicator which shows Dynamic support and resistance lines by considering ATR value and also a multiplier. its highly effective to find out the trend direction and also is useful for using as stop loss levels. it could be used in different ways one usual way is to buy when line becomes green and sell when it becomes red. when its combined with money management rules and risk reward considerations there is good results.

Pivot Point Super Trend is another type of famous super trend indicator which is equipped with pivot points in different way. this indicator used to be available in the Trading view and this is converted from there to the MT5 language. MT4 version of the indicator is also available and you can find in my products. there are also buy/sell signals shown on the screen.

Being part of our trading system which is made up of three indicators: Hexo Trend - Main Indicator Hx Stochastic – Our version of the Stochastic Oscillator. Hexo Zones: made up of two indicators that help you enter and stay in a trend. Being a special moving average and our 07-color coloring rule. - Hx Moving Average: Average with special calculation, which tries to define the trend. Figuratively, we consider the average as the division into two zones. Above average zone, we only think about sh

This Automatic support/resistance indicator calculates various peaks and troughs of the price action, identifies relevant levels and draws support and resistance automatically. It uses the built-in "ZigZag" indicator in Metatrader as a data source hence, very much accurate indicator. The support and resistance lines are contineusely updated as new levels and formed. The indicator has only 5 parameters to set, and mostly it can be used with the default values: The description of the settings is

Important Note: Trend Starter Indicator (TSI) detailed settings manual, trading strategies (coming soon) and setfiles (coming soon) are available in this LINK The Trend Starter Indicator (TSI) provides traders with precise and actionable signals for potential market entry points. By capitalizing on the unique interplay of two internal oscillators combined with astute price action monitoring, TSI optimizes and simplifies the decision-making process in the dynamic world of trading. But that'
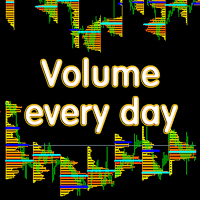
Основные отличия и преимущества индикатора Volume every day от похожего продукта Volume Profile V6 В Volume every day можно параметром Range period задать временной диапазон построения профиля, а параметром Range count задать количество профилей данных диапазонов. Например, на втором скрине Range period=1Day, а Range count=10 - это значит, что профиль будет строиться на периоде один день, десять последних дней. Важно, что переключение тайм фрейма графика не влияет на построение профиля, что т

The VIX Fix is a volatility indicator developed by renowned trader Larry Williams. It's designed to measure volatility in assets that don't have options or futures, such as individual stocks and forex markets. Essentially, it acts as a synthetic VIX (Volatility Index) for any asset , providing a gauge of market uncertainty. This modified version of William's indicator helps you to find market bottoms and market tops. It comes with 2 styles: Stochastic and histogram style. Please see screenshots

In the fast-paced and ever-evolving world of stock trading, having a reliable compass is essential for navigating the complexities of the financial markets. Meet the Stock Trade Navigator, your trusted partner in the quest for investments. Unlock the Power of Data: Our Stock Trade Navigator is not just a tool; it's your data-driven co-pilot. Harnessing cutting-edge algorithms and real-time market data, it empowers you with a comprehensive view of the financial landscape, enabling you to make inf

The QQE indicator is a momentum-based indicator used to identify trends and sideways. The Qualitative Quantitative Estimate (QQE) indicator works like a smoothed version of the popular Relative Strength Index (RSI) indicator. QQE extends the RSI by adding two volatility-based trailing stops. This indicator is converted Qfrom Trading View QQE MOD by Mihkel00 to be used in MT5 Version.

The SuperTrend indicator is a popular technical analysis tool used by traders and investors to identify trends in the price of a financial instrument, such as a stock, currency pair, or commodity. It is primarily used in chart analysis to help traders make decisions about entering or exiting positions in the market. this version of super trend indicator is exactly converted from trading view to be used in MT5
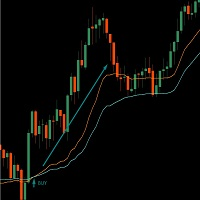
This indicator is built at the intersection of two VMA (Variable Moving Average, or VIDYA or Variable Index Dynamic Average) indicators. Flexible settings will allow you to more accurately find the entry point. The fast one crosses the slow one and this is a signal to buy or sell. Works on all instruments. Brief Description of the VMA Indicator: VMA (Variable Moving Average, also known as VIDYA or Variable Index Dynamic Average) is an exponential moving average that automatically adjusts the smo

Zeusインジケーターのご紹介:トレーディングでの究極の利益ブレークスルーをサポートするツール。 このインジケーターは、ブレイクアウト戦略と深い分析の必要性を排除し、トレーディングを簡素化します。設定した時間フレームに基づいてゾーンを自動的に描画し、ストップロス(SL)、テイクプロフィット(TP)、トレーリングストップのレベルを提案します。 Zeusインジケーターは、価格が買いポイントまたは売りポイントに近づいた際に、すぐに通知し、シグナル矢印を表示します。さらに、4つの異なるテイクプロフィットレベルとさまざまなトレーリングストップオプションの推奨も行います。 このツールは初心者から熟練のトレーダーまで対応しています。 チャンネルサポート: こちらをクリック ストア: こちらをクリックしてください。
MT4バージョン: こちらをクリック おすすめ: 時間枠: M5またはM15 通貨ペア: すべての通貨ペアと互換性があります アカウントタイプ: すべてのアカウントタイプと互換性があります おすすめのストップロス: Zeusインジケーターが提供するSLの提案をご利用ください お

This indicator identifies the global trend and has a powerful algorithm for filtering out any type of noise that can interfere with trend direction identification. A special filter shows areas of sideways trend, consolidation or flat, which allows you to avoid any uncertainties in the market movement vision and gives a clear understanding of the global trend movement.
This indicator has no analogues and gives it unique advantages in the analysis of price movements and determination of the dir

SyntheticaFXは、すべてのCrashおよびBoom合成通貨ペア向けに設計された非リペイントのスパイク検出器です。1分間の時間枠で動作します。
ルールはシンプルです。エントリー矢印が表示されたら、それは迫るスパイクを示しています。取引を開始し、1分間のキャンドル15から25本の間にストップロスを設定します。スパイクが発生しない場合、損失を受け入れ、新しいエントリーシグナルを待ちます。スパイクが利益をもたらすと、即座に利益を取るか、3〜5本のキャンドルを保持してから取引を終了します。
これは私にとって効果的であることが証明された戦略に基づいてエントリーシグナルを提供するだけの指標であることに注意してください。SyntheticaFXゾーンインジケーターおよびSyntheticaFXインジケーターと併用することをお勧めします。
インストールしたら、CrashペアではBuy Entryの矢印の色をNoneに変更し、BoomペアではSell Entryの矢印の色をNoneに変更してください。
適切なリスク管理を行い、過度なレバレッジを避けてください。
ZigZag と ダウ理論 による目線固定&ReviewCandleChart対応で過去検証の強い味方。「目線迷子」に悩む方におすすめのツール
概要 「RCCZigZagDow」インジケータは、ZigZag波動に対して、ダウ理論に基づく判断を支援するツールとなります。 ZigZag波動をベースとしてダウ理論の継続点を導き出すことによって、トレンドの把握を誰が行っても同じになるという利点があります。 現在のトレンドは「上げ」「下げ」それとも「レンジ」なのか波動のロジックが明確で、その結果の目線も明確。「客観性」と「再現性」を確保できます。 「目線迷子」に悩む方におすすめします
客観性と再現性の確保
このインジケータは、ZigZag(統一基準)を使用して市場の波動を客観的かつ再現可能に評価し、ダウ理論に基づく判断を支援します。 また、自動描画機能により、環境認識にかかる時間を大幅に短縮し、過去の検証をサポートします。 このように、誰が使用しても同じ結果が得られることが重要であり、それ以降の異なる解釈は個々の視点に委ねられます。 特定のタイミングでの共通認識を促進するツールとして
Hello
I Want to introduce The Forex Buy Sell Arrow Premium MT5
i recently release this premium indicator!
its 1000% Non Repaint Indicator,
It Work Perfectly Well,, i tested it day by day, Just mind blowing Result,
Including Powerful trend Algorithm!
How It Work?
well, it work market trend formula, when trend Bullish Or when trend Bearish,
Recommend Timeframe M30, H1 it work all timeframe, and all currency pair,
100% non repaint,
How to take signal From Forex Buy Sell Arr

Virgin Breakout Pro MT5 Indicator Description: "Virgin Breakout Pro" is a state-of-the-art MT5 indicator specifically designed to recognize and highlight breakout opportunities based on virgin highs and virgin lows in the financial markets. Features and Functionality: Virgin Highs and Lows Recognition: The core functionality of the Virgin Breakout Pro is to accurately analyze the price action and candlestick patterns to detect potential breakout regions. N-Candle Verification (Adjustable): For a

KT Supply and Demand indicator identifies and plots key supply and demand zones. It achieves this by analyzing swing points and integrating them with a multi-timeframe analysis, ensuring that only the most crucial supply-demand zones are highlighted. This advanced method highlights the regions where prices are likely to reverse, stemming from significant supply-demand zones established by recent price movements.
Features
Precision Analysis: Our refined algorithm is designed to accurately pi

This indicator Displays current spread in the main window of the chart. You can modify the font parameters, indicator's position and the normalization of the spread value. The spread is redrawn after each tick, ensuring the most current and active spread value. This can be useful for brokers with variable spreads or with spreads that are widened often. You can also enable a spread label to be shown near the current Bid line. you can also set alert : Email, and push notifications.

Best Pivot Point Indicator display pivot points and support and resistance lines for the intraday trading. It calculates them using its own formula based on the previous trading session The indicator can display the following levels in addition to plain pivot points: Previous session's High and Low, today's Open. Sweet spots. Fibonacci levels. Camarilla pivots. Midpoint pivots.

Enhance your trading strategy and optimize your market entries with the Power MA Rectifier Indicator, now available for sale on the MetaTrader 5 (MT5) Market platform. This innovative indicator combines the power of Moving Averages (MA) with a rectification algorithm, providing traders with valuable insights to make informed trading decisions. Key Features: Moving Averages Integration : The Power MA Rectifier Indicator leverages Moving Averages to analyze market trends, helping traders identify

//--- input parameters input int InpFastEMA = 12; // Fast EMA period input int InpSlowEMA = 26; // Slow EMA period input int InpSignalSMA = 9; // Signal SMA period input ENUM_APPLIED_PRICE InpAppliedPrice = PRICE_CLOSE; // Applied price
伝統的なMACDとMQLプラットフォームを結集した2種類の指標結合バージョンは、市場動向を効率的に分析し、より効果的で、より簡潔で、より直感的に分析することができる。 ご購入とご利用に感謝します。より良いアドバイスがありましたら、コメントエリアにコメントしてください。私は最初に返事をします。ここであなたが市場で十分なお金を稼いだことをお祝いします。

//--- input parameters input ENUM_TIMEFRAMES InpPeriod = PERIOD_D1; // Period input int InpBandsShift = 15; // Shift
アイコンに他の任意の周期のろうそく図の終線を表示する指標で、市場の動きを効率的に分析することができ、より効果的で、より簡潔で、より直感的である。 ご購入とご利用に感謝します。より良いアドバイスがありましたら、コメントエリアにコメントしてください。私は最初に返事をします。ここであなたが市場で十分なお金を稼いだことをお祝いします。
アイコンに他の任意の周期のろうそく図の終線を表示する指標で、市場の動きを効率的に分析することができ、より効果的で、より簡潔で、より直感的である。 ご購入とご利用に感謝します。より良いアドバイスがありましたら、コメントエリアにコメントしてください。私は最初に返事をします。ここであなたが市場で十分なお金を稼いだことをお祝いします。
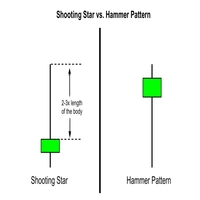
The Candlestick Reversal Alert for MT5 is your ultimate tool for identifying potential trend reversals in the financial markets. This powerful indicator is designed exclusively for MetaTrader 5 (MT5) and is packed with features to help you stay ahead of market movements. Key Features: Customizable Reversal Criteria: Tailor the indicator to your trading style by adjusting parameters such as lower wick size, top wick size, and top wick percentage. Historical Analysis: Specify how many historical c

Introducing Moon Spiker – Your Lunar Gateway to Precision Trading on MetaTrader 5! Elevate your trading experience to astronomical heights with Moon Spiker, a cutting-edge indicator designed to harness the celestial powers for precise analysis and decision-making. Say hello to an innovative tool that will send your trading strategy rocketing to the next level! Designed exclusively for MetaTrader 5, Moon Spiker is meticulously crafted to cater to the discerning trader focused on the 1-hou
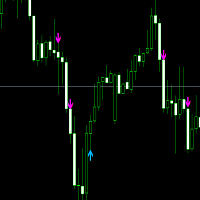
This offer is limited to a temporary period. Entry signal :follow the blue arrow for a buy trade and the Pink for a sell. Buy Trade: When the blue arrow appears, you wait until the candle completely finishes. Then you enter into a Buy Trade as soon as the next candle appears. Now wait until you hit TP1 from the Buy Goals box, then close the trade with a profit. Sell Trade: When the Pink arrow appears, you wait until the candle completely finishes Then you enter into a Buy Trade as soon as the n

Inverted Price Action est un outil financier qui reflète graphiquement les mouvements des prix comme s'ils étaient inversés, ce qui peut aider les traders et les investisseurs à avoir une perspective différente sur les tendances et les mouvements du marché.
Lorsque la souris est positionnée sur l'indicateur, il réagit en modifiant sa couleur pour correspondre à celle du graphique principal, tandis que le graphique sous-jacent est assombri. Cette fonctionnalité peut aider les utilisateurs à se

Cet indicateur technique affiche la tendance du marché ainsi que les niveaux de support et de résistance tracés aux points extrêmes de l'indicateur ZigZag standard. Il classe les formes à cinq points en fonction de l'ordre des points de haut en bas.
Le motif dynamique est basé sur les quatre premiers zigzags droits. Dans cet indicateur, tous les motifs sont considérés comme dynamiques. Pour respecter cette condition, le concept de mutation du marché a été artificiellement introduit et l'algor
The Symbol Changer Indicator is a powerful tool designed to enhance your trading experience by providing quick access to switch between different financial Instruments on your MetaTrader 5 platform. Quickly switch symbols and Show/Hide Buttons. A clean and intuitive graphical interface ensures that traders of all experience levels can use this indicator with ease.

Top indicator for MT5 providing alert and notification for symbols if any price freezes!
Guys, try to buy at least one month version for testing purposes! This indicator displays the current time for multiple Forex pairs and alerts when there's a disconnection between broker and PC time. It'll be very help full for trading platforms administrator who are monitoring hundreds of symbols in a time.
Swing trading is a method in which traders attempt to take advantage of market fluctuations. They buy a security when they believe the market will rise and sell if they feel the market will fall, which, as you can imagine, is common in most trading strategies, irrespective of trading style.
The four most frequently occurring patterns in the swing trading domain are reversal, retracement (or pullback), breakouts, and breakdowns.
FOR MORE INFO Message Us
Work All currency pair,
work all

究極の反転取引戦略を発見してください!
あらゆる取引セッションで反転を識別する技術を解き放つ強力なインジケーターを紹介します。推測に別れを告げて、精度にこんにちは!
当社のインジケーターはバイサイド流動性 (BSL) とセルサイド流動性 (SSL) の両方を綿密にマッピングし、情報に基づいてエグジットの意思決定を行うための知識を提供します。
しかし、それだけではありません。この戦略では、単一のアプローチに限定されません。また、BSL と SSL の流動性を活用してロンドンのブレイクアウトを利用することもでき、多用途性とさらに大きな利益の可能性を提供します。
**これが例です:**
価格がバイサイドの流動性から上昇し、自信を持ってエントリーレベルを超えたときを想像してみてください。これは、取引に参加し、単純かつ強力な戦略であるセルサイド流動性に照準を合わせる合図です。
**この戦略を選択する理由**
1. **実証済みの収益性:** この戦略は時の試練に耐え、一貫した収益性の実績に裏付けられています。一

The ZigZag indicator's main objective is to highlight significant price movements by filtering out minor price fluctuations. It enables the visualization of trends by eliminating market "noise," which can assist traders in making more informed decisions. Adding the Fibonacci indicator, which is a powerful tool for identifying potential support and resistance levels in financial markets.
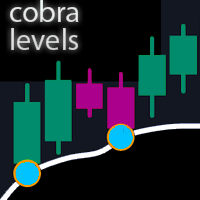
コブラレベル
これらは、外国為替、暗号通貨、コモディティ、ニフティ、バンクニフティを含むユニバーサル市場で機能する 2 つの周波数モードを備えた 6 セットのレベルです。 これらは金融商品に関する最良の調査を経て出版されています。
上位レベルを U1 ~ U5 と呼び、下位レベルを D1 ~ D5 と呼びます。
市場は、通常の状態では U3 または D3 までの内部チャネル、または不安定な状態では外部チャネル U4 から U5 または D4 から D5 のいずれかでドライブする可能性があります。 価格が U3 U4 U5 または D3 D4 D5 に達すると、反転の可能性が非常に高くなります。トレーダーはローソク足の終値を待ってエントリーを確認し、有効なリスク管理を行って取引する必要があります。
このインジケーターでは、インジケーター設定のカスタマイズオプションによってレベルをシフトできます。 ユーザーは + または - ポイントを追加してレベルをカスタマイズできます
1. タイムフレーム: M1、M3、M5、M15、H1、H4 のみで作業しています。

This indicator is based on the RSI indicator
Also, some candlestick patterns are used in it to identify better signals
Can be used in all symbols
Can be used in all time frames
Easy to use method
Adequate settings
Settings: period: The number of candles used to calculate signals. alarmShow: If you want to receive an alert in Metatrader after receiving the signal, enable this setting alarmShowNoti: If you want to receive an alert on your mobile after receiving a signal, enable this sett

The Jackson Auto Candlestick Pattern . It a powerful price action tool which auto detect and alert a hided powerful candlestick patterns . It came with few different chart skins. You can use this indicator alone to make profit, but it powerful when you combine it with trendlines, You can download The Jackson Auto Trendlines for free Link : UCRW695l9Wgg2ucnnf5DL5Vw List of Candlestick Pattern it detect 1. Bullish & Bearish Engulfing's 2. Top and Bottom Tweezer 3. Bullish and Bearish Harams 4.
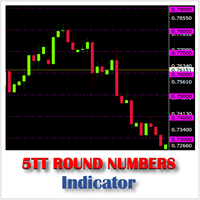
Like Support and Resistance levels, Round Numbers refer to price levels ending in one or more zeros, such as 125.00, 1.0350, 0.8750, 74.50, etc. These are psychological levels where financial institutions and traders expect price to either stall, retrace or breakthrough. On a price chart these figures are generally considered to rule off levels at the 50 and 100 mark. 5TT Round Numbers Indicator makes it absolutely easy for the trader to identify these levels on the chart without the laborious a
About the Proinsta78MT5 Indicator
The dots show a strong direction of movement, if there are no dots, then the movement changes or there will be a trading corridor with an exit. The profit depends on the timeframe, the larger it is, the more you can earn on the movement. I close on average after every 150-200 points.
I have shown the conditions for the signal in the form of screenshots in the screenshots 1-2photo section. Also in the third photo, the signals are visible and marked on the gr
Are you tired of sifting through endless charts and data to make informed trading decisions? Look no further! The Swing Volume Profile is here to revolutionize your trading experience. With its cutting-edge features, this tool provides you with the insights you need to navigate the dynamic world of financial markets with confidence. Feature 1: Volume Profile Measured from Major Swing High to Major Swing Low Accurate volume analysis is key to making informed trading decisions. The Swing Volume

William Gannの理論に基づいて作られたインジケーターで、360度のサイクルの主要な角度に対応する価格に水平線を描画します。 このインジケーターはWilliam Gannの有名な理論に基づいており、価格の強力な反転レベルとされる主要な角度に焦点を当てています。組み込まれている主要な角度は、30、45、60、90、120、180、220、270、310、360です。 特徴: 角度のカスタマイズ:ユーザーは入力リストから角度を追加または削除できます。 外観のカスタマイズ:色を選び、特定のラインを表示または非表示にするかを決定します。 高精度:このインジケーターは、高精度での指摘と使いやすさを提供するように設計されています。 推奨事項:より良い結果を得るために、このインジケーターを他の技術的分析技術と組み合わせて使用することを推奨します。

Camarilla Pivot Points is a math-based price action analysis tool that generates potential intraday support and resistance levels. Pivot price values are stored in output buffers within this indicator, enabling any Expert Advisor to utilize this indicator's data for trading purposes. This indicator offers the potential for developing numerous strategies. To explore some of these strategies, please visit the following websites: https://www.babypips.com/forexpedia/camarilla-pivot-points https:

Channel Universal knows how to correctly build a forex channel and forms a classic trading strategy, it is easy to execute, therefore it is accessible even to beginners. Price channels work equally well on any trading assets and timeframes, they can be used both independently and with additional confirmation from oscillators and market volumes.
If you look at the price and try to identify the simplest visual patterns, you will immediately see that the price almost never moves in a straight

The Target Go indicator tracks the market trend, ignoring sharp market fluctuations and noise around the average price. Catches the trend and shows favorable moments for entering the market with arrows. The indicator can be used both for pips on small periods and for long-term trading. The indicator implements a type of technical analysis based on the idea that the market is cyclical in nature.

The Trend Sikorsky indicator contains an entire trading system, processes information from several technical instruments and the appearance of its signals is the final result of the calculation. The indicator itself evaluates how strong a signal appears in the market and when to change direction, signals this, and the trader can only make a trading decision. This indicator works on all timeframes. You need to understand that any indicator is only a visual form of a signal. Currency pairs never

The Risk Trend indicator simplifies the decision-making process by recognizing reversals using a built-in algorithm and then confirming signals at support/resistance levels. Implements a type of technical analysis based on the idea that the market is cyclical in nature.
Thus, the indicator tracks the market trend with great reliability, ignoring sharp market fluctuations and noise around the average price. The indicator can be used both for pips on small periods and for long-term trading.

The Sinas indicator for Forex can be used both for pips on short periods and for long-term trading. It tracks the market trend, ignoring sharp market fluctuations and noise around the average price. Catches the trend and shows favorable moments for entering the market with arrows. The indicator implements a type of technical analysis based on the idea that the market is cyclical in nature.

The Hrum indicator was created to neutralize temporary pauses and rollbacks. It analyzes price behavior and, if there is a temporary weakness in the trend, you can notice this from the indicator readings, as in the case of a pronounced change in trend direction. Entering the market is not difficult, but staying in it is much more difficult. With the Giordano Bruno indicator and its unique trend line, staying on trend will become much easier!
Every rise and every fall is reflected in your emot
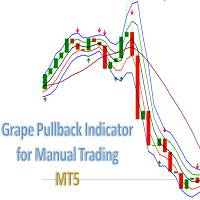
Indicador Grape Pullback for Manual Trading. Indicator (arrow) Type Strategy (Pullback) for all Symbols and Periodicity, Preferably from 30M periodicity. Can be used for manual trading. The indicator i s determined by strategies that is based on criteria for the location of candlesticks in the channel and for the Rsi and Market facilitation index indicators. Its workspace corresponds to channel of 3 bars of Bill Willians with a channel extension . BUY when there is a Green Arrow. StopLoss below

Let me introduce our ProfitPlotter indicator
We are developing a technical indicator best suited for analyzing trading performance. It can display statistics of all currency pairs and trades of different magic numbers categorized on the same chart. You can specify the time range, magic number, specific currency pairs or profit statistic curves of all currency pairs for analysis. You can also click to jump to order positions and view order details, which greatly improves the usage experience. Ma
Correlation value between two Symbols. A value of +1 means a complete positive correlation; A value of -1 means a complete inverse correlation; A value of 0 means there is no explicit correlation (prices do not depend on each other, or the correlation is random); My #1 Utility : includes 65+ functions | Contact me if you have any questions In the settings of the indicator, you can configure: Symbols (currency pairs) to be used in calculations.
Leave one value empty if you want one of the

Point and Plot: The Anchored VWAP with Channel Bands tool is designed for traders of all levels, from beginners to seasoned professionals. Point to the price level you want to anchor to, plot the horizontal line, and watch as this versatile tool transforms your trading approach. User-Friendly Interface : Navigate the tool effortlessly with a user-friendly interface that ensures you never miss a crucial detail. Real-Time Analysis : Make informed decisions in real time with dynamic data that upda

V-Flow is a Trading System that takes into account volume, flow and other factors to give a signal when to enter, hold and close a position. There are two trading modes: conservative and aggressive . CONSERVATIVE: In this mode, the system shows you when to trade by painting the graph according to the signal (buy or sell). After that, when the trend ends, the graph turns gray, indicating the time to exit the operation. However, if the histogram at the bottom still points to the same trend, it is
Simple alert system which will alert you on your mobile terminal, email and on the chart whenever RSI crosses below the overbought level or above the oversold level. Use this alert system, so you don’t have to watch the chart all day for the RSI levels to break.
INPUTS: 1. RSI Period- (Default is 14). Number of candles the RSI indicator will look back for the calculations. 2. OB Level- (Default is 70). This is the Overbought level or Upper level for the RSI indicator. 3.

Dr. Trend is based on Market Trend Detection. With this Indicator anybody can easily understand the Market Trend and Trade accordingly. It will be very very helpful to Trade perfectly and increase the Accuracy Level.
Recommendation: Use this Indicator along with my another Indicator --->>> Dr. Trend Alert ; Use this Indicator along with my another Indicator --->>> My PVSR <<<--- Click Here ; Good_Luck
It can be used for: All Pairs: Forex, Cryptocurrencies, Metals, Stocks, Indice

Visual guide which divides the 24 hours into three trading sessions. The default setting is to show Asian , London and New York sessions. But, the session start and end hours can be adjusted as required.
The indicator is useful to develop trading strategies by making it easy to see the market behavior during the three sessions.
Inputs Time Zone Start and End hours (Please provide values in HH:MM format, like 02:00, not like 2:00. Both the hours and minutes should have 2 digits) Time zone
最先端のインジケーターで精度の力を解き放ちましょう! この独創的なツールは、すべての価格ティックを細心の注意を払って監視し、チャートにロードした瞬間から計算を開始します。
微妙なトレンドの変化や展開に合わせて方向性パターンを明らかにする能力があれば、ダイナミックな金融市場の世界で顕著な優位性が得られることを想像してみてください。 私たちのインジケーターはあなたの鋭い味方として機能し、あなたが時代の先を行くことを可能にします。
しかし、それだけではありません。私たちは、お客様の信頼を念頭に置いてこのインジケーターを設計しました。 不確実性によって判断が鈍くなった場合には、トレンドまたはオシレーターベースのインジケーターをシームレスに統合するオプションがあります。 この相乗効果により、データを簡単に平滑化し、さらに明確で洗練された市場の視点を提供できるようになります。
普通で満足しないでください。 当社の革新的なインジケーターを使用して取引体験を向上させ、進化し続ける金融環境の中で情報に基づいた意思決定を行うことができます。 マーケットマスターへの道はここから始まります。

The "Alligator" indicator is a powerful technical analysis tool designed to assist traders on the MetaTrader 5 (MT5) platform in identifying market trends and potential price reversal points. This indicator is based on a concept developed by Bill Williams, a renowned technical analyst in the world of trading. How the Indicator Works: The Alligator indicator operates by using three Moving Average (MA) lines with different periods. These three lines are: Jaws: This is a Moving Average line with a

The Trendline Automatic indicator is an advanced technical analysis tool specifically designed to assist traders in identifying critical levels in the financial markets through the automatic drawing of support and resistance trendlines on price charts. With its automatic capabilities, this indicator saves traders time and effort in analyzing price movements, allowing them to focus on making better trading decisions. Key Features : Automatic Drawing of Trendlines : This indicator allows traders t

The "Timechannel" is a powerful technical analysis tool designed specifically for traders who want to gain deeper and more accurate insights into price movements across multiple timeframes (multi-timeframe). This indicator is an essential addition to the toolbox of any serious trader seeking to make informed and data-driven trading decisions. Key Features: Advanced Multi-Timeframe Analysis : Timechannel allows traders to analyze price movements on different timeframes simultaneously. This is cr

This indicator is great for trading many different pairs. The indicator itself uses mathematical models of augmented accuracy, but for now they are optimized for some currency pairs. Many settings can be configured in the initial settings. There are many icons for visualization. He displays his solution on a graph using various icons. There are several types of icons. In the tester it works fine by default in the settings. It is already configured by default. Happy bidding.

Introducing Candle Feeling Indicator for MetaTrader 5 - Your Ultimate Solution for Accurate and Timely Analysis! Built with more than two decades of programming experience, this indicator allows you to follow the complexities of financial markets with confidence and accuracy.
Key Features: High Precision: Identifies trend reversals with unparalleled accuracy, ensuring you stay ahead of market shifts. Analysis: All the information you need from the structure of a candle Beautiful appearance

Gold Venamax - これは最高の株式テクニカル指標です。 指標アルゴリズムは資産の価格変動を分析し、ボラティリティと潜在的なエントリーゾーンを反映します。
インジケーターの機能:
これは、快適で収益性の高い取引のためのマジックとトレンド矢印の 2 つのブロックを備えたスーパー インジケーターです。 チャート上にブロックを切り替えるための赤いボタンが表示されます。 マジックはインジケーター設定で設定されているため、異なるブロックを表示する 2 つのチャートにインジケーターをインストールできます。 Gold Venamax は、異なる矢印バッファー (GV と SF) を備えた 2 つのチャートに配置できます。 これを行うには、設定で異なる Magic を選択する必要があります。たとえば、あるマジック = 999、別のマジック = 666 を選択します。次に、チャート上の赤いボタンで矢印バッファを選択できます。 入力するのに最適な信号 = 両方のバッファ (GV および SF) の信号矢印 + 3 本すべての MA ライン (赤または青) の方向に従います。
イ

The Market Structures Pro indicator finds and displays 5 (five) patterns of the Smart Money Concepts (SMC) system on the chart, namely:
Break Of Structures (BoS) Change of character (CHoCH) Equal Highs & Lows Premium, Equilibrium and Discount zones with Fibo grid High-high, Low-low, High-low and Low-high extremes
Patterns are displayed for two modes - Swing and Internal and are easily distinguished by color on the chart. Internal mode features higher contrast colors, finer lines, and sm

このインジケーターを使用すると、フィボナッチレベルのラベルを大きなフォントサイズで表示できます。
。 最大 25 のフィボナッチレベルをサポートします
- フィボナッチを描画するとすぐに、入力パラメータとして追加したレベルが、選択した色とフォントの大きなフォント サイズで表示されます。
カスタマイズ可能なオプション:
1.フィボテキストフォント
2.フィボテキストサイズ
3.フィボテキストの色
3. 各レベルに説明を追加します
4. アンカーや度数などのその他のオプション
このインジケーターを使用すると、フィボナッチレベルのラベルを大きなフォントサイズで表示できます。
。 最大 20 のフィボナッチレベルをサポートします
- フィボナッチを描画するとすぐに、入力パラメータとして追加したレベルが、選択した色とフォントの大きなフォント サイズで表示されます。
カスタマイズ可能なオプション:
1.フィボテキストフォント
2.フィボテキストサイズ
3.フィボテキストの色
3. 各レベルに説明を追加しま

The " Market Session Times " indicator shows the time of four trading sessions: Asia, Europe, America and Pacific. The time of trading sessions is set in the format GMT and thus does not depend on the trading server at all. The following data is used: Trading Session
City
GMT
Asia Tokyo
Singapore
Shanghai 00:00−06:00
01:00−09:00
01:30−07:00 Europe London
Frankfurt 07:00−15:30
07:00−15:30 America New York
Chicago 13:30−20:00
13:30−20:00 Pacific Wellington
Sydney 20:00−0

The bullet indicator gives accurate direction of the market structure, it will indicate to you the exact direction whether it be the market is in a downtrend or if it's in an uptrend it will give you that information which will inturn benefits you by saving you the time it takes to analyse that structure, this indicator works on a timeframes and it's most favourable on higher timeframes.
How it works: -The green arrow will be at the support of the structure indicating buys -The red arrow will

Do you believe that financial markets and celestial bodies operate in separate realms? Our indicator begs to differ! Based on the innovative theory of William Gann, which emphasizes the influence of celestial planet movements on financial market dynamics, we present to you the "Gann Planetary Lines Indicator". Features of the Indicator : Precision : Accurate projection of the 360 degrees of planetary orbits onto price charts. Advanced Customization : Ability to display or hide any planet line,

デルタブックインジケーターは、ボリュームデルタの使用とオーダーブックからの情報を組み合わせて、株式、先物、仮想通貨などの金融市場で価格の動きを検出する強力な市場分析ツールです。デルタブックはその最大の潜在能力を引き出すためにリアルタイムのボリュームデータとオーダーブック情報へのアクセスが必要です。 デルタブックの主要な特徴は、市場参加者の行動に関する詳細な情報に基づいてトレンドや取引機会を特定できる高度な市場分析戦略です。以下はデルタブックインジケーターを説明するためのいくつかのヒントと重要な要点です: ボリュームデルタ:ボリュームデルタは特定の時間枠内の買い手(需要)と売り手(供給)のボリュームの違いです。この指標は買い手と売り手の不均衡を数量的に示し、市場での買いと売りのプレッシャーの変化を特定するのに役立ちます。 オーダーブック:オーダーブックは市場のすべての買い注文と売り注文のリアルタイムの記録です。トレーダーが資産を買いたい価格や売りたい価格、それらの価格で取引したい資産の数量を表示します。デルタブックはオーダーブックの情報を使って市場参加者の行動を分析します。 価格の流れ:
MetaTraderマーケットは、開発者がトレーディングアプリを販売するシンプルで便利なサイトです。
プロダクトを投稿するのをお手伝いし、マーケットのためにプロダクト記載を準備する方法を説明します。マーケットのすべてのアプリは暗号化によって守られ、購入者のコンピュータでしか動作しません。違法なコピーは不可能です。
取引の機会を逃しています。
- 無料取引アプリ
- 8千を超えるシグナルをコピー
- 金融ニュースで金融マーケットを探索
新規登録
ログイン