YouTubeにあるマーケットチュートリアルビデオをご覧ください
ロボットや指標を購入する
仮想ホスティングで
EAを実行
EAを実行
ロボットや指標を購入前にテストする
マーケットで収入を得る
販売のためにプロダクトをプレゼンテーションする方法
MetaTrader 5のための有料のテクニカル指標 - 39

Spread Pulse MT5 インジケーターは、トレーダーにチャート上の現在のスプレッドに関する情報を提供する効果的なツールです。 スプレッドとは、商品の購入価格と販売価格の差です。
インジケーターは、チャート上に表示されるテキストの形式で表示されます。 これにより、トレーダーは現在のスプレッドを簡単に追跡できます。
Spread Pulse インジケーターの主な利点の 1 つは、その色の視覚化です。 見開きサイズに応じて文字色が変わります。 デフォルトでは、スプレッドが小さい場合、テキストは緑色になります。これは、スプレッドが低く、取引がより収益性が高い可能性があることを意味します。 ただし、スプレッドが高くなると、インジケーターのテキストが自動的に赤に変わります。
さらに、ユーザーは高スプレッドと低スプレッドに関連する色をカスタマイズできます。 情報を読みやすくするためにフォント サイズを変更することもできます。
Spread Pulse インジケーターは、経験レベルや取引戦略に関係なく、あらゆるトレーダーにとって理想的です。 現在のスプレッドに関する情報
Supertrend is a trend following indicator based on the Average True Range (ATR) . Calculating the odd line combines trend detection and volatility. It can be used to detect changes in trend direction and position stops.
Basic knowledge Supertrend is a trend following indicator. It takes up space on the main chart and its plots show the current trend. A Supertrend can be used for varying durations (daily, weekly, intraday, etc.) and varying instruments (stocks, futures or forex). Super

Certainly! Let’s discuss the RSI Rush , an aggressive momentum indicator that combines weighted moving averages (WMAs) at lows, mid-price, and tight highs. Here are the key components: Weighted Moving Averages (WMAs) : The RSI Rush employs three WMAs: WMA at Lows : Calculated based on the lowest prices during a specific period. WMA at Mid-Price : Considers the average price (midway between highs and lows) during the same period. WMA at Tight Highs : Based on the highest prices during the speci
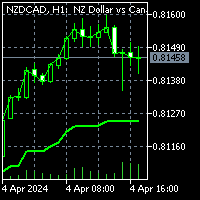
To get access to MT4 version please click here . This is the exact conversion from TradingView: "G-Channel Trend Detection" by "jaggedsoft". This is a light-load processing and non-repaint indicator. You can message in private chat for further changes you need. All input options are available. Buffers are available for processing within EAs. Highlight option is omitted as does not show good in Metatrader.
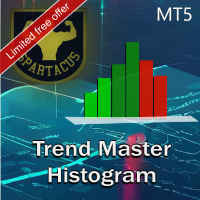
トレンド チャート ヒストグラムは、2 つの移動平均と複数のオシレーターを使用するアルゴリズムに基づくインジケーターです。 カラーコードのおかげで、トレンドを素早く特定し、市場の最大の衝動を利用することができます。
明るい色はトレンドを示し、暗い色は衝動を示し、灰色は市場に参入すべきではないことを示します。
MT4版はこちら。
入力パラメータ:
- 期間 1 (高速期間)
- 期間 2 (低速期間)
- 発振器周期
次の 2 種類のアラートを有効にできます。
- 弱気/強気アラート (市場のトレンドが変化したとき)。
- 売買アラート(強い衝動がある場合)。
アラートのテキストは完全にカスタマイズ可能で、好きなものを入力できます。
アラートはポップアップ、電子メール、プッシュ通知で利用できます。
SPARTACUS2024

Higher Timeframe Chart Overlay will display higher timeframe candles, including the number of candles high/low you specify.
You no longer need to switch timeframes to check the candles. Everything can be shown in one chart. MT4 Version : https://www.mql5.com/en/market/product/115680 Almost everything can be change as you want. You can change/set:
- Choose different colors for the body and top/bottom wicks.
- Panel's height and width.
- The width of the body and wicks
- Change backgrou

1. CONSTITUTION Goby Momentum it consists of two oscillator and three dynamic bands (upper, middler, lower). The inputs can be used to adjust the oscillators, the dynamic bands and the alert signals. 2. UTILITY This indicator detects the exhaustion of correction movements within a trend, thus giving entry points for new trades. Entry signals can be generated for both smaller timeframes (>M5) and larger ones (<H1). 3. OPERATION CONDITIONS Buy signal: When the Waterfall [thick line] is above the u
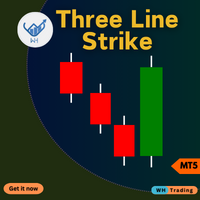
MetaTrader 5 (MT5) 用の ThreeLine Strike インジケーター 。この高度なツールは、市場における潜在的な反転を正確かつ簡単に特定できるように設計されています。
初心者でも経験豊富なトレーダーでも、このインジケーターは取引の意思決定を強化し、利益を最大化することができます。 Contact me after purchase for guidance 主な特徴: 正確な反転シグナル : テクニカル分析で実証済みのローソク足形成である 3 本のラインのストライク パターンに基づいて、潜在的なトレンドの反転を検出します。 カスタマイズ可能な設定 : ストライクパターン、時間枠、視覚的な設定を調整可能なパラメータを使用して、インジケーターを自分の取引スタイルに合わせてカスタマイズします。 リアルタイムアラート : 3 本の線のストライクパターンが形成されると即座に通知が届くので、重要な市場機会を逃すことはありません。 ユーザーフレンドリーなインターフェース : 直感的なデザインにより、シグナルを簡単に解釈し、取引戦略に統合できます。 互換性 : 既存の MT

Description of work
The 'MA7 Clover' indicator is based on candle shapes. Shows the 'Pin Bar' candle pattern. Detailed information about the 'MA7 Clover' indicator.
Indicator settings
General settings: Min body size ; Max body size ; Min nose size ; Max nose size .
Message settings: Send message to the terminal (Alert) – permission to send messages to the terminal using the Alert function; Send message to the mobile terminal (Push) – permission to send messages to the mobile terminal using
To download MT4 version please click here. - This is the exact conversion from TradingView: "Sentiment Range Ma" By "ChartPrime". - This is a non-repaint and light processing load indicator - You can message in private chat for further changes you need. - All input options are available. - Buffers are available for processing within EAs. - Highlight option is omitted as does not show good in Metatrader.

To download MT4 version please click here .
- This is the exact conversion from TradingView: " PA-Adaptive Hull Parabolic " By "Loxx".
- This is a non-repaint and light processing load indicator
- You can message in private chat for further changes you need.
- All input options are available.
- Buffers are available for processing within EAs.
- Highlight option is omitted as does not show good in Metatrader.

This DYJ PowerSignalSource is a complete trading system based on ATR technical indicators. This indicator will analyze and record the trend intensity of each cycle and current currency pair from M1-MN
DYJ PowerSignalSource creates a trend intensity and entry point signal list display by evaluating this data. When the trend percentage reaches 75% or greater, we consider it a strong currency. If the trend intensity percentage reaches 100%, we consider it the strongest, and a warning will pop up
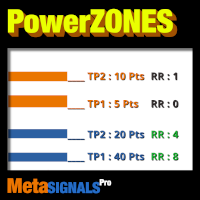
3,4,5回タッチされた戦略ゾーンを即座に取得し、価格を磁化します。 | パワーゾーンに応じたTP1/TP2/TP3のポイントまたはバリューを自動的に取得します。 | リスクとリワードの比率の安全性を視覚的にチェックします。 非リペイント、非遅延インディケータ - マニュアルおよび自動売買に最適 - すべての資産、すべての時間単位に対応 購入後、 推奨セッティングについては、このチャンネルで私に連絡してください。 MT4 バージョン BladeSCALPER と TrendDECODER を使った完全な方法を入手する
主な特徴
1. ダイナミックパワーゾーン: 本当に強いサポートとレジスタンスレベルを瞬時に視覚化し、正確なエントリー、ストップロス、TP1/2/3を可能にします。
2. カスタマイズ可能なアラート: ブレイクアウトイベントのカスタマイズ可能なアラートで、潜在的な取引機会をお知らせします。
3. マルチタイムフレーム分析: 異なるタイムフレームをシームレスに切り替えて、市場トレンドとプライスアクションを包括的に把握できます。
外国為替市場で成功したいですか? 当社の革新的な AI Swing Trading インジケーターは、取引を成功させ収益性を高めるための秘密の鍵です。 このユニークなツールを紹介します。
私たちのインジケーターには、膨大な量のデータを分析し、変化を特定し、価格変動を予測できる内蔵ニューラルネットワークが装備されています。 このテクノロジーにより、詳細な市場分析に基づいて、情報に基づいた取引の意思決定を行うことができます。 インジケーターのアルゴリズムは、フィボナッチレベル、プライスアクション、ボリュームに基づいています。 これにより、数学的パターンに基づいて潜在的な参入ポイントと市場参入ポイントを正確に特定することができます。 AI Swing Trading は、 M30 時間枠の EURUSD 通貨ペアで使用する必要があります。 AI Swing Trading インジケーターは静止していません。 作業の過程で、変化する市場状況に適応して、常に最適化されます。 これは、市場が変化しても常に一歩先を行くことができることを意味します。
AI Swing Tradin

1. CONSTITUTION Salmon Momentum is an indicator consisting of two momentum oscillators (Waterfall and Salmon) and three dynamic bands (upper, middler and lower). 2. OPERATION CONDITIONS Buy signal: When the Waterfall [thick line] is above the upper band. Salmon [dotted line] crosses the upper band from the lower band. Sell signal: When the Waterfall [thick line] is below the lower band. Salmon [dotted line] crosses the lower band from the upper band. Use a trend filter, for example, EMA
Heikin Ashi candlesticks smooth out the price data to help traders spot trends and patterns in the market. By averaging the price values, these candlesticks provide a clearer visual representation, making it easier to identify trends and predict future movements without the noise of standard candlesticks. We at Minions Labs are revisiting this topic because of our fellow Swing Traders, who love Heikin Ashi.
WHY SHOULD I CARE about the Smart Heikin Ashi? The Smart Heikin Ashi is an innovative
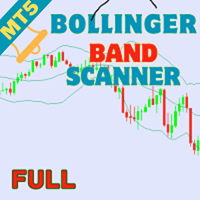
Welcome to the next level of trading sophistication with the Bollinger Bands Scanner for MT5! Elevate your trading experience and unlock enhanced insights and efficiency with our powerful MT5 indicator. Key Features: Effortless Bollinger Bands Scanning: Seamlessly harness the power of the Bollinger Bands Scanner to scan multiple assets effortlessly. Receive instant alerts when specific Bollinger Bands conditions are met, ensuring you're always ahead of market movements. Comprehensive Dashboard I
RSI Pro Analyzer インジケーターは、複数の時間枠にわたって同時に情報に基づいた意思決定を行いたいトレーダー向けに設計された強力なツールです。 このインジケーターは RSI を使用して買われすぎ、売られすぎ、トレンドのシグナルを提供し、市場参入の機会を特定しやすくします。 その主な利点は、さまざまな市場状況を示す明確で明確なカラーコードのおかげで読みやすいことです。
このインジケーターは RSI 値と関連シグナルを 5 つの異なる時間枠 (D、H4、H1、M30、M15) で表示するため、トレーダーは包括的な市場の視点を取得し、複数の時間軸で情報に基づいた意思決定を行うことができます。
色の変化を使用して、さまざまな時間枠にわたる傾向と反転の可能性を特定します。 買われすぎ領域と売られすぎ領域を探して、逆トレンドまたはトレンド反転の取引機会を見つけます。
赤: RSI は下降傾向を示します。
緑: RSI は上昇傾向を示します。
濃い赤: RSI は売られ過ぎ領域を示します。
濃い緑色: RSI は買われ過ぎゾーンを示します。
また、ポップアップ
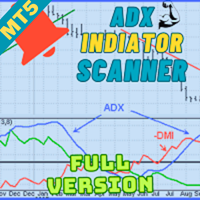
Welcome to advanced trading with the ADX Multicurrency Scanner for MT5! Elevate your trading experience with our powerful MT5 indicator, meticulously designed to offer seamless currency scanning and real-time insights. Key Features: Effortless Multicurrency Scanning: Unlock the full potential of the ADX Multicurrency Scanner for MT5 by effortlessly scanning multiple currencies. Receive instant alerts when specific conditions are met, ensuring you stay ahead of the market and capitalize on every
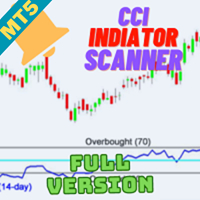
Welcome to the world of advanced trading with the CCI Multicurrency Scanner for MT5! Elevate your trading experience with our powerful MT5 indicator meticulously designed for seamless analysis and real-time insights. Key Features: Effortless CCI Scanning: Unlock the full potential of the CCI Multicurrency Scanner for MT5 by effortlessly scanning multiple currency pairs. Receive instant alerts when specific Commodity Channel Index (CCI) conditions are met, ensuring you stay ahead of market moveme

The DYJ StochasticSignalSource is displayed as two lines. The main line is called %K. The second line, called %D, is a Moving Average of %K. The %K line is usually displayed as a solid line and the %D line is usually displayed as a dotted line. There are several ways to interpret a Stochastic Oscillator. four popular methods include: Buy when the Oscillator (either %K or %D) falls below a specific level (for example, 20) . Sell when the Oscillator rises above a specific level (for example, 80)
Welcome to the world of advanced trading with the MACD Multicurrency Scanner for MT5! Elevate your trading experience with our powerful MT5 indicator meticulously designed for seamless analysis and real-time insights. Key Features: Effortless MACD Scanning: Unlock the full potential of the MACD Multicurrency Scanner for MT5 by effortlessly scanning multiple currency pairs. Receive instant alerts when specific Moving Average Convergence Divergence (MACD) conditions are met, ensuring you stay ahea

This indicator obeys the popular maxim that: "THE TREND IS YOUR FRIEND" It paints a Blue line for BUY and also paints a RED line for SELL. (you can change the colors). It gives alarms and alerts of all kinds. IT DOES NOT REPAINT COLOR and can be used for all currency pairs and timeframes. Yes, as easy and simple as that. Even a newbie can use it to make great and reliable trades. https://www.mql5.com/en/market/product/115553

Welcome to the future of trading! Are you ready to elevate your trading game to new heights? Introducing a groundbreaking trading indicator that is set to redefine the way you approach the markets. With its unparalleled features and cutting-edge technology, this indicator is not just another tool in your arsenal – it's your secret weapon for success. Imagine having access to real-time alerts that keep you ahead of the curve, ensuring you never miss a lucrative opportunity. Picture a tool that w
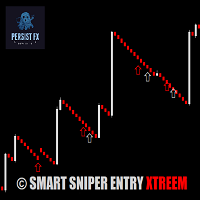
The Smart Sniper Entry XTREEM Spike Detector is a cutting-edge indicator specifically designed for traders who focus on the volatile Boom and Crash markets. This powerful tool detects spikes with an impressive 85% accuracy when combined with price action analysis.
*Key Features:*
- *High Accuracy:* 85% accuracy in detecting spikes, ensuring you can make informed trading decisions - *Market Specific:* Optimized for Boom and Crash markets, providing precise signals in these volatile environme

ATR バンド アラートは、チャネル幅が定数乗数 (「乗数」) と「平均真の範囲」インジケーターの値として計算されるチャネル インジケーターです。ボリンジャー バンドとは異なり、帯域幅はそれほど頻繁に変更されません。ATR バンド アラート インジケーターでは、バンドは長い直線になることがよくあります。
ATR バンド アラートの解釈は、価格がほとんどの時間バンド内に収まっているという事実に基づいており、価格がいずれかの境界に到達した場合はトレンドの変化を示している可能性があります。
このインジケーターの機能は次のとおりです。 価格がバンドを超えた場合、ブレイクアウトに向かうトレンドの継続が予想されます。
このインジケーターは、DRAW_COLOR_BARS スタイル(色付きのバー)を使用します(色付きのローソク足と混同しないでください)。したがって、チャートをバー表示モードに切り替えることをお勧めします。
トレンドが反転した場合、インジケーターは買い矢印または売り矢印を表示します。これらの矢印のコードは、それぞれ「買い矢印コード」および「売り矢印コード」パラメータで
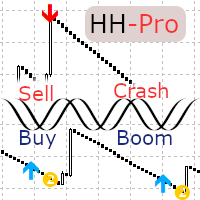
Finally, Harmonic Hybrid Pro is now available with numerous new features. It is highly recommended for utilization with Boom and Crash Synthetics. This tool generates a maximum of two orders per session and is designed to provide buy and sell signals in line with the current trend, effectively filtering out any superfluous signals. Users can optimize settings in the input section of the indicator properties. While the default configuration is suitable for Boon 500, adjustments may be necessary f

The DYJ SignalSourceOfMACD is based on the MACD indicator. Generally, signals are generated when crossing the MACD and SIGNAL lines of the MACD indicator. Signals to buy are generated if the MACD line crosses over the SIGNAL line in the negative area below the MACD open level. The negative area is where the values of MACD and SIGNAL lines are below zero. The MACD open level parameter is set in pips. However, in the code it is converted as follows: MACD Open level * Instrument.PipSize. For exa
DYJ SignalSourceOfRSI is a momentum oscillator which shows price strength by comparing upward movements of Close prices to their downward movements over a selected number of periods. There are two kinds of signals provided by RSI: RSI reaching of either overbought or oversold level and then making a bit of reversal: Signals to buy are generated falling of RSI below level( 30) and Signals to sell are generated rising of RSI above level( 70) Falling of RSI below level( 30) and then rising abo

Do you want to know how an economic event will impact price? What will happen to price after the news? How has an economic news affected price in the past? This indicator can help you with that.
Do you like technical analysis? Do you enjoy studying the tick history to predict the future? But what do you think could be more important than technical analysis, what could improve technical analysis? Of course, it's fundamental analysis! After all, economic events directly impact the market, and t

TrendEdge Indicator
Limited-time Special Opportunity: Seize the moment! Be among the first 10 (Purchasing 1/10) to seize this unique opportunity, and not only will you acquire a top-tier trading algorithm but also enjoy an exclusive discount. Don’t delay; this could be your key to trading success with just a few clicks. Grab it now and prepare to elevate your trading experience! Note: This offer is available solely to the first 10 purchasers. Don’t mis out on this one-of-a-kind chance! Descri

MACD is probably one of the most popular technical indicators out there. When the market is trending, it actually does a pretty good job, but when the market starts consolidating and moving sideways, the MACD performs not so well. SX Impulse MACD for MT4 is available here . Impulse MACD is a modified version of MACD that works very well for trading Forex, stocks, and cryptocurrencies. It has its own unique feature which perfectly filters out the values in a moving average range and enables it
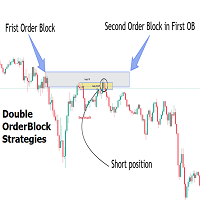
Introduction
The Price Action, styled as the "Smart Money Concept" or "SMC," was introduced by Mr. David J. Crouch in 2000 and is one of the most modern technical styles in the financial world. In financial markets, Smart Money refers to capital controlled by major market players (central banks, funds, etc.), and these traders can accurately predict market trends and achieve the highest profits.
In the "Smart Money" style, various types of "order blocks" can be traded. This indicator
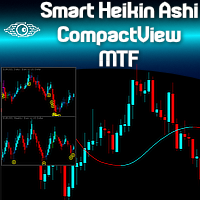
Are you already a fan of the Minions Labs Smart Heikin Ashi chart analysis tool? Or perhaps you're looking for a versatile Heikin Ashi chart capable of operating across multiple timeframes? Want to see the bigger picture before diving into the details, to make smarter ENTRY decisions? Do you want to build your own Dashboard of Symbols in just one chart, without dealing with messy multi-window MT5 stuff? Welcome to the Minions Labs Smart Heikin Ashi CompactView MTF indicator! Please see the power

The indicator illustrates the divergence between the price movements of two financial instruments, such as EURUSD and GBPUSD or US500 and US30 or Gold and Silver. These divergences are plotted in the form of segments on the price chart of the dominant instrument. The dominant instrument refers to the one that exhibits a stronger bullish trend in the case of a bullish divergence, or a stronger bearish trend in the case of a bearish divergence. Investors are encouraged to independently seek correl

This simple yet remarkably effective trend-continuation and breakout indicator acts as a powerful tool designed to aid traders in distinguishing genuine trend extensions from false breakouts. Through the utilization of a unique three-time-unit correctional phase guideline, it provides clear signals, offering trading opportunities with attractive risk-reward ratios.
Key Features Reliable Signals: The indicator confirms a genuine trend continuation or breakout if the price continues to trade h

The Ultimate Trend and Reversals Detector The Ultimate Trend and Reversals Detector is a powerful tool designed to identify potential trend reversal zones in the financial markets. Here are the key features: Objective : Detect trend directions and reversals. Signal Colors : Green : Indicates a potential bullish trend reversal. Red : Signals a potential bearish trend reversal. Non-Repainting : The indicator’s signals are not redrawn, providing reliable information. Suitable for All Styles : Scal

Introduction
"Smart money" is money invested by knowledgeable individuals at the right time, and this investment can yield the highest returns.
The concept we focus on in this indicator is whether the market is in an uptrend or downtrend. The market briefly takes a weak and reversal trend with "Minor BoS" without being able to break the major pivot.
In the next step, it returns to its main trend with a strong bullish move and continues its trend with a "Major BoS". The "order bloc
The indicator determines the ATR value (points) in a classic way (taking into calculation paranormal bars/candles) and more correctly - ignoring paranormal movements of the Instrument. Correctly it is excluding paranormal bars from the calculation, extremely small bars (less than 5% of the standard ATR) and extremely large bars (more than 150% of the standard ATR) are ignored. The Extended version - allows you to set calculation parameters and a lot of other input parameters Version for МТ4 ->

Introduction
The "Smart Money Concept" transcends mere technical trading strategies; it embodies a comprehensive philosophy elucidating market dynamics. Central to this concept is the acknowledgment that influential market participants manipulate price actions, presenting challenges for retail traders.
As a "retail trader", aligning your strategy with the behavior of "Smart Money," primarily market makers, is paramount. Understanding their trading patterns, which revolve around supply
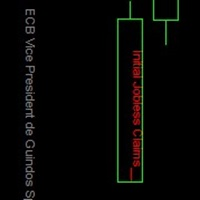
This is one of the most powerful indicators I've ever made.
I was tired of looking at other windows/websites for economical news, and regularly something would happen without me realising.
So I made this indicator which displays all news at the exact time of arrival, directly on the charts!
Now you too can just focus on the charts and know that you won't miss any news events.
There are options:
1. You can choose to display on the price line, or at the bottom of the chart. 2. You can
This is one of my most important indicators. Did you ever miss the session open/close? I did, which is why I made this indicator. It took a long time to get this right, since depending on your platform and timezone, it can be incorrect. It should be accurate for everyone now. It takes into account Daylight savings for NY and EU timezones, and should just work like magic on your charts.
## Check screenshots to see proof that this indictor is a must! ##
Do you hate having to have a Monthly, Weekly, Daily chart when looking at your lower timeframes? I hated it too, so I made this. It will show you the High and Low of other timeframes on your chart, so you will always be aware where some support/resistance may be! Even on the 1 minute chart!
I recommend you use it 3 times, one with Day, Week and Month selected with different line widths.
I use this on every chart I look at

Description: The Spike Sniper Crash Market Indicator is a sophisticated tool designed to identify and navigate volatile market conditions, often associated with sudden price spikes and market crashes. Leveraging advanced algorithms and technical analysis, this indicator serves as a vigilant guardian, alerting traders to potential market disruptions and providing actionable insights to mitigate risks and capitalize on opportunities. Key Features: Precision Spike Detection: The indicator employs c

The indicator determines the ATR value (points) in a classic way (taking into calculation paranormal bars/candles) and more correctly - ignoring paranormal movements of the Instrument. Correctly it is excluding paranormal bars from the calculation, extremely small bars (less than 5%( customizable ) of the standard ATR) and extremely large bars (more than 150% ( customizable ) of the standard ATR) are ignored. This is a Extended version - allows you to set calculation parameters a
This indicator obeys the popular maxim that: "THE TREND IS YOUR FRIEND" Channel indicators incorporate volatility to capture price action. The Bollinger Bands is widely used, however, there are other options to capture swing action opportunities. Each study you will find here is unique, and reveals different types of price action.
https://www.mql5.com/en/market/product/116256
https://www.mql5.com/en/market/product/115553

MultiFractal Levels MultiFractal Levels – は、レベルを追加して修正された Bill Williams フラクタル インジケーターです。 フラクタルは、設定で許可されているすべての TF から構築されます。
レベルは、価格によってまだテストされていない最新のフラクタルにのみ基づいて構築されます。 オリジナルのターミナルインジケーターに比べて次のような利点があります。 利便性 可視性 有益性 最新レベル カスタマイズ可能なフラクタル カスタマイズ可能なレベル このインジケーターは、作業中に別の時間枠に切り替える必要がないため便利です。
可視性 - 1 つのチャートで、小規模市場から中規模市場、および大規模市場の動きまでのチャートの構造を確認できます。
情報コンテンツ - グラフィックスに関するより多くの情報を視覚的に取得します。
カスタム フラクタルは 2 つの側面から変更できます。左右のバーの数は設定で指定できます。
カスタマイズ可能なレベルは変更できます。極端値に従って描画するか、信号の影 (中央のローソク足) に従ってゾー

This is the MT5 version of Ku-Chart.
This is an indicator devised by Ku-chan, a famous Japanese trader, based on the dealings of Lehman Brothers' discretionary traders. Unify the measuring stick of currencies to display the true value of currencies.
Although it is an indicator, it does not use a buffer and is displayed using objects such as trend lines. Also, instead of drawing on the subchart, it is drawn in an area far above the current price of the main chart, so you can switch from the

Introduction
The "Smart Money Concept" transcends the realm of mere technical trading strategies to embody a comprehensive philosophy on the dynamics of market operations. It posits that key market participants engage in price manipulation, thereby complicating the trading landscape for smaller, retail traders.
Under this doctrine, retail traders are advised to tailor their strategies in alignment with the maneuvers of "Smart Money" - essentially, the capital operated by market makers

Introducing our state-of-the-art Wave Indicator, meticulously designed for the discerning traders of the MQL5 community! At the core of this innovative tool lies an unmatched sensitivity to capture even the slightest market movements. Our Wave Indicator serves as the foundational element for constructing comprehensive trading strategies, providing you with an unwavering edge in the dynamic world of finance. Whether you're aiming to refine short-term tactics or develop long-term systems, this ind
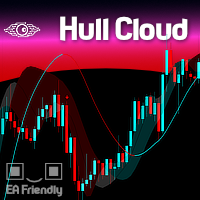
The Hull Moving Average is known for its ability to reduce lag and provide a clearer, more accurate depiction of market trends. By smoothing price data more effectively than traditional moving averages, it helps traders identify trend directions and reversals with greater precision. The Hull Cloud indicator elevates this by using four Hull Moving Averages working together like an orchestra. This combination creates a dynamic system that highlights short, medium, and long-term trends, giving trad
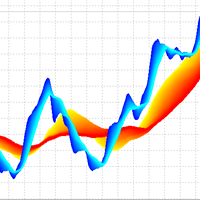
3D Trend Indicator is a non-repaint indicator using multiple moving averages with a 3D surface view. By using this indicator, you can remove uncertainties that can happen using a single and fixed moving average period. You can use a cloud area using a range of moving average periods. Also a wide range of visual settings are added to this indicator to have a better view from the cloud area. Alert and notification system added to the indicator to inform the trader about the action of candles on t
Apresentamos o Indicador de novo grafico - uma ferramenta poderosa para traders que buscam uma análise de preço suave e clara. Este indicador inovador calcula a média simples dos preços, oferecendo uma visão precisa e ajustada dos movimentos do mercado. Como Funciona : O Indicador de Média de Preços Simples (SMA) utiliza uma fórmula simples e eficaz: Ele soma o valor do último preço com o preço anterior. Em seguida, divide essa soma por 2 para obter a média. Fórmula : SMA = U ˊ ltimo Pre c ¸ o +

MinMax Levels MinMax Levels – は、重要な取引期間 (日、週、月) の最高値、最低値、始値レベルを示す指標です。
各外国為替市場参加者は、取引システムのレベルを使用します。 それらは、トランザクションを行うための主なシグナルであることも、分析ツールとして機能する追加のシグナルであることもできます。 この指標では、大規模な市場参加者の主要な取引期間であるため、日、週、月が重要な期間として選択されました。 ご存知のとおり、価格はレベルからレベルへと移動するため、重要なレベルに対する価格の位置を把握しておくと、取引の意思決定を行う際に有利になります。 また、便宜上、両方のレベル自体を有効または無効にするためのボタンが追加されており、ボタンを折りたたんで価格チャートの作業ウィンドウのスペースを空けることができます。
各外国為替市場参加者は、取引システムのレベルを使用します。 それらは、トランザクションを行うための主なシグナルであることも、分析ツールとして機能する追加のシグナルであることもできます。 この指標では、大規模な市場参加者の主要な取引期

Description of the Indicator The indicator "BullsBearsPulse" is designed for MetaTrader 5 and provides a visual representation of the Bulls Power and Bears Power indicators. These indicators are useful tools for technical analysis, particularly for the EUR/USD currency pair, to help traders identify potential trading opportunities. Functionality Bulls Power : This indicator measures the strength of the bulls (buyers) in the market. It calculates the difference between the highest price and a 20

The Engulf Seeker indicator is a powerful tool designed to detect engulfing candlestick patterns with precision and reliability. Built on advanced logic and customizable parameters, it offers traders valuable insights into market trends and potential reversal points.
Key Features and Benefits: Utilizes revised logic to analyze previous candles and identify strong bullish and bearish engulfing patterns. Convenient arrow-based alert system notifies traders of pattern occurrences on specific symb

This spread indicator displays the actual spread of each candle. It highlights the maximum spread and the minimum spread of the chosen symbol. This indicator is very helpful to see in real time the spread evolution helping to avoid taking a trade when the spread is too high.
Inputs:
Print value in Points: if true displays the spread as a whole number
D isplay minimum and maximum spread of the past N days: select the number of days to consider the maximum and minimum spread
Automatically
===>この指標は何をしますか? 彼は時間枠を選択して平均SMAを1つだけ描いています
このインジケーターをグラフィックに、平均が必要な場合に何度も配置します。
平均のパラメーターと特性を選択してください。 ****スクリーンショット01〜02を参照してください
この平均をあなた自身のコード、別のインジケーター、またはEAに簡単に統合するためのICUSTOMコードを私に尋ねることを躊躇しないでください
選ぶ ターゲットの時間枠 期間数 遅延 望ましいOHLC トレンディな色 「William210」という名前で、CodeBaseとMarketplaceですべての出版物を見つけることができます。
===>いくつかの例 マルチフレームモバイル平均を使用する簡単な例を次に示します
ビットコインの例 2つのモバイルを追加する平均20、1つは毎日1つ、H6に1つをH1に表示します **** 3〜5のスクリーンショットを参照してください
S&P500の例 3つのモバイルを追加して、毎日の高、中央値の価格に適用され、H1を見てください **** 6〜7のスクリーンシ
===>この指標は何をしますか? 彼は時間枠を選択して平均EMAを1つだけ描いています
このインジケーターをグラフィックに、平均が必要な場合に何度も配置します。
平均のパラメーターと特性を選択してください。 ****スクリーンショット01〜02を参照してください
この平均をあなた自身のコード、別のインジケーター、またはEAに簡単に統合するためのICUSTOMコードを私に尋ねることを躊躇しないでください
選ぶ ターゲットの時間枠 期間数 遅延 望ましいOHLC トレンディな色 「William210」という名前で、CodeBaseとMarketplaceですべての出版物を見つけることができます。
===>いくつかの例 マルチフレームモバイル平均を使用する簡単な例を次に示します
ビットコインの例 2つのモバイルを追加する平均20、1つは毎日1つ、H6に1つをH1に表示します **** 3〜5のスクリーンショットを参照してください
S&P500の例 3つのモバイルを追加して、毎日の高、中央値の価格に適用され、H1を見てください **** 6〜7のスクリーンシ
===>この指標は何をしますか? 彼は時間枠を選択して平均SMMAを1つだけ描いています
このインジケーターをグラフィックに、平均が必要な場合に何度も配置します。
平均のパラメーターと特性を選択してください。 ****スクリーンショット01〜02を参照してください
この平均をあなた自身のコード、別のインジケーター、またはEAに簡単に統合するためのICUSTOMコードを私に尋ねることを躊躇しないでください
選ぶ ターゲットの時間枠 期間数 遅延 望ましいOHLC トレンディな色 「William210」という名前で、CodeBaseとMarketplaceですべての出版物を見つけることができます。
===>いくつかの例 マルチフレームモバイル平均を使用する簡単な例を次に示します
ビットコインの例 2つのモバイルを追加する平均20、1つは毎日1つ、H6に1つをH1に表示します **** 3〜5のスクリーンショットを参照してください
S&P500の例 3つのモバイルを追加して、毎日の高、中央値の価格に適用され、H1を見てください **** 6〜7のスクリーン
===>この指標は何をしますか? 彼は時間枠を選択して平均LWMAを1つだけ描いています
このインジケーターをグラフィックに、平均が必要な場合に何度も配置します。
平均のパラメーターと特性を選択してください。 ****スクリーンショット01〜02を参照してください
この平均をあなた自身のコード、別のインジケーター、またはEAに簡単に統合するためのICUSTOMコードを私に尋ねることを躊躇しないでください
選ぶ ターゲットの時間枠 期間数 遅延 望ましいOHLC トレンディな色 「William210」という名前で、CodeBaseとMarketplaceですべての出版物を見つけることができます。
===>いくつかの例 マルチフレームモバイル平均を使用する簡単な例を次に示します
ビットコインの例 2つのモバイルを追加する平均20、1つは毎日1つ、H6に1つをH1に表示します **** 3〜5のスクリーンショットを参照してください
S&P500の例 3つのモバイルを追加して、毎日の高、中央値の価格に適用され、H1を見てください **** 6〜7のスクリーン

RAR(Relative Adaptive RSI)インディケーターでトレーディング戦略を最適化しましょう! この高度なテクニカル分析インディケーターは、相対力指数(RSI)の力を適応技術と組み合わせ、一般的なオシレーターよりも正確で信頼性の高いシグナルを提供します。 RARインディケーターとは? RARはMetaTrader 5用に設計されたインディケーターで、指数移動平均(EMA)と適応移動平均(AMA)を使用してRSIを平滑化し、市場の状況に動的に適応させます。この革新的な組み合わせにより、市場のトレンドと強さの変化をより正確かつ迅速に検出することができます。 RARインディケーターの利点 動的適応性 : RARは市場の変化する条件に自動的に適応し、従来のRSIと比較してシグナルの精度を向上させます。 市場ノイズの削減 : EMAとAMAを使用してRSIを平滑化し、市場ノイズを減少させ、より明確で信頼性の高いシグナルを提供します。 直感的な視覚化 : カラーヒストグラムを含み、市場のトレンドと強さの変化を識別しやすくし、より情報に基づいたトレーディングの意思決定を支援します。 効
=== > このインジケーターは何をするのですか? ATRに基づいてスーパートレンドを表すラインを描きます。
選ぶ ATR倍率 ATR期間 それがすべてです!!! **** スクリーンショット 01 から 2 を参照
この SuperTrend を独自のコードに簡単に統合するための iCustom コードについて、お気軽にお問い合わせください。
=== > ビットコインの例 **** スクリーンショット 03 を参照
=== > 誰のため? あなたが裁量トレーダー、アルゴリズムトレーダー、または開発者であっても、インジケーターはあなたのニーズを満たすように設計されています。私はお金が関係する場合、信頼性と効率性の重要性を理解しており、この責任を非常に真剣に受け止めています。
インジケーターは PC または VPS 上のリソースをほとんど消費しません。
アルゴリズムトレーダーと開発者のために、両方のバッファへの完全なアクセスを提供します。 SuperTrend 値用のバッファ 1 スーパートレンドの方向用のバッファ 2
=== > なぜですか? ATR の

This is the test product. Please, DO NOT BUY IT! This is the test product. Please, DO NOT BUY IT! This is the test product. Please, DO NOT BUY IT! This is the test product. Please, DO NOT BUY IT! This is the test product. Please, DO NOT BUY IT! This is the test product. Please, DO NOT BUY IT! This is the test product. Please, DO NOT BUY IT! This is the test product. Please, DO NOT BUY IT!
MetaTraderマーケットは、履歴データを使ったテストと最適化のための無料のデモ自動売買ロボットをダウンロードできる唯一のストアです。
アプリ概要と他のカスタマーからのレビューをご覧になり、ターミナルにダウンロードし、購入する前に自動売買ロボットをテストしてください。完全に無料でアプリをテストできるのはMetaTraderマーケットだけです。
取引の機会を逃しています。
- 無料取引アプリ
- 8千を超えるシグナルをコピー
- 金融ニュースで金融マーケットを探索
新規登録
ログイン