Guarda i video tutorial del Market su YouTube
Come acquistare un Robot di Trading o un indicatore
Esegui il tuo EA
hosting virtuale
hosting virtuale
Prova un indicatore/robot di trading prima di acquistarlo
Vuoi guadagnare nel Market?
Come presentare un prodotto per venderlo con successo
Indicatori tecnici a pagamento per MetaTrader 5 - 39

Higher Timeframe Chart Overlay will display higher timeframe candles, including the number of candles high/low you specify.
You no longer need to switch timeframes to check the candles. Everything can be shown in one chart. MT4 Version : https://www.mql5.com/en/market/product/115680 Almost everything can be change as you want. You can change/set:
- Choose different colors for the body and top/bottom wicks.
- Panel's height and width.
- The width of the body and wicks
- Change backgrou

1. CONSTITUTION Goby Momentum it consists of two oscillator and three dynamic bands (upper, middler, lower). The inputs can be used to adjust the oscillators, the dynamic bands and the alert signals. 2. UTILITY This indicator detects the exhaustion of correction movements within a trend, thus giving entry points for new trades. Entry signals can be generated for both smaller timeframes (>M5) and larger ones (<H1). 3. OPERATION CONDITIONS Buy signal: When the Waterfall [thick line] is above the u
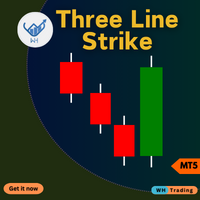
Indicatore di strike a tre linee per MetaTrader 5 (MT5). Questo strumento avanzato è progettato per aiutarti a identificare potenziali inversioni di mercato con precisione e facilità.
Che tu sia un principiante o un trader esperto, questo indicatore può migliorare le tue decisioni di trading e massimizzare i tuoi profitti. Contact me after purchase for guidance Caratteristiche principali: Segnali di inversione accurati : rileva potenziali inversioni di tendenza in base al modello di strike

Structure Blocks: a structured way to analyze market structure
This indicator is for you if you are a price action or smart money concept trader. It identifies market trends' ultimate highs and lows and intermediaries' swing lows and highs. It adjusts based on candles' body where most of the volume is, disregarding wicks. Need help or have questions? I am Lio , don't hesitate to reach out! I am always available to respond, help, and improve. How it works:
Each block consists of a move wit

Description of work
The 'MA7 Clover' indicator is based on candle shapes. Shows the 'Pin Bar' candle pattern. Detailed information about the 'MA7 Clover' indicator.
Indicator settings
General settings: Min body size ; Max body size ; Min nose size ; Max nose size .
Message settings: Send message to the terminal (Alert) – permission to send messages to the terminal using the Alert function; Send message to the mobile terminal (Push) – permission to send messages to the mobile terminal using
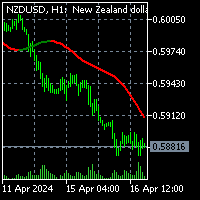
To download MT4 version please click here. - This is the exact conversion from TradingView: "Sentiment Range Ma" By "ChartPrime". - This is a non-repaint and light processing load indicator - You can message in private chat for further changes you need. - All input options are available. - Buffers are available for processing within EAs. - Highlight option is omitted as does not show good in Metatrader.

To download MT4 version please click here .
- This is the exact conversion from TradingView: " PA-Adaptive Hull Parabolic " By "Loxx".
- This is a non-repaint and light processing load indicator
- You can message in private chat for further changes you need.
- All input options are available.
- Buffers are available for processing within EAs.
- Highlight option is omitted as does not show good in Metatrader.

This DYJ PowerSignalSource is a complete trading system based on ATR technical indicators. This indicator will analyze and record the trend intensity of each cycle and current currency pair from M1-MN
DYJ PowerSignalSource creates a trend intensity and entry point signal list display by evaluating this data. When the trend percentage reaches 75% or greater, we consider it a strong currency. If the trend intensity percentage reaches 100%, we consider it the strongest, and a warning will pop up
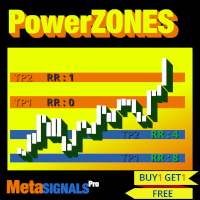
Selezionare le Zone strategiche colpite 3, 4, 5 >> Ottenere automaticamente il TP1/TP2/TP3 in punti o in valore >> Verificare immediatamente se il vostro rapporto rischio/rendimento Indicatore non tracciante e non ritardato - ideale per il trading manuale e automatizzato - adatto a tutti gli asset e a tutte le unità temporali Offerta limitata nel tempo - poi torna a >> 99$ Dopo l'acquisto, contattatemi su questo canale per le impostazioni personalizzate. Versione MT4
Caratteristiche pr
Vuoi avere successo nel mercato Forex? Il nostro innovativo indicatore AI Swing Trading è la tua chiave segreta per un trading di successo e redditizio. Ti presentiamo questo strumento unico:
Il nostro indicatore è dotato di una rete neurale integrata che consente di analizzare enormi quantità di dati, identificare i cambiamenti e prevedere i movimenti dei prezzi. Questa tecnologia ti consente di prendere decisioni di trading informate basate su un'analisi di mercato approfondita. L'algor

1. CONSTITUTION Salmon Momentum is an indicator consisting of two momentum oscillators (Waterfall and Salmon) and three dynamic bands (upper, middler and lower). 2. OPERATION CONDITIONS Buy signal: When the Waterfall [thick line] is above the upper band. Salmon [dotted line] crosses the upper band from the lower band. Sell signal: When the Waterfall [thick line] is below the lower band. Salmon [dotted line] crosses the lower band from the upper band. Use a trend filter, for example, EMA
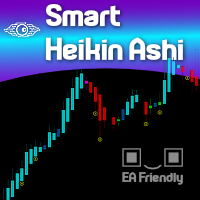
Heikin Ashi candlesticks smooth out the price data to help traders spot trends and patterns in the market. By averaging the price values, these candlesticks provide a clearer visual representation, making it easier to identify trends and predict future movements without the noise of standard candlesticks. We at Minions Labs are revisiting this topic because of our fellow Swing Traders, who love Heikin Ashi.
WHY SHOULD I CARE about the Smart Heikin Ashi? The Smart Heikin Ashi is an innovative
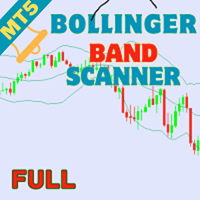
Welcome to the next level of trading sophistication with the Bollinger Bands Scanner for MT5! Elevate your trading experience and unlock enhanced insights and efficiency with our powerful MT5 indicator. Key Features: Effortless Bollinger Bands Scanning: Seamlessly harness the power of the Bollinger Bands Scanner to scan multiple assets effortlessly. Receive instant alerts when specific Bollinger Bands conditions are met, ensuring you're always ahead of market movements. Comprehensive Dashboard I
L'indicatore RSI Pro Analyser è un potente strumento progettato per i trader che desiderano prendere decisioni informate su più intervalli di tempo contemporaneamente. Questo indicatore utilizza l'RSI per fornire segnali di ipercomprato, ipervenduto e di tendenza, rendendo più semplice identificare le opportunità di ingresso nel mercato. Il suo vantaggio principale è la facilità di lettura grazie ai codici colore chiari e distinti per indicare le diverse condizioni di mercato.
L'indicatore mo
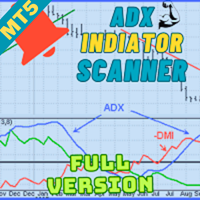
Welcome to advanced trading with the ADX Multicurrency Scanner for MT5! Elevate your trading experience with our powerful MT5 indicator, meticulously designed to offer seamless currency scanning and real-time insights. Key Features: Effortless Multicurrency Scanning: Unlock the full potential of the ADX Multicurrency Scanner for MT5 by effortlessly scanning multiple currencies. Receive instant alerts when specific conditions are met, ensuring you stay ahead of the market and capitalize on every
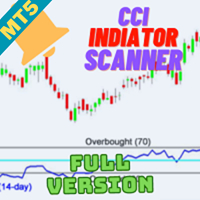
Welcome to the world of advanced trading with the CCI Multicurrency Scanner for MT5! Elevate your trading experience with our powerful MT5 indicator meticulously designed for seamless analysis and real-time insights. Key Features: Effortless CCI Scanning: Unlock the full potential of the CCI Multicurrency Scanner for MT5 by effortlessly scanning multiple currency pairs. Receive instant alerts when specific Commodity Channel Index (CCI) conditions are met, ensuring you stay ahead of market moveme

The DYJ StochasticSignalSource is displayed as two lines. The main line is called %K. The second line, called %D, is a Moving Average of %K. The %K line is usually displayed as a solid line and the %D line is usually displayed as a dotted line. There are several ways to interpret a Stochastic Oscillator. four popular methods include: Buy when the Oscillator (either %K or %D) falls below a specific level (for example, 20) . Sell when the Oscillator rises above a specific level (for example, 80)
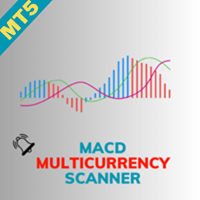
Welcome to the world of advanced trading with the MACD Multicurrency Scanner for MT5! Elevate your trading experience with our powerful MT5 indicator meticulously designed for seamless analysis and real-time insights. Key Features: Effortless MACD Scanning: Unlock the full potential of the MACD Multicurrency Scanner for MT5 by effortlessly scanning multiple currency pairs. Receive instant alerts when specific Moving Average Convergence Divergence (MACD) conditions are met, ensuring you stay ahea

This indicator obeys the popular maxim that: "THE TREND IS YOUR FRIEND" It paints a Blue line for BUY and also paints a RED line for SELL. (you can change the colors). It gives alarms and alerts of all kinds. IT DOES NOT REPAINT COLOR and can be used for all currency pairs and timeframes. Yes, as easy and simple as that. Even a newbie can use it to make great and reliable trades. https://www.mql5.com/en/market/product/115553
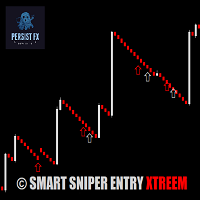
The Smart Sniper Entry XTREEM Spike Detector is a cutting-edge indicator specifically designed for traders who focus on the volatile Boom and Crash markets. This powerful tool detects spikes with an impressive 85% accuracy when combined with price action analysis.
*Key Features:*
- *High Accuracy:* 85% accuracy in detecting spikes, ensuring you can make informed trading decisions - *Market Specific:* Optimized for Boom and Crash markets, providing precise signals in these volatile environme

ATR Bands Alert è un indicatore di canale in cui la larghezza del canale viene calcolata come un moltiplicatore costante ("Moltiplicatore") e il valore dell'indicatore "Average True Range". A differenza delle bande di Bollinger, la larghezza di banda non viene modificata così spesso: nell'indicatore ATR Bands Alert, le bande spesso hanno lunghe linee rette.
L'interpretazione dell'ATR Bands Alert si basa sul fatto che il prezzo si trova all'interno delle bande per la maggior parte del tempo e,
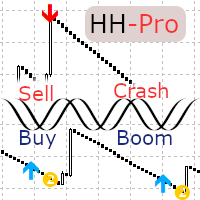
Finally, Harmonic Hybrid Pro is now available with numerous new features. It is highly recommended for utilization with Boom and Crash Synthetics. This tool generates a maximum of two orders per session and is designed to provide buy and sell signals in line with the current trend, effectively filtering out any superfluous signals. Users can optimize settings in the input section of the indicator properties. While the default configuration is suitable for Boon 500, adjustments may be necessary f
DYJ SignalSourceOfRSI is a momentum oscillator which shows price strength by comparing upward movements of Close prices to their downward movements over a selected number of periods. There are two kinds of signals provided by RSI: RSI reaching of either overbought or oversold level and then making a bit of reversal: Signals to buy are generated falling of RSI below level(30) and Signals to sell are generated rising of RSI above level(70) Falling of RSI below level(30) and then rising above level

Do you want to know how an economic event will impact price? What will happen to price after the news? How has an economic news affected price in the past? This indicator can help you with that.
Do you like technical analysis? Do you enjoy studying the tick history to predict the future? But what do you think could be more important than technical analysis, what could improve technical analysis? Of course, it's fundamental analysis! After all, economic events directly impact the market, and t

TrendEdge Indicator
Limited-time Special Opportunity: Seize the moment! Be among the first 10 (Purchasing 1/10) to seize this unique opportunity, and not only will you acquire a top-tier trading algorithm but also enjoy an exclusive discount. Don’t delay; this could be your key to trading success with just a few clicks. Grab it now and prepare to elevate your trading experience! Note: This offer is available solely to the first 10 purchasers. Don’t mis out on this one-of-a-kind chance! Descri

MACD is probably one of the most popular technical indicators out there. When the market is trending, it actually does a pretty good job, but when the market starts consolidating and moving sideways, the MACD performs not so well. SX Impulse MACD for MT4 is available here . Impulse MACD is a modified version of MACD that works very well for trading Forex, stocks, and cryptocurrencies. It has its own unique feature which perfectly filters out the values in a moving average range and enables it
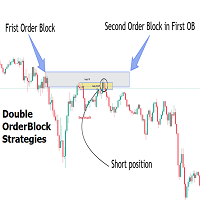
Introduction
The Price Action, styled as the "Smart Money Concept" or "SMC," was introduced by Mr. David J. Crouch in 2000 and is one of the most modern technical styles in the financial world. In financial markets, Smart Money refers to capital controlled by major market players (central banks, funds, etc.), and these traders can accurately predict market trends and achieve the highest profits.
In the "Smart Money" style, various types of "order blocks" can be traded. This indicator
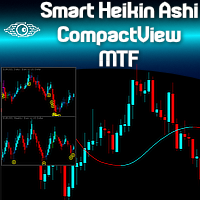
Are you already a fan of the Minions Labs Smart Heikin Ashi chart analysis tool? Or perhaps you're looking for a versatile Heikin Ashi chart capable of operating across multiple timeframes? Want to see the bigger picture before diving into the details, to make smarter ENTRY decisions? Do you want to build your own Dashboard of Symbols in just one chart, without dealing with messy multi-window MT5 stuff? Welcome to the Minions Labs Smart Heikin Ashi CompactView MTF indicator! Please see the power

The indicator illustrates the divergence between the price movements of two financial instruments, such as EURUSD and GBPUSD or US500 and US30 or Gold and Silver. These divergences are plotted in the form of segments on the price chart of the dominant instrument. The dominant instrument refers to the one that exhibits a stronger bullish trend in the case of a bullish divergence, or a stronger bearish trend in the case of a bearish divergence. Investors are encouraged to independently seek correl

Introduction
The "Smart Money Concept" transcends mere technical trading strategies; it embodies a comprehensive philosophy elucidating market dynamics. Central to this concept is the acknowledgment that influential market participants manipulate price actions, presenting challenges for retail traders.
As a "retail trader", aligning your strategy with the behavior of "Smart Money," primarily market makers, is paramount. Understanding their trading patterns, which revolve around supply
This is one of my most important indicators. Did you ever miss the session open/close? I did, which is why I made this indicator. It took a long time to get this right, since depending on your platform and timezone, it can be incorrect. It should be accurate for everyone now. It takes into account Daylight savings for NY and EU timezones, and should just work like magic on your charts.
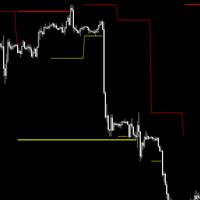
## Check screenshots to see proof that this indictor is a must! ##
Do you hate having to have a Monthly, Weekly, Daily chart when looking at your lower timeframes? I hated it too, so I made this. It will show you the High and Low of other timeframes on your chart, so you will always be aware where some support/resistance may be! Even on the 1 minute chart!
I recommend you use it 3 times, one with Day, Week and Month selected with different line widths.
I use this on every chart I look at

The Boom300 Spike Indicator is a powerful tool designed to identify significant price spikes in the market.
Key Features: Real-time Spike Detection: The indicator continuously scans the market for sudden spikes in price action, providing timely alerts when significant spikes occur. Customizable Alerts: Traders can customize alerts to suit their preferences, including audible alerts, email notifications, and push notifications to mobile devices. User-Friendly Interface: The indicator offers a

Description: The Spike Sniper Crash Market Indicator is a sophisticated tool designed to identify and navigate volatile market conditions, often associated with sudden price spikes and market crashes. Leveraging advanced algorithms and technical analysis, this indicator serves as a vigilant guardian, alerting traders to potential market disruptions and providing actionable insights to mitigate risks and capitalize on opportunities. Key Features: Precision Spike Detection: The indicator employs c

The indicator determines the ATR value (points) in a classic way (taking into calculation paranormal bars/candles) and more correctly - ignoring paranormal movements of the Instrument. Correctly it is excluding paranormal bars from the calculation, extremely small bars (less than 5%( customizable ) of the standard ATR) and extremely large bars (more than 150% ( customizable ) of the standard ATR) are ignored. This is a Extended version - allows you to set calculation parameters a
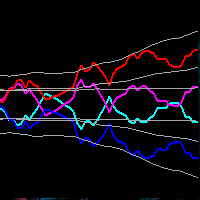
This indicator obeys the popular maxim that: "THE TREND IS YOUR FRIEND" Channel indicators incorporate volatility to capture price action. The Bollinger Bands is widely used, however, there are other options to capture swing action opportunities. Each study you will find here is unique, and reveals different types of price action.
https://www.mql5.com/en/market/product/116256
https://www.mql5.com/en/market/product/115553

MultiFractal Levels MultiFractal Levels – è un indicatore frattale di Bill Williams modificato con livelli aggiunti. I frattali sono costruiti da tutti i TF consentiti nelle impostazioni.
I livelli sono costruiti solo sulla base degli ultimi frattali che non sono ancora stati testati in termini di prezzo. Vantaggi rispetto all'indicatore terminale originale: Convenienza Visibilità Informatività Ultimi livelli Frattale personalizzabile Livelli personalizzabili L'indicatore è utile perché non è

This is the MT5 version of Ku-Chart.
This is an indicator devised by Ku-chan, a famous Japanese trader, based on the dealings of Lehman Brothers' discretionary traders. Unify the measuring stick of currencies to display the true value of currencies.
Although it is an indicator, it does not use a buffer and is displayed using objects such as trend lines. Also, instead of drawing on the subchart, it is drawn in an area far above the current price of the main chart, so you can switch from the

Introduction
The "Smart Money Concept" transcends the realm of mere technical trading strategies to embody a comprehensive philosophy on the dynamics of market operations. It posits that key market participants engage in price manipulation, thereby complicating the trading landscape for smaller, retail traders.
Under this doctrine, retail traders are advised to tailor their strategies in alignment with the maneuvers of "Smart Money" - essentially, the capital operated by market makers

Introducing our state-of-the-art Wave Indicator, meticulously designed for the discerning traders of the MQL5 community! At the core of this innovative tool lies an unmatched sensitivity to capture even the slightest market movements. Our Wave Indicator serves as the foundational element for constructing comprehensive trading strategies, providing you with an unwavering edge in the dynamic world of finance. Whether you're aiming to refine short-term tactics or develop long-term systems, this ind
Achieve the full potential of your trading indicator with XDashboard MT5, the ultimate dashboard indicator for MetaTrader 5. Designed for traders who demand precision and efficiency, XDashboard MT5 offers an unparalleled view of any indicator across multiple symbols and timeframes, all from a single, customizable interface. This price is for limited time Features: Custom Indicator Integration
Comprehensive Multi-Symbol Monitoring Multi-Timeframe Analysis User-Friendly Interface Real-Time U
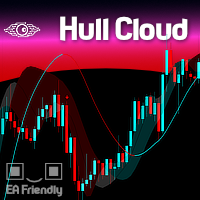
The Hull Moving Average is known for its ability to reduce lag and provide a clearer, more accurate depiction of market trends. By smoothing price data more effectively than traditional moving averages, it helps traders identify trend directions and reversals with greater precision. The Hull Cloud indicator elevates this by using four Hull Moving Averages working together like an orchestra. This combination creates a dynamic system that highlights short, medium, and long-term trends, giving trad
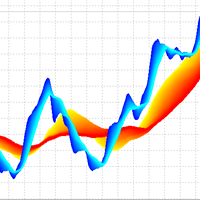
3D Trend Indicator is a non-repaint indicator using multiple moving averages with a 3D surface view. By using this indicator, you can remove uncertainties that can happen using a single and fixed moving average period. You can use a cloud area using a range of moving average periods. Also a wide range of visual settings are added to this indicator to have a better view from the cloud area. Alert and notification system added to the indicator to inform the trader about the action of candles on t
Apresentamos o Indicador de novo grafico - uma ferramenta poderosa para traders que buscam uma análise de preço suave e clara. Este indicador inovador calcula a média simples dos preços, oferecendo uma visão precisa e ajustada dos movimentos do mercado. Como Funciona : O Indicador de Média de Preços Simples (SMA) utiliza uma fórmula simples e eficaz: Ele soma o valor do último preço com o preço anterior. Em seguida, divide essa soma por 2 para obter a média. Fórmula : SMA = U ˊ ltimo Pre c ¸ o +

MinMax Levels MinMax Levels – è un indicatore dei livelli di prezzo massimo, minimo e di apertura per periodi di negoziazione importanti: giorno, settimana e mese.
Ogni partecipante al mercato Forex utilizza i livelli nel proprio sistema di trading. Possono essere il segnale principale per effettuare transazioni o un segnale aggiuntivo, fungendo da strumento analitico. In questo indicatore, giorni, settimane e mesi sono stati selezionati come periodi importanti, poiché sono i periodi chiav
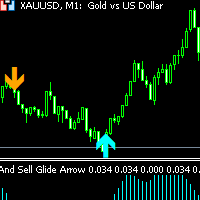
Buy and Sell Glide Arrow non-repaint and arrow appears on current candlestick orange arrow is a sell signal blue arrow is a buy signal Buy and Sell Glide Arrow works on 1 minute, 5 minutes and 15 minutes timeframes only as it is a scalping indicator. Pairs to trade: Forex pairs such as EURUSD,GBPUSD and other METALS: XAUUSD(GOLD) and other INDICES: Boom and crash 1000, Volatility Pairs such as VIX 10 - VIX 100 and other Lastly BTC AND LTC and other

Description of the Indicator The indicator "BullsBearsPulse" is designed for MetaTrader 5 and provides a visual representation of the Bulls Power and Bears Power indicators. These indicators are useful tools for technical analysis, particularly for the EUR/USD currency pair, to help traders identify potential trading opportunities. Functionality Bulls Power : This indicator measures the strength of the bulls (buyers) in the market. It calculates the difference between the highest price and a 20

The Engulf Seeker indicator is a powerful tool designed to detect engulfing candlestick patterns with precision and reliability. Built on advanced logic and customizable parameters, it offers traders valuable insights into market trends and potential reversal points.
Key Features and Benefits: Utilizes revised logic to analyze previous candles and identify strong bullish and bearish engulfing patterns. Convenient arrow-based alert system notifies traders of pattern occurrences on specific symb

This spread indicator displays the actual spread of each candle. It highlights the maximum spread and the minimum spread of the chosen symbol. This indicator is very helpful to see in real time the spread evolution helping to avoid taking a trade when the spread is too high.
Inputs:
Print value in Points: if true displays the spread as a whole number
D isplay minimum and maximum spread of the past N days: select the number of days to consider the maximum and minimum spread
Automatically
=== > Cosa fa questo indicatore? Come molti dei miei codici, è multi timeframe. Permettono di visualizzare, ad esempio, la trama di un quotidiano in H1.
Cerca tutti i miei codici (codebase e marketplace) con William210 Traccia un solo medio SMA con la scelta del periodo temporale
Questo indicatore mostra la tua grafica innanzitutto quando vieni venduto.
Queste impostazioni e le caratteristiche del tuo bambino ci sono tutte!!! **** Vedi screenshot da 01 a 02
Quando si tratta di dati ricc
=== > Cosa fa questo indicatore? Come molti dei miei codici, è multi timeframe. Permettono di visualizzare, ad esempio, la trama di un quotidiano in H1.
Cerca tutti i miei codici (codebase e marketplace) con William210 Traccia un solo medio EMA con la scelta del periodo temporale
Questo indicatore mostra la tua grafica innanzitutto quando vieni venduto.
Queste impostazioni e le caratteristiche del tuo bambino ci sono tutte!!! **** Vedi screenshot da 01 a 02
Quando si tratta di dati ricc
=== > Cosa fa questo indicatore? Come molti dei miei codici, è multi timeframe. Permettono di visualizzare, ad esempio, la trama di un quotidiano in H1.
Cerca tutti i miei codici (codebase e marketplace) con William210 Traccia un solo medio SMMA con la scelta del periodo temporale
Questo indicatore mostra la tua grafica innanzitutto quando vieni venduto.
Queste impostazioni e le caratteristiche del tuo bambino ci sono tutte!!! **** Vedi screenshot da 01 a 02
Quando si tratta di dati ric
=== > Cosa fa questo indicatore? Come molti dei miei codici, è multi timeframe. Permettono di visualizzare, ad esempio, la trama di un quotidiano in H1.
Cerca tutti i miei codici (codebase e marketplace) con William210 Traccia un solo medio LWMA con la scelta del periodo temporale
Questo indicatore mostra la tua grafica innanzitutto quando vieni venduto.
Queste impostazioni e le caratteristiche del tuo bambino ci sono tutte!!! **** Vedi screenshot da 01 a 02
Quando si tratta di dati ric

Benvenuto nel futuro del trading con KMeans Price Zones Detector, un innovativo indicatore per MetaTrader che sfrutta la potenza del machine learning per identificare le zone di prezzo chiave. Questo strumento utilizza l'algoritmo di clustering KMeans per rilevare dinamicamente i centroidi nei dati dei prezzi, evidenziando le aree in cui i prezzi hanno maggiori probabilità di incontrare supporto, resistenza o consolidamento. Algoritmo KMeans innovativo KMeans Price Zones Detector si distingue pe

Ottimizza le tue strategie di trading con l'indicatore RAR (Relative Adaptive RSI)! Questo avanzato indicatore di analisi tecnica combina la potenza del Relative Strength Index (RSI) con tecniche adattive, fornendo segnali più precisi e affidabili rispetto a un oscillatore comune. Cos'è l'Indicatore RAR? Il RAR è un indicatore progettato per MetaTrader 5 che utilizza medie mobili esponenziali (EMA) e medie mobili adattive (AMA) per rendere più fluido l'RSI e adattarlo dinamicamente alle condizio
=== > Cosa fa questo indicatore? Disegna una linea che rappresenta il Supertrend, basato su un ATR
Scegliere Il multiplo ATR Il periodo ATR e questo è tutto !!! **** Vedi schermate da 01 a 2
Non esitate a chiedermi il codice iCustom per integrare facilmente questo SuperTrend nei vostri codici
=== > Esempio su Bitcoin **** Vedi schermata 03
=== > Per chi? Che tu sia un trader discrezionale, un trader algoritmico o uno sviluppatore, l'indicatore è progettato per soddisfare le tue esigenze
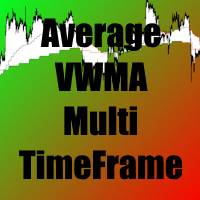
=== > Cosa fa questo indicatore? Come molti dei miei codici, è multi timeframe. Permettono di visualizzare, ad esempio, la trama di un quotidiano in H1.
Cerca tutti i miei codici (codebase e marketplace) con William210 È una media mobile ponderata per volume, è uno smoothing preciso in base ai volumi scambiati
Traccia una singola media WWMA con la scelta del periodo di tempo
Metti questo indicatore sui tuoi grafici tutte le volte che ti servono per calcolare la media.
Scegli i parametri

Индикатор тиковых объемов представляет собой инструмент технического анализа, используемый для оценки активности трейдеров на рынке. Этот индикатор отображает количество тиков (изменений цен) за определенный временной период и показывает преобладание тиков, направленных на покупку или продажу.
Основные характеристики и функции индикатора тиковых объемов: Гистограмма объемов:
Белый цвет: Означает преобладание тиков, направленных на покупку. Когда количество покупок превышает количество прода
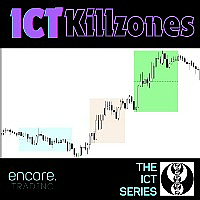
Kill zones ICT è un potente indicatore che vi permetterà di vedere i mercati da una prospettiva migliore. Questo strumento di indicatore consente di visualizzare sul grafico uno dei fattori più importanti del trading, ovvero il tempo. Grazie alla sua semplice interfaccia, sarete in grado di vedere facilmente quali sono gli orari con maggiore volatilità e il movimento delle sessioni con ore meno attive. Come posso utilizzare questo indicatore per fare trading sui concetti di ICT/ Liquidità?
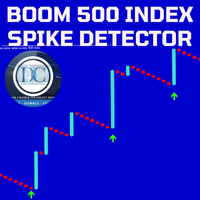
Our Spike Detector is specifically engineered to cater to the unique needs of traders in the Boom and Crash indices markets. This tool is optimized for M1 (1-minute) and M5 (5-minute) timeframes, ensuring you receive timely and actionable insights.
Key Features:
1. Non-Repainting**: Our detector guarantees accuracy with non-repainting signals, ensuring your data remains consistent and reliable. 2. Push Notifications**: Stay updated with real-time push notifications, so you never miss a cr
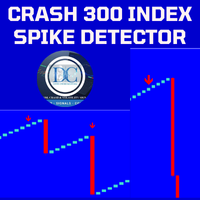
Spike Detector for Boom and Crash Indices
The Spike Detector is specifically designed to cater to the unique needs of traders in the Boom and Crash indices markets. Optimized for M1 (1-minute) and M5 (5-minute) timeframes, this tool ensures you receive timely and actionable insights. Below, you'll find a comprehensive guide on its key features, advantages, installation process, and how to use it effectively.
Key Features and Advantages
1. Non-Repainting: The Spike Detector guarantees accu
=== > Cosa fa questo indicatore? Come molti dei miei codici, è multi timeframe. Permettono di visualizzare, ad esempio, la trama di un quotidiano in H1.
Cerca tutti i miei codici (codebase e marketplace) con William210 Traccia una singola media VEMA con la scelta dell'intervallo temporale.
La media mobile esponenziale ponderata per il volume (VEMA) è una media mobile che attribuisce maggiore peso ai dati recenti e alle barre di volume elevato.
Ciò significa che le fluttuazioni dei prezzi

Bienvenue dans une nouvelle ère de trading avec l'indicateur AI Moving Average, un indicateur avancé MetaTrader 5 conçu pour fournir aux traders des insights prédictifs sur les mouvements du marché. Cet outil combine la puissance de l'IA avec la fiabilité d'une moyenne mobile exponentielle sans décalage pour offrir des prévisions précises et opportunes des tendances futures des prix. Modèle de Régression Linéaire Innovant Le AI Moving Average utilise un modèle de machine learning de régression l

Trend reversal identification: The K-line countdown indicator helps traders capture trend reversal signals by identifying excessive buying and selling behavior in the market. This indicator is particularly effective when the market is in extreme states. Risk management: This indicator can help traders identify potential risks in the market before the trend reverses and adjust positions in time to avoid losses. For example, you might consider reducing your long position when a bullish countdown c

Evaluate operational viability in each timeframe and in any instrument, according to their respective spread and percentage volatility, which are essential for correct risk management in your trades.
This indicator is essential for both Day Traders and Swing Traders, as in addition to evaluating operational viability in each timeframe, it is also possible to identify the fair minimum stop for each period and instrument.
Example in Swing Trade: your broker charges a spread equivalent to 0.05
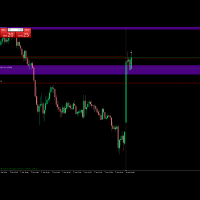
Your average price indicator for the position you were looking for. This indicator inserts a horizontal line on your chart when you are positioned, long or sold, after completing the partial. After completing the partial, it inserts the horizontal line on the graph visually showing where the true BreakEven of the operation is. Take a look the line of point 0 of operation.
OBS: This indicator only works in Netting Account.
Seu indicador de preço médio da posição que estava procurando. Este i

Scanner di mercato multitimeframe e multisimbolo. L'indicatore metterà alla prova la strategia tecnica selezionata su tutti gli strumenti e gli intervalli di tempo di tua scelta e visualizzerà i risultati della scansione in una frazione di secondo.
Caso d'uso Avvia l'indicatore, imposta l'orario di trading e le logiche di trading. Assicurati che i risultati della scansione siano redditizi sulla maggior parte degli strumenti, quindi passa al grafico desiderato con un solo clic del mouse. I segn

Identificate i 5 timeframe delle ICT killzones con colori diversi e seguite il tracciamento per contrassegnare l'area di prezzo all'interno del timeframe, le linee di riferimento del punto di pivot alto e basso si estenderanno automaticamente fino a quando il prezzo del punto di pivot non verrà rotto o il timeframe di trading non terminerà. Questo indicatore aiuta a trovare i punti di breakout per operare con la tendenza. Le ICT killzones sono periodi specifici del mercato in cui il volume e la
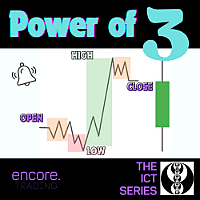
Il Power of 3 ICT è lo strumento migliore per aiutarvi a tenere d'occhio l'HTF mentre fate trading sui timeframe inferiori. Questo indicatore vi permetterà di vedere fino a 2 diverse candele HTF sul vostro grafico LTF, in modo da sapere sempre come si presenta l'azione del prezzo corrente nei timeframe più alti e se state effettuando il vostro trade seguendo la tendenza del timeframe più alto. Come posso utilizzare questo indicatore per fare trading sui concetti di ICT/ Liquidità?
Cosa si p

StochastiX is an extension of a well-known indicator.
1) StochastiX is displayed in the range of -100 to 100.
2) A histogram is calculated from the difference of the main and signal curves - again as a stochastic, but without smoothing.
The histogram gives the user a hint about the dynamics of oscillator changes. Patterns need to be studied from real graphs.
I wish you successful trading.
Il MetaTrader Market è l'unico negozio online dove è possibile scaricare la versione demo gratuita di un robot di trading che consente di effettuare test e ottimizzazioni utilizzando dati statistici.
Leggi la descrizione dell'applicazione e le recensioni di altri clienti, scaricala direttamente sul tuo terminale e prova un robot di trading prima di acquistarlo. Solo sul MetaTrader Market è possibile testare un'applicazione in modo assolutamente gratuito.
Ti stai perdendo delle opportunità di trading:
- App di trading gratuite
- Oltre 8.000 segnali per il copy trading
- Notizie economiche per esplorare i mercati finanziari
Registrazione
Accedi
Se non hai un account, registrati
Consenti l'uso dei cookie per accedere al sito MQL5.com.
Abilita le impostazioni necessarie nel browser, altrimenti non sarà possibile accedere.