YouTubeにあるマーケットチュートリアルビデオをご覧ください
ロボットや指標を購入する
仮想ホスティングで
EAを実行
EAを実行
ロボットや指標を購入前にテストする
マーケットで収入を得る
販売のためにプロダクトをプレゼンテーションする方法
MetaTrader 5のための有料のテクニカル指標 - 33

Magnetic levels for MT5 is a great addition to your trading strategy if you use support and resistance levels, supply and demand zones. The price very often gives good entry points to the position exactly at the round levels and near them.
The indicator is fully customizable and easy to use: -Choose the number of levels to be displayed -Choose the distance Between The levels -Choose the color of the levels.
Can be added to your trading system for more confluence. Works very well when combin

Perfect Sniper! is a triple indicator with support resistance detection, downtrend channel, uptrend channel Bands included! where he hunts the rebounds in the red lines for sale, in the green lines mark purchase, in the lower bands that are the breaks gives another second entry either buy or sell, perfect to take advantage of the double entrance, It is used in any temporality, It is used to scalp and long on h1 or h4 to D1. It works for Forex markets, All pairs. It is used for the synthetic inde
One of the basic needs of every trader is to have a checklist to enter every position. Of course, using pen and paper may not be convenient forever. With this indicator, you can have a small checklist next to the screen for each of your charts and use it for better use in your trades.
By pressing the r button, you can return everything to the original state.
MT4 Version
This indicator will have many updates and special settings will be added to it.
You can contact us via Instagram, Telegram
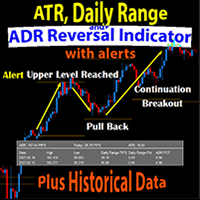
The Daily Range ATR ADR Reversal Indicator shows you where price is currently trading in relation to its normal average daily range. You will received alerts via pop-ups when price exceeds its average daily range. This will enable you to identify and trade pullbacks and reversals quickly.
The Indicator also shows you the Daily Range of Price for the current market session as well as previous market sessions. It shows you the ATR which is the average range of pips that a candle may move in that
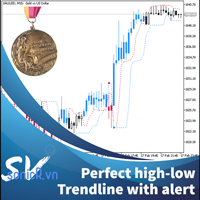
This indicator calculate trendline base on high, low of two period: fast and slow. From that, we have two line for fast signal and low signal. We tested many time on many assets, in most case, when fast signal crossup slow signal, price going up and vice verser. We also add alert function when two signal line crossed. For most effecient, user can change fast and slow period in setting. This indicator is good advice for price move. It better when combine with other trend indicator. For me, i us

The TrendChangeZone indicator displays global and local price highs and lows on the chart. The indicator also shows the global trend on the chart and corrective waves. This indicator is designed to determine the direction and change the trend. Most importantly, the indicator shows trend continuation or reversal zones. An indispensable assistant in trading. The indicator does not redraw. The indicator can work on all trading instruments.
Important !!! Top trend if 2 (two) or more b

An oscillator that shows price changes and identifies areas of overbought and oversold. It can also show trend reversal points. WaveTrend Oscillator is a port of a famous TS /MT indicator. When the oscillator is above the overbought band (red lines) and crosses down the signal (solid line), it is usually a good SELL signal. Similarly, when the oscillator crosses above the signal when below the Oversold band (green lines), it is a good BUY signal. Good luck.

(Google 翻訳) この指標は、 MetaTrader インストールのソース コード例として提供されている元の ZigZag に基づいています。 「深さ」チャネルとそれぞれのブレークアウトを表示するための追加機能を追加して書き直しました。 また、以前のジグザグ ポイントを観察することもできます。 オプションで、ブレークアウトが発生したときにユーザーに警告することができます。 アラートは端末上に表示することも、モバイル デバイスのプッシュ通知を介して独自のカスタム テキストで表示することもできます。 (Original text) This indicator is based on the original ZigZag provided as a source code example with MetaTrader installations. I rewrote it with some extra features for displaying the “depth” channel and the respective break-outs. It also allows

Máquina Trader Tendência Count on our trend tracker to carry out your operations on the Mini Index and the Mini Dollar!!! Operational Green is BUY and Pink is SELL!!! Enter the operation after closing the first color block!!! Developed and Tested on the 5 or 15 minute Chart for Mini Index and Mini Dollar!!! Can be used on any chart!!! Editable colors and period!!!
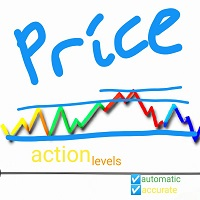
Accurate horizontal support and resistance levels Accurate for price action analysis. All Markets: forex, stocks, indices, metals, commodities ,and crypto Available for meta trader 5 Adjustable parameters I think that's it inputs: For multiple timeframe analysis: adjust "analysis_timeframe" accordingly "depth_of_retrenchments" represents how big the peaks or troughs are. "lookback " represents the most recent number of candlesticks to consider "linecolor " is the color of the lines "lineweig
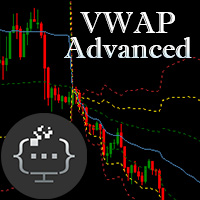
Introducing the Advanced VWAP tool - an essential technical analysis indicator that can help you identify trend directions and locate price extremas with multipliers. Designed to suit the needs of both traders and EA developers, this tool features customizable parameters that allow you to tailor it to your specific trading style. With Advanced VWAP, you have the ability to customize the colors and styles of all bands to your liking. If you don't require any bands, you can simply set their values
This indicator will identify when Fast Moving Averages (EMA, SMA, or LW) cross Slow Moving Average lines on any timeframe and with any symbol.
When the moving averages cross and price close above or below the crossing, the User will receive an alert via pop-up, push, or email.
Choose any two Moving Averages to cross to receive an alert and the Indicator will also paint the Moving Average Lines and Arrows.
You can choose Exponential Moving Averages (EMA). Simple Moving Averages (SMA) or Lin
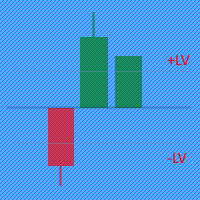
The Price Movement Strength indicator displays the direction and strength of the price change in the form of a candle on each price bar. If the indicator shows the closing level of the candle equal to zero on the current bar, then the price has not changed during bar. If the indicator shows a green candle, then the price of the trading instrument is growing, and vice versa, a red candle signals a price fall. Input parameters: The indicator has two parameters for setting buy/sell levels: BuyLevel

独自のローソク足パターンを定義すると、このパターンが表示されたときにこのインジケータが画面に表示されます ストラテジー テスターで無料でテストでき、選択した資産にローソク足パターンが何回表示されるかを確認できます パターンのすべてのキャンドルをペイントすることも、1 つだけをペイントすることもできます この指標はローソク足分析に役立ち、プライス アクションやネイキッド トレード戦略で使用できます。 選択した動きを示す指標です
dokuji no rōsoku ashi patān o teigi suru to, kono patān ga hyōji sa reta toki ni kono injikēta ga gamen ni hyōji sa remasu sutoratejī tesutā de muryō de tesuto deki, sentaku shita shisan ni rōsoku ashi patān ga nankai hyōji sa reru ka o kakunin dekimasu patān no subete no kyandoru

Optimized Trend Tracker OTT is an indicator that provides traders to find an existing trend or in another words to ser which side of the current trend we are on.
We are under the effect of the uptrend in cases where the prices are above OTT ,
under the influence of a downward trend, when prices are below OTT
it is possible to say that we are.
The first parameter in the OTT indicator set by the two parameters is the period/length.
OTT will be much sensitive to trend movements if i
Unlike many other indicators including the moving average indicator, Pivot Point can be a leading indicator. In these systems, the price levels of the previous period are used to determine the critical points instead of relying on the current price performance. Such an approach provides a clear framework for traders to plan their trades in the best possible way.
You can use this method and its combination with the methods you want to build and use a powerful trading setup. MT4 version
Let us k
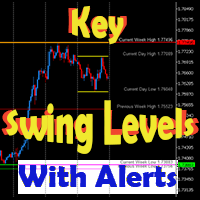
This dynamic indicator will draw the Key Swing High and Low Levels for any symbol on any timeframe!
User may Hide or Show any Level or Label and also Receive Alerts when price returns to that key level via Pop-Up, Push, Email or Sound.
Levels include Current Day High/Low, Previous Day High/Low, Current Week High/Low, Previous Week High/Low and Monthly High/Low.
The Levels are labeled with the Price Point Data Listed next to it for quick easy reference.
You can change the Style, Size an

The Advanced Momentum Trend indicator is an indicator used to determine trend directions. It determines the trends by considering many factors while calculating the trend. You can use this indicator as a trend indicator or in combination with other indicators that suit your strategy. You can also use it as a stand-alone trend filtering. Thanks to the alert feature, you can instantly learn about the new trends. To View Our Other Products Go to the link: Other Products

The Intra Daily Range Projection indicator forecasts the current day’s price range on the basis of the previous day data. All calculations are based on the book “New Science of Technical Analysis” by Thomas R. DeMark.
When you're analyzing investments, the trading range is a valuable analytical tool. The average trading range is the average distance between the high and the low over a specified period of time. You can calculate the average high-low range on a piece of paper, a spreadsheet, o

Phase accumulation adaptive bandpass filter MT5 Indicator is a Metatrader 5 (MT5) indicator and the essence of this technical indicator is to transform the accumulated history data. Phase accumulation adaptive bandpass filter MT5 Indicator provides for an opportunity to detect various peculiarities and patterns in price dynamics which are invisible to the naked eye. Based on this information, traders can assume further price movement and adjust their strategy accordingly.

Correlation indicator is a trading indicator that compares price correlations on up to 8 different instruments simultaneously. This indicator is designed to be very versatile. It can be used to trade many different strategies from scalping to hedging to simple trend-following based on an average trend direction of multiple currency pairs or it can signal only when all the pairs correlate on the same side of a particular moving average. The indicator automatically applies the same moving average

"Scalper Channel MT5" is a modern channel indicator that shows the trader the direction of the trade. For work, the indicator uses built-in and proprietary technical means and a new secret formula. Load it on the chart and the indicator will show you the entry direction in color:
If the upper limit of the price channel of the indicator is blue, open a buy position. If the lower limit of the price channel of the indicator is red, open a sell position. If the border of the indicator is gray, ne

This indicator is suitable for trading on the pair and many others. The indicator itself uses universal calculations of additional accuracy, but so far they are optimized for some currency pairs. Many settings can be configured on the main menu. He displays his calculations on the graph in the form of icons. There are two types of icons. In the tester, it works fine by default in the settings. You can specify a color for its icons. There is a panel. Happy trading.

Price Stellar! is a bot that has the strategy of grabbing rebounds on the roofs or floors of the Yellow channel, accompanying an ema to hunt the bullish or bearish trend, It can be seen very clearly in the photo what the strategy is about works for all seasons to scalp and long works for all forex pairs and for the pairs of synthetic indices ! from now to enjoy good profit World Investor.

Trend Uranus! It is an indicator that works in line with support and resistance, giving entrances with the roofs and floors Red (Sale) Green (Buy) to catch a better trend ideal for scalping in the Volatility 75! works for all synthetic index pairs ! and for all forex pairs! ideal for the pair Eur/Usd, Usd/Jpy! from now to enjoy good profit!!!!! World Investor.

Arrow Venus! is an oscillator that uses the strategy of crosses capturing the entry whether for sale or purchase where it can be seen in the photo, when the line crosses the blue line with the red one, marking the red arrow it's sale, when the blue line crosses the red one upwards and marks the blue arrow, it is a buy signal very good for scalping and long! used at any time for forex markets and synthetic indices

Fibo expert! It is an automatic fibonacci indicator. adapting to any temporality, to catch those rebounds, or the path of that trend, special to make longs in H1 or H4 clear the trend, but it also works for scalp in m1 up to m15 works for all forex pairs and for all pairs of synthetic indices, ideal for volatility 75 in synthetics no more to enjoy good profit World Investor.

Stock Mantra It is an oscillator that is used to hunt long trends, as can be seen in the mantra, it gives input when the lines are crossed, the blue line above crossing the red line gives entry for sale, When it is the other way around, crossing the blue line, the red one up gives a buy entry signal. super simple and effective! works for all forex pairs and synthetic indices! used in all seasons good profit World Investor
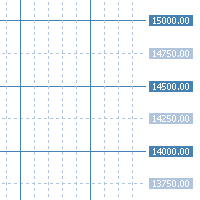
"AV Grid MT5" is an indicator for MetaTrader 5, which automatically displays round numbers as horizontal lines and a sensible period separation .
Round prices can be used as support and resistance in trading.
It is an improvement on the "Grid" setting, which also draws a grid on the chart.
Improvements :
- Round levels instead of arbitrary positioning of the horizontals
- Structure by highlighting all x lines (main lines, 2 or 5 makes sense)
- Vertical lines are each in two p

「Supertrend MetaTrader 5」インジケーターは、最も単純なトレンド取引システムの基礎です。それでも、それは非常に効果的です。インジケーターは、任意の時間枠 (現在のチャートの時間枠) で機能します。名前からわかるように、このインジケーターはトレンドを追跡し、トレンドが変化すると、インジケーターはトレンドの変化点を正確に示します。 「Supertrend MetaTrader 5」の基本は、価格と乗数を掛けた「Average True Range indicator」の値を比較することです (「ATR」の代わりに「True Range」に基づいて計算された「移動平均」を使用するオプションもあります)。 .
このインディケータは、トレンド マーケット エリアでパラメータ 10 と 3 を使用して最良の結果を示します (「ATR 期間」は 10 に等しく、「ATR 乗数」は 3 に等しくなります)。 D1 タイムフレームでは、確認インジケーターを使用することをお勧めします。
パラメータでは、指標タイプを「ATR」または「移動平均」に設定できます (「ATR 計算
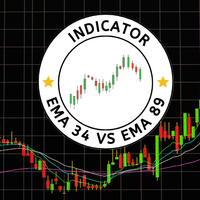
「EMA43 vs EMA89」インジケーターは、トレンド転換や取引機会を特定するための強力なツールです。このインジケーターは、EMA34とEMA89の2つの移動平均線をチャート上に表示します。これらの移動平均線がクロスすると、買いシグナルまたは売りシグナルが生成され、トレンド方向の潜在的な変化を示します。 特徴: 使いやすい:インジケーターをチャートにアタッチして、EMA34とEMA89がクロスしたときにアラートを受信するだけです。 調整可能な移動平均期間:EMA34とEMA89の長さを調整して、取引戦略に合わせることができます。 すべてのタイムフレームで動作:EMA Cross Alert IndicatorをM1からMNまでのすべてのタイムフレームで使用できます。 使い方: EMA Cross Alert Indicatorをチャートにアタッチします。 EMA34とEMA89がクロスするのを待ちます。 買いシグナルまたは売りシグナルが生成された場合は、新しいトレンドの方向に取引を行うことを検討してください。 リスクの免責事項:金融市場での取引にはリスクが伴います。過去のパフォーマ

Count on our trend tracker to carry out your operations!
Operational Green is BUY and Pink is SELL! Enter the operation after closing the first color block!
Developed and Tested on the 5 or 15 minute Chart for Mini Index and Mini Dollar!
Can be used on any chart!
Editable colors and period!
“All strategies and investments involve risk of loss. No information contained in this channel should be interpreted as a guarantee of results or investment recommendation!”

Welcome to the Ultimate Harmonic Patterns recognition indicator that is focused to detect advanced patterns. The Gartley pattern, Bat pattern, and Cypher pattern are popular technical analysis tools used by traders to identify potential reversal points in the market.
Our Ultimate Harmonic Patterns recognition Indicator is a powerful tool that uses advanced algorithms to scan the markets and identify these patterns in real-time.
With our Ultimate Harmonic Patterns recognition Indicator, you

Bollinger Bands based on Returns This indicator characterizes the price and volatility by providing a channel/band of standard deviations like the Bollinger Bands. In contrary to standard Bollinger Bands which uses price directly, this indicator uses returns due to normalization. The standard Bollinger Bands based on price directly, were one of the first quant or statistical methods for retail traders available. The issue with these bands, standard deviations can only be calculated, if the u

OHLC Volume Histogram displays the difference between two streams of the OHLC Volume volume indicator as a colored histogram. There are no input parameters. Calculation: Histogram = StreamUP - StreamDN where: StreamUP = Volume * UP_Coeff / (UP_Coeff+DN_Coeff) StreamDN = Volume * DN_Coeff / (UP_Coeff+DN_Coeff) UP_Coeff = High-Open DN_Coeff = Close-Low Volume - tick volume

What Is Moving Average Convergence/Divergence (MACD)? Moving average convergence/divergence (MACD, or MAC-D) is a trend-following momentum indicator that shows the relationship between two exponential moving averages (EMAs) of a security’s price. The MACD line is calculated by subtracting the 26-period EMA from the 12-period EMA. The result of that calculation is the MACD line. A nine-day EMA of the MACD line is called the signal line, which is then plotted on top of the MACD line,

“Multi timeframe Slow Volume Strength Index” shows data of three SVSI indicators from different timeframes on the current chart. The indicator has nine adjustable parameters: EMA period – EMA SVSI calculation period Smoothing – SVSI smoothing period Overbought – overbought level Middle – middle line Oversold – oversold level Drawing mode – indicator drawing type Steps – as a ladder Slope – sloping lines First SVSI timeframe – the timeframe of the first SVSI Second SVSI timeframe – th

取引の結果、矢印指標、顧問の仕事、取引戦略の開発を分析するためのグラフィカルな指標。
主なパラメータの1つは、利益の最小割合です。
この指標は、閉じたバーとフラクタルを考慮して、任意のチャート上のすべての傾向を示し、各傾向の利益の最大割合を計算します。
さらに、商品の平均利益率を計算します。 楽器の中でより大きな割合は、投機のためのこの楽器の歴史的魅力を示しています。
インジケータを高速化するには、より小さな計算間隔を使用します。
取引の結果、矢印指標、顧問の仕事、取引戦略の開発を分析するためのグラフィカルな指標。
主なパラメータの1つは、利益の最小割合です。
この指標は、閉じたバーとフラクタルを考慮して、任意のチャート上のすべての傾向を示し、各傾向の利益の最大割合を計算します。
さらに、商品の平均利益率を計算します。 楽器の中でより大きな割合は、投機のためのこの楽器の歴史的魅力を示しています。
インジケータを高速化するには、より小さな計算間隔を使用します。

MQL5「毎日のレジスタンスとサポート」インジケーター - 毎日のサポートとレジスタンスラインを描画します。描画は、グラフィカル オブジェクト (トレンド ライン) を使用してのみ実行されます。このインジケーターでは、インジケーター バッファーは使用されません。 インディケータには設定がありません - レベルの検索は「D1」時間枠の最後の 500 バーで実行され、このパラメータはコード内に組み込まれています。 手動取引: 手動で取引する場合、このインジケーターは「M10」から「H1」までの時間枠で使用することをお勧めします。レベルのブレイクアウトとレベルからのリバウンド、または両方の戦略の組み合わせの 2 つの戦略で使用できます。覚えておくべき主なことは、毎日のレベルが 3 ~ 4 日遅れて描画されることです。これは、レベルが形成される最小時間です。まれに、トレンドが 3 ~ 4 日以内に劇的に変化した場合、レベルが消えることがあります。 より保守的な取引が使用されている場合は、他のインジケーター (トレンドまたはオシレーター) からの確認を探す必要があります。
The Bounce strength indicator (BSI) for meta trader 5 illustrates the strength of the market bounce. The +10 and -10 extreme bounds are used by the indicator. The blue bars show a bullish bounce, while the pink bars show a bearish bounce. The indicator, in essence, depicts market volatility for both up and down moves. When utilized appropriately, the indicator performs equally well on all currency pairs and produces encouraging returns.
Extreme Price Meter 過去の市場情報に基づいて、インディケータは反転の可能性が高い次の極端な価格を計算します。 売買の可能性が高い 2 つの価格帯を生成します。 ローソク足が確率バンドの外で閉じたときに配置される矢印を考慮すると、インジケーターの高い精度を簡単に確認できます。 デスクトップ、電話、電子メールの通知。
..............................................................................................................................................
This is MT5 version of StochScanner It scans Stochastic from Multi Symbols and Multi Timeframes and displayed on the dashboard on a single chart. . 4 scanning modes: 1. Mode OverBought/OverSold Indicator scans Overbought and OverSold . OverBought : current stochastic is above level 80 and OverSold : current stochastic is below level 20 2. Mode Signal It means if the previous stochastic is on OverBought or OverSold ( either Main Line and Signal Line ) and the current Main Line cross over the curr
向けられます。 ワーキング チャートでは、古い期間から受け取ったレベルも表示されます。 レベルの表示とそのプロパティは、インジケーター設定で設定されます。 になった期間のレベルは、通常、優先度が高くなります。 各レベルには、レベルに関する必要な情報を含むツールチップがあります。 平均範囲値 (ATR) は、実際のレベルを取得するために使用されます。 ティックとリアル (利用可能な場合) の両方のボリューム値を使用できます。 ボリュームインジケーターは、インジケーター「The Better Volume Indicator」で実装されたアイデアに基づいています。 インディケータ アルゴリズムは、現時点で機能するように適合されており、履歴データの分析を目的としたものではありません。 表示されたイベント VCU - 大きなバー範囲でのボリュームアップのクライマックス VCN - 大きなバー範囲で中立的なボリュームのクライマックス VCD - 大きなバー範囲でのボリュームダウンのクライマックス HVC - 低バー範囲での高ボリューム VCHVC - VCU、VCN、VCD の組み合わせ L
この指標は 2 つの期間で動作し、作業チャートに直接波を視覚的に表示し、水平波レベルを表示します。 ZigZag インジケーターは、価格チャートの重要なトップとボトムを目に見える傾斜線で結び、波の動きを認識しやすくし、波をレベルごとに範囲に分割します。 極値は、 HighLow 価格または Close 価格を使用して計算されます。 波のレベルは次の波に投影され、サポート / レジスタンスのレベルを取得できます。 レベルは、フィボナッチ アルゴリズムまたは線形関係を使用して計算されます。 になった期間のレベルは、通常、優先度が高くなります。 各レベルには、レベルに関する必要な情報を含むツールチップがあります。 ZigZag インジケーターの特徴は、資産の価格の変化が以前の値の変化を引き起こす可能性があることです。これは、そのようなレベルにのみ基づいて取引の決定を行う際に考慮に入れる必要があります。 ただし、このようなレベルでは、方向を変更したり、動きを遅らせたりする可能性のある相場や価格値の動きの方向について判断を下すことができます。 インディケータ アルゴリズムは、現時点で機能する

Your search for a perfectly simple ICT Killzone indicator for MT5 is now over because here it is. If you trade ICT concepts, then you know what ICT Killzones are. ICT Killzones (by default is adjusted to EST New York Time, no recalibrating to your timezone needed. Just load it onto your chart and you're good to go): Asian Open Killzone (06:00PM - 12:00AM EST New York Time) London Open Killzone (02:00AM - 05:00AM EST New York Time ) New York Open Killzone (07:00AM - 9:00AM EST New York Time )
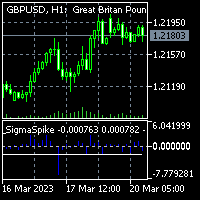
To get access to MT4 version please click here . - This is the exact conversion from TradingView: "SigmaSpikes(R) per Adam H. Grimes" by "irdoj75" - This is a light-load processing and non-repaint indicator. - All input options are available. - Buffers are available for processing in EAs. - You can message in private chat for further changes you need. Thanks for downloading

CZSC フラクタル型インデックス
特徴:
包含関係の徹底処理を実施
上下分類かどうかの判断にはEAコールを利用すると便利で、「株の教え93 2つのテーブルとトレンド構造の内部の関係2」でステータスを判断すると便利です。
上下の分類を矢印で表示
可能なペンをさまざまな色で表示する
隣接する 2 つの K ラインの包含関係は次のように定義されます。K ラインの最高点と最低点はすべて隣接する K ラインの範囲内にあり、この K ラインと隣接する K ラインは包含関係です。
K-lineチャートでは、関係のあるK-lineをよく見かけますが、包含関係にある2本のK-lineを1本のK-lineにまとめる、いわゆる包含処理です。
定義: 3 つの連続した K ラインを含めて処理したもので、中央の K ラインの高点が最も高い場合、この組み合わせはトップ タイプと呼ばれます。
定義: 包含処理後の 3 つの連続した K ラインで、中央の K ラインの最低点が最も低い場合、この組み合わせはボトム タイプと呼ばれます。
EA によって呼び出されるインジケーター

Candlestick bar, you can call it Candlestick Scalping Beast(CBS). This indicator is made specifically for scalping. The strategy on the indicator is that it gives signal on the close of a candle following this rule, if the close of the candle/bar is high then the previous candle/bar ,then it is a buying signal (up-trend),a green arrow and if the close of the candle/bar is lower than the previous candle/bar , then it is a selling signal (Downtrend), a red arrow. And the ATR is a secrete recipe

Murrey Math Lines The concept of this technical analysis system was developed by T. Henning Murrey in 1995 and described in The Murrey Math Trading System; For All Markets. The main concept here is that all markets behave in the same manner based upon the observations made by W.D. Gann. To date, the Murrey Math Line X it is one the most popular methods of Forex analysis and trading. Formula The Murrey Math Line X is calculated with the help of price movement segment, which, in accordance to Gan
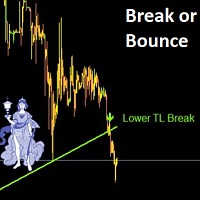
Trade like a pro and never miss Break or Bounce of a Support or Resistence Line
Get alert and suggested Trading points (entry, TP1, TP2 and SL) whenever there is a break of - Break or Bounce from Pivot Point Support or Resistence - Break or Bounce from a Trendline (upper and lower Trendline) - High and Low of a previous period Any suggestion on other types of Support / Resistence to add are more than welcome

NO repaint, NO misleading statistics, NO hidden mechanisms – only proven mathematics using the famous Fibonacci retracement levels.
This indicator finds bearish Fibonacci retracement levels using a dynamic seeking engine, and tells where current price is relative to the levels, continuously for all candles. No need to redraw the levels manually when market structure changes - this indicator dynamically adjusts to the most recent structure. See the levels and price location from the indicator

Profesyonel iş hayatı boyunca sızma testleri ve güvenlik danışmanlığı konusunda birçok firmaya hizmet veren Tekno Fatih, web uygulama, mobil uygulama, network&sistem, kablosuz ağ gibi birçok alanda sızma testleri yapmış olup siber olaylara müdahale, ddos testleri ve kaynak kod analizi projelerinde de yer almıştır. Siber güvenlik alanında birçok konferansta yerini almıştır. Amerika Savunma Bakanlığına bağlı olan NSA.gov ( Ulusal Güvenlik Teşkilatı )'inde ve NGA.mil ( Ulusal Coğrafya-İstihbarat T

As well as SuperTrend, SuperTrend Alerts offers alerts . You can also get alerts with SuperTrend Alerts . Besides SuperTrend, SuperTrend Alerts also offers alerts . SuperTrend Alerts offers alerts along with SuperTrend . In addition to SuperTrend, SuperTrend Alerts has alerts . Also , SuperTrend Alerts offers alerts . The SuperTrend Alerts add-on works with SuperTrend as well. As well as SuperTrend, SuperTrend Alerts has alerts too .

Smart Tape - это индикатор ленты всех сделок с возможностью агрегации по цене и времени и фильтрацией по величине объема, включает в себя два отключаемых варианта отображения. Вариант 1: перемещаемое окно по графику со списком сделок (Time Sales). Список обновляется сверху вниз и не имеет возможности просмотра истории. Количество отображаемых строк выбирается пользователем. Порядок отображения в строке: время с точностью до миллисекунд, тип сделки (B - покупка или S - продажа
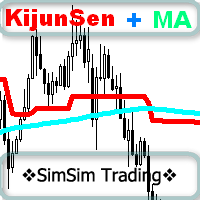
非常にシンプルですが効果的な指標です。
これは、一目インジケーターの KijunSen ラインと、このラインの構築平均 MA に基づいています。 売買シグナル: これは 2 本の線の交点です!!!
私自身、取引には一目指標の基準線をよく使用します。価格が高ければ購入のみを検討し、販売のみが低ければ購入を検討します。
そして、基準線を平均して基準線MAラインを形成した後、2つのラインの交点が現れました。これは、取引のシグナルの増幅として解釈できます。
インジケーターの MT4 バージョンへのリンク:
https://www.mql5.com/ru/market/product/96120
指標パラメータ:
基準線 - 基準線の計算期間。
KijunSen_MA - KijunSen MA の計算期間。
MethodMA - KijunSen MA の価格を計算する方法。
サウンド - 基準線と基準線MAの交差点警報音。
PushMobil - 携帯電話への通知。
エキスパートアドバイザーと通信するための指標バッファ。
バッファ番号で。
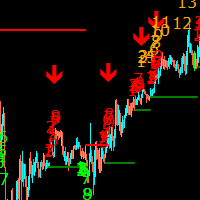
The Sequential Ultimate Indicator is a modified version of the Ultimate Oscillator that adds a sequential component to the calculation. It is designed to identify potential trend reversals by looking for divergences between the price action and the oscillator. The Sequential Ultimate Indicator works by adding a sequential count to the Ultimate Oscillator readings. The sequential count starts at 1 when the oscillator moves above 70 or below 30 and continues until a price reversal occurs. The sequ

この指標は、1 日のうちで最大の取引活動の時間を決定するように設計されています。 この計算の後、インジケーターは最も重要な取引レベルを構築します。 これらのレベルを実際の値動きと比較することで、市場トレンドの強さと方向性に関する情報を得ることができます。
指標の特徴 時間枠は D1 未満である必要があります。 推奨される時間枠: M15、M30、および H1。 H1 を超える時間枠は、非常に大まかな状況を示す可能性があります。 また、M15 未満の時間枠を使用すると、取引が短期間で急増する可能性があります。 指標は過去のデータに敏感です。 したがって、チャート ウィンドウに少なくとも 50,000 バーを設定することをお勧めします。
指標パラメータ 基準 - 取引活動を計算するための基準期間を設定します。 day - 取引活動は、時刻を考慮して計算されます。 week – 取引活動は、時刻と曜日を考慮して計算されます。
Width - 線幅。 ClrMean、ClrUp、および ClrDn は、中間、上位、および下位の取引レベルの色です。 Style1 - Style5
This is a simple arrow system based on MACD indicators Main/Base line and MACD Levels. It gives you alerts when MACD's Main Line crosses above/below certain level. Which type of alerts available? 1. It paints on chart Up/Down Arrows. 2. Popup message and sound alert in trading terminal window. 3. Push notification or Alert on your android and ios mobile phones (requires MT4 or MT5 app installed!)

Simple supply and demand indicator which should help identify and visualize S&D zones. Settings:
Color for supply zones, color for demand zones - default colors are set for dark (black) background.
Number of how much zones should be created above and below current price - value "3" means there will be 3 zones above current price and 3 zones below current price. Principle:
When price creates "V", reversal zone is registered. Rectangle filled based on zone type (supply / demand) is drawn if pri

This is a simple arrow system based on Engulfing Candlestick Pattern. It gives you alerts on your smartphone when there is an engulfing candlestick pattern happens. Which type of alerts available? 1. It paints on chart Up/Down Arrows. 2. Popup message and sound alert in trading terminal window. 3. Push notification or Alert on your Android and IOS mobile phones (requires MT4 or MT5 app installed!) *Note: Use it on higher timeframes like H4 (4 hours), D1 (1 Day) then find trade opportunities on s

Displays trends in current chart. You can display trends of multiple timeframes in one chart by inserting this indicator as often as you want. Key features: displays trend line by finding highs and lows counts number of high/low of current trend in different color (long/short) allows you to display multiple timeframe trends in one chart Settings: Indicator Name: if you want to show M5 and H1 on one chart add TITrend twice to your current chart and rename M5 to "TITrendM5" and H1 to "TITrendH1" C
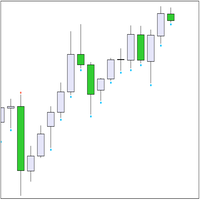
トレンド指標「トレンド2移動平均」は、「トレンドUP」と「トレンドDN」の2種類の矢印で計算結果を表示します。 アローズ「トレンドアップ」 描かれています に 価格 '低い' バー , あ アローズ「トレンドDN」 - に 価格 '高い'。 トレンド検索アルゴリズムは、バーの価格と 2 つの「移動平均」インジケーターの値の分析に基づいています。トレンドの方向は、現在の (ゼロ) バーで計算されます。したがって、完全に形成されたバーからのバー #1 からのシグナルを使用することをお勧めします。 トレーディングでのインジケーターの使用. トレンド インジケーターを使用すると、リスクの高い戦略 (シグナルが現在のバーから取得される場合) とリスクの低い戦略 (シグナルがバー #1 から取得される場合) の両方を使用できます。バー #1 からのシグナルに基づく戦略を以下に説明します 。 生成されたシグナルを待ちます( 現時点では 新しいバーの出現、バー #1) を見る必要があります 。 もしも

Indicator ICT Implied Fair Value Gap (IFVG) is an important part of the Smart Money Concepts (SMC) system. It looks for and shows on the chart a modern pattern - the Fair Value Gap ( FVG ). This pattern is a three candlestick imbalance formation based on the discovery of a mismatch between supply and demand. This happens when the price moves quickly in one direction without encountering resistance. The result is a "gap", which can be filled in later. The indicator finds this pattern using the up

it depends on ATR period to get swing points to help make better trading decisions blue dot and red dot is the default color scheme of course you can change it later if you'd like you can change the following : ATR PERIOD sending notifications number of times to send notifications sending notifications to your smart phone that's it very simple to use just drag and drop and follow the trend

This Indicator is based on the Indice gaps between todays open price and yesturdays closing price. On Metatrader these are not shown as we only see a 24hr chart. If we want to know the gap between the open at 16:30 and yesturdays close at 23:30 on the SP500 this EA will reveal the gap. On Indices these types of Gap close approximately 60% of the time within the same day and is demonstrated on the panel which records previous gap closures and provides to the user a statistical proof of gaps clos

it depends on channels and moving average in sketching the chart in two colors the default colors are gold and light blue to highlight the area of downtrend and the area of uptrend TO ADJUST THE INDICATOR YOU CAN CHNGE THE FOLLOWING: 1- the look back period which affects the length of the moving average 2- the multiplier which affects the point of swing in the trend 3- the channel shift which affects how close the line is moving to the price the default settings are the best for the indicator B
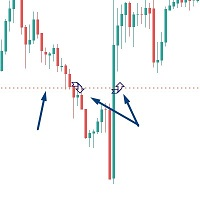
Introductory Offer! *** Only $47 - normal price $97 !! *** Ends soon - don't miis it!! The Close Above or Below Price Indicator is part of my suite of Price and Trendline Alerts Indicators. I'm excited to introduce the Close Above or Below Price Indicator – part of my new suite of Price and Trendline Alert Indicators – fantastic tools designed to alert you when candles close above or below significant prices in the markets you trade. With this indicator, you can set up to 4 price alerts on a
This is a modern MACD indicator based on regular MACD indicator. It also has alert system included. This indicator gives you alerts when base line of MACD indicator crosses above or below Zero level so you can look for Buy or Sell opportunity. Available Alerts: 1. Audible Alerts on Chart / Trading Terminal window. 2. Alerts on your email. 3. Alerts on your mobile phone. Type of Alerts Explained: 1. Audible_Chart_Alerts - Audible alerts and Popup message on your computer’s tr

An indicator based on support and resistance levels with many signals (per candle) Can be used in all time frames Can be used in all symbol Blue lines: upward trend. Red lines: downward trend
How It work: This indicator gives signals based on support and resistance levels as well as some complex calculations. Based on past data
As you know, one of the most important trade options are support and resistance levels.
Get good signals using this indicator.
How To work: Run the indicator.
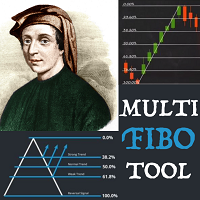
Multi Fibonacci Tool for MT5. User can set up to 5 different Fibonacci Retracements. Save & Load.
Simple settings. Style, line width, colors. Available ray function for all.
Application creates simple and functional panel on the chart (5 buttons for 5 Fibo retracements and DEL button to clear chart from drawn retracements).
Position Point and Range inputs allow to place Fibonacci retracements in the right place on the chart.
MetaTraderマーケットは、開発者がトレーディングアプリを販売するシンプルで便利なサイトです。
プロダクトを投稿するのをお手伝いし、マーケットのためにプロダクト記載を準備する方法を説明します。マーケットのすべてのアプリは暗号化によって守られ、購入者のコンピュータでしか動作しません。違法なコピーは不可能です。
取引の機会を逃しています。
- 無料取引アプリ
- 8千を超えるシグナルをコピー
- 金融ニュースで金融マーケットを探索
新規登録
ログイン