 MetaTrader 5
 エキスパート
 インディケータ
 ライブラリ
 ユーティリティ
 ウィジェット
 ルール
YouTubeにあるマーケットチュートリアルビデオをご覧ください
ロボットや指標を購入する
仮想ホスティングで
EAを実行
EAを実行
ロボットや指標を購入前にテストする
マーケットで収入を得る
販売のためにプロダクトをプレゼンテーションする方法
MetaTrader 5のための有料のテクニカル指標 - 166
 テクニカル指標からのシグナルは、株式および外国為替市場での取引の開始と終了に重要な役割を果たします。指標の本質は、将来の価格変動を予測することを目的とした金融銘柄価格の数学的変換です。
テクニカル指標をテストして、市場の動きとそれからの利益をより正確に予測します。

QUORUM OSCILLATOR – Adaptive Market Regime & Momentum Oscillator
3層の分析。 2本のライン。 より包括的な相場分析を。
Quorum Oscillatorは、 極値分析、 サイクル挙動、 方向性効率を単一の視覚的オシレーターに統合したMetaTrader 5用のテクニカルインジケーターです。
相場状況にかかわらず一定の解釈を維持する従来のオシレーターとは異なり、 Quorumは計算ロジックを動的に適応させ、 レンジ相場では極値(買われ過ぎ・売られ過ぎ)の分析を重視し、 トレンド相場ではサイクル挙動をより重視します。
その結果、 トレーダーがモメンタムをより的確に把握し、 方向転換の兆候を捉え、 市場の異なる要素がいつ同調し始めるかを判断するためのツールとして機能します。
Quorumの独自性とは?
Quorumは相互補完的な3つのレイヤー(層)で構成されています。
Extreme Layer – 極値の検出 価格のレンジ内における相対位置を測るために反転させたウィリアムズ%R(Williams %R)を使

Anchored VWAP from structure, time and your own click. Anchorline Anchored VWAP draws up to eight volume weighted average price lines at the same time. Each line starts at a point you choose: the last swing high or low, the last BOS or CHoCH, the start of the day, week or month, the London or New York session start, or a candle you click. Standard deviation bands (+/-1 and +/-2) show how far price has moved away from each average. A compact panel lists every anchor with the distance from price i

Currency strength with an open formula: see which of the 8 major currencies leads and which lags. Tideline Currency Strength calculates the strength of USD, EUR, GBP, JPY, CHF, CAD, AUD and NZD from the 28 major and cross pairs and draws one line per currency in a sub-window. A panel ranks the eight currencies, shows a bar for each strength value and compares the rank on four timeframes (default M15, H1, H4, D1). It also names the pair that combines the strongest and the weakest currency, as a d

SMC Complete Toolkit is a technical indicator that operates on an “all-in-one” basis—it independently analyzes the market. It puts together all the key Smart Money Concepts tools into a single indicator: market structure, BoS , CHoCH and sweeps , order blocks ( OB ) with breakers , volumes , levels , fair value gaps ( FVG ) and structure mapping. No need to stack and configure many different tools. Attach the indicator to your instrument graphic and you are good to go with the default settings.

Channel Touch Pro detects price channels on three timeframes and gives bounce and breakout signals with a trend filter, entry, stop and target levels, alerts and a dashboard with historical statistics. What it does Builds channels from three confirmed swings (ATR zigzag) and numbers the touches. Bounce signal: arrow when price makes the fourth touch and closes inside the channel. Breakout signal: arrow when a candle closes outside the channel. Trend filter: an EMA (200 by default) can limit sign

Scalp Side Decider — Higher-Timeframe Bias & Realized Variance Oscillator Scalp Side Decider (SSD) is a quantitative directional bias and institutional volume exhaustion indicator engineered for MetaTrader 5. Designed specifically for scalpers and intraday traders, it eliminates counter-trend guesswork by measuring Signed Realized Variance , filtering out low-energy market noise, and isolating high-volume liquidity sweeps in real time. Instead of relying on lagging traditional oscillators that w

SHORT (for the product card): Liquidity pools, sweeps with strength, CRT on H1/H4/D1, SMT divergence, FVG and inverse FVG, kill zones - one clean panel, closed bars only. Sweepwell ICT Liquidity Suite marks where liquidity sits on your chart and shows when it is taken. It combines the ICT concepts that are discussed most often today - liquidity pools and sweeps, candle range theory (CRT), SMT divergence and inverse fair value gaps - in one indicator with one calm, readable look. What It Draws 1.

Buy Sell Signals — confirmed signals, entry, stop and three targets on one MT5 chart When a candle closes and a BUY or SELL signal is confirmed, Entry, SL and TP1–TP3 appear on the right side of the chart. Buy Sell Signals calculates the levels, marks target touches and shows when the modeled stop has moved to entry. You can follow the setup without drawing the levels by hand after every signal. How it works on the chart Wait for confirmation. The indicator checks where the candle closes relati
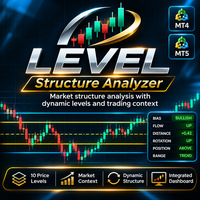
LEVEL Structure Analyzer Price Range and Closing-Price Distribution Indicator for MetaTrader 5 LEVEL Structure Analyzer is a technical analysis indicator designed to help traders understand market structure through 10 customizable price levels and an integrated information dashboard. It combines two complementary methods of price analysis: a broader structure based on highs and lows (RANGE) and a recent structure based on closing prices (CLOSE). These structures allow traders to observe price po

Tick-based volume delta and trend continuity indicator with a configurable rolling window and built-in crossover and divergence alerts. Key Features Tick-Inferred Volume Delta: Estimates aggressive buying vs. selling pressure directly from the broker's tick feed without requiring external data feeds. Configurable Rolling Time Window: Adapt the calculation window to fit scalping, intraday, or swing trading workflows across different timeframes and instruments (Indices, Forex, Metals, Crypto). Tre

Crab Harmonic PRO è un indicatore tecnico avanzato per MetaTrader 5, progettato per l'identificazione e il tracciamento completamente automatizzati del potente pattern armonico Crab di Scott Carney . Pensato per i trader professionisti, questo strumento offre un selettore di varianti flessibile che consente di passare facilmente dalla versione Standard Crab alla versione Deep Crab, più estrema , direttamente dai parametri di input. ️ Caratteristiche principali: Selettore di variante integrato

============================================================== 商品名 ============================================================== Daily Max Floating Loss Tracker MT5(デイリー最大含み損トラッカー)
============================================================== 短い説明(商品カード・検索結果用) ============================================================== 1日ごとの最大含み損と日利(確定損益)を並べてチャートに表示。チャートを閉じても、MT5を再起動しても記録が消えないインジケーターです。
============================================================== 説明文(全文) ===============================

SMC Structure Analytics Professional Smart Money Concepts Market Structure Indicator for MetaTrader 5 SMC Structure Analytics is a professional chart analysis indicator designed to simplify Smart Money Concepts analysis on MetaTrader 5. The indicator combines market structure, BOS, CHoCH, Order Blocks, Fair Value Gaps, liquidity levels, liquidity sweeps, Premium and Discount zones, session levels, and multi-timeframe bias into one clean and organized interface. It is designed for traders who wan

ゴールド、ビットコイン、シルバー、ナスダック向けトレンドシステム:主要トレンド方向へのブレイクアウトエントリー、価格を追うストップ、ロット計算機、ご自身の履歴での各銘柄の実際の統計。 発売記念価格 39 USD – 次の価格は 49 USD。ご購入後:PDF ガイドと設定の個別サポート。 RGT Trend Rider – ゴールドとビットコインの大きな動きに乗る チャート上に明確なプラン:どこでエントリーし、ストップはどこで、ロットはいくつか、そして表示中の銘柄でルールがどう機能したか。 仕組み
• 価格が主要トレンドの方向に直近レンジをブレイクすると BUY / SELL の矢印を表示。
• ボラティリティに基づくストップ(点線)が価格を追って動きを守ります。
• ストップに触れるとエグジットマークを表示。
• リペイントなし:シグナルは足の確定時に確定します。 パネル
• トレンド、保有ポジション、トレーリングストップ、含み損益。
• リスク%と口座サイズからのロット計算。
• ご自身の履歴でのルール統計:取引数、勝率、プロフィットファクター、結果、ドローダウン(スプレッド込

Grand Master Sunda Nuswantara – Auto Fibo, Daily Lock & Momentum Dashboard Daily-locked projection levels, Auto Fibo H4, Supply/Demand weekly, and a PGC momentum speedometer, with a plain-language market narrative on your chart. Description: Grand Master Sunda Nuswantara reads the market the way a discretionary trader does and writes the analysis for you on the chart. No TF tables to decode. What it does Daily lock: the intraday scan runs once per day. The Pink start line and the two M30 retest

The Double 40 indicator is the result of many years of financial market research, 90% of which was conducted on gold. Its mathematical model is universal and works perfectly on any chart for any instrument. The indicator is based on finding and creating a single price behavior pattern, which, once formed, determines the price movement with a high probability. The indicator uses two time frames, a higher and a lower one, to maximize profits. The indicator uses the Russian doll method, using small

モメンタムをより明確に把握し、複数の市場を追うためのツールを。 WaveTrend SuperSmoother Signals PRO は、平滑化された WaveTrend オシレーター、フィルタリングされた Buy/Sell シグナル、クリック操作に対応した市場スキャナーを MetaTrader 5 に提供します。チャート上でモメンタムを確認し、シグナルを上位時間足の方向に合わせ、注目する市場へ直接移動できます。 PRO は WaveTrend SuperSmoother Signals IRABC と同じシグナルエンジンを使用し、上位時間足のトレンドフィルターと、複数銘柄・複数時間足スキャナーという2つの実用的なツールを追加します。 オシレーター 価格の対数から WaveTrend を計算し、Ehlers SuperSmoother で平滑化します。 シグナルラインと移動平均線、および両者の距離を示すカラーヒストグラム。 インジケーターウィンドウ内の買われ過ぎ・売られ過ぎゾーンを塗りつぶして表示。 隠れダイバージェンスのロジックでフィルタリングしたクロスに基づく Buy/Sell

Everything in the free Range or Trend Detector, plus the tools to use it across your whole watchlist.
What you get:
- Alerts when the market switches between range and trend: popup, sound, phone push (MT5 app) and email. Sent once, at the bar close.
- Breakout arrows on the bar where a range ends and a trend starts. Closed bars only: arrows never move or disappear.
- Dashboard: up to 12 symbols x 6 timeframes on one panel, showing RANGE / UP / DOWN. Broker suffixes (for example XAUUSD.r or XAUU

This is the test product. Please, DO NOT BUY IT! This is the test product. Please, DO NOT BUY IT! This is the test product. Please, DO NOT BUY IT! This is the test product. Please, DO NOT BUY IT! This is the test product. Please, DO NOT BUY IT! This is the test product. Please, DO NOT BUY IT! This is the test product. Please, DO NOT BUY IT! This is the test product. Please, DO NOT BUY IT!
MetaTraderマーケットは、履歴データを使ったテストと最適化のための無料のデモ自動売買ロボットをダウンロードできる唯一のストアです。
アプリ概要と他のカスタマーからのレビューをご覧になり、ターミナルにダウンロードし、購入する前に自動売買ロボットをテストしてください。完全に無料でアプリをテストできるのはMetaTraderマーケットだけです。

取引の機会を逃しています。
- 無料取引アプリ
- 8千を超えるシグナルをコピー
- 金融ニュースで金融マーケットを探索