YouTubeにあるマーケットチュートリアルビデオをご覧ください
ロボットや指標を購入する
仮想ホスティングで
EAを実行
EAを実行
ロボットや指標を購入前にテストする
マーケットで収入を得る
販売のためにプロダクトをプレゼンテーションする方法
MetaTrader 5のためのテクニカル指標 - 45
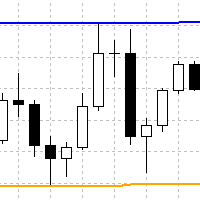
Indicator finds swing highs and lows, which are located between x bars to the left and y bars to the right. It plots such high and lows in form of continuous lines. Here is description of inputs. High Left Length - count of bars to the left for finding of swing high High Right Length - count of bars to the right for finding of swing high Low Left Length - count of bars to the left for finding of swing low Low Right Length - count of bars to the right for finding of swing low

MT5セグメント化ボリュームインジケーターは、価格とボリュームの分析、VSA、VPA、ワイコフメソッド、スマートマネーシステムを使用して取引する人を容易にするために作成されました。 セグメント化されたボリュームは、任意の市場(暗号、CFD、外国為替、先物、株式など)で機能し、任意のチャート時間で機能します。 解釈がいかに簡単かをご覧ください。 #緑:市場平均よりもはるかに多いボリューム #濃いピンク:平均よりも大きいボリューム #青:正の通常の音量 #赤:マイナスの通常の音量 #ピンク:少量 #黄色:超少量 MT5セグメント化ボリュームインジケーターは、ティックボリュームまたはリアルボリュームで使用できます。 それはあなたの意思決定を容易にするスマートマネーの動きを読むのに役立ちます。


Infinity Indicator MT5 1.0 Panel Asset Rate % EURUSD 96.0% GBPUSD 94.1% AUDCAD 90.5% USDCHF 87.8% BTCUSD 78.4% Panel Win Rate based on CandleMT4 Exit Button Calculates the StdDev standard deviation indicator on the RSI data, stored in the matrix similar to the keltner. input int HourCalculate = 12; RsiLength = 5; RsiPrice = PRICE_CLOSE; HalfLength = 4; DevPeriod = 100; Deviations = 0.9; UseAlert = true; DrawArrows = true; TimerWork=300; LevelUp = 80; LevelDown = 20; MoreS

Bollinger Prophecy is a multicurrency trending tool for technical analysis of financial markets. Draws 3 lines on the chart that show the current price deviations of the currency pair. The indicator is calculated based on the standard deviation from a simple moving average. The parameters for the calculation are the standard double deviation and the period of the moving average, which depends on the settings of the trader himself. A trading signal is considered when the price exits the trading c

The JAC Trend Indicator for MT5 was created to facilitate the identification of the market trend in an easy and agile way. # When JAC Trend indicator is green , we have a pre-trend to uptrend market. # When JAC Trend indicator is Red we have a pre-trend to downtrend market. # When JAC Trend indicator is gray , we have a sideways market without strength. That way you have all the sides that the Market can go to in a clear and objective way.

In finance, Z Scores are measures of the variability of an observation and can be used by traders to help determine market volatility. Z scores tell Traders whether a score is typical for a specified dataset or is atypical. Z scores also enable analysts to adapt scores from multiple datasets to make scores that can be more accurately compared to each other. # In practice, we have the ZScore with zero point and oscillations between 2 and 3 for ultra high high points and oscillations between -2 an

BetterVolumeTick it is a volume indicator. It marks the volume regions where there was a great aggression, also shows the volume intensity. Yellow means low volume, normal activity. Orange means activity with a pretty amount of volume. Red means ultra high volume. This indicator combined with the price chart will give you another view of the market context.

Descriptions
A point point is a technical analysis indicator, or calculations, used to determine the overall trend of market over different time frames. This indicator calculate the highest or lowest pivots among left x and right y bars and show the high/low level during that period. From that, you could clearly see the top resistance & bottom support level and how market goes break out.
Instructions
pivotLeft - pivot left bar count pivotRight - pivot right bar count pivotHighColor - c

Market Fractal Analysis, Fractal Swing, Market Flow Fractal Cycles looks for Similar Patterns in the Market that repeat themselves because of the Market Fractal Nature. These patterns are displayed with help of Graphical Objects and Alerts can be received on their arrival. Read the Blog for full information. Features:- Auto Detection of Patterns Customization for Color and Line Styles Alerts, Emails & Push Notifications

After forming a New Structure High the market will retrace creating a higher low. When this movement occurs, that NSH's now become an area of structure called resistance . As price action pushes up from the newly created higher lows, that resistance level becomes the last stand for sellers to stop the buyers from rallying.
IF the resistance level cannot be penetrated, THEN it's likely that we'll see either a period of consolidation or a reversal in trend. IF price action breaks through

ボリューム方向MT5
通常、現在の音量が前の音量よりも大きい場合、音量インジケーターにはデフォルトの色の変化があります。これは重要ですが、あまり役に立ちません。
このため、このインジケーターは、通常のボリュームに加えて、ろうそくが強気または弱気の場合、異なる色をペイントするように作成されました。デフォルトでは、強気の場合は青、弱気の場合は赤ですが、これらの色は トレーダーの好み。
あなたがあなたの取引を改善するのを助ける私の他の指標をチェックすることを忘れないでください。 ボリューム方向MT5
通常、現在の音量が前の音量よりも大きい場合、音量インジケーターにはデフォルトの色の変化があります。これは重要ですが、あまり役に立ちません。
このため、このインジケーターは、通常のボリュームに加えて、ろうそくが強気または弱気の場合、異なる色をペイントするように作成されました。デフォルトでは、強気の場合は青、弱気の場合は赤ですが、これらの色は トレーダーの好み。
あなたがあなたの取引を改善するのを助ける私の他の指標をチェックすることを忘れないでください。

A powerful oscillator that provide Buy and Sell signals by calculating the investor liquidity. The more liquidity the more buy possibilities. The less liquidity the more sell possibilities. Please download the demo and run a backtest!
HOW IT WORKS: The oscillator will put buy and sell arrow on the chart in runtime only . Top value is 95 to 100 -> Investors are ready to buy and you should follow. Bottom value is 5 to 0 -> Investors are ready to sell and you should follow. Alert + sound will app

MT5の通貨強度インジケーター は、初心者またはエキスパートトレーダーにとって革新的なソリューションです!通貨の強さの概念は、価格アクションと組み合わされ、8つの主要通貨の通常の28の組み合わせを除いて、任意のシンボル/ペアに適用できるため、まったく新しいレベルになります。つまり、すべての通貨、メジャー、マイナー、エキゾチック、コモディティ、クリプト(インデックスではない)を含む、任意のペアの長所または短所をトレードできます。これは、複雑な強度線を解読したり、複雑な強度線を解読したりすることなく、任意のペアの2つの部分の強度/弱さのバランスを視覚的に通知する色付きのバーを使用することにより、32個のシンボルを一目で明確に把握できる画期的な製品です。他の従来の通貨強度ソリューションと同様に、ヒストグラム。
MT5の通貨強度インジケーター は、あなたが注目し、最も取引したいペアを追加することにより、あなたの個人的な好みに合わせて32のシンボルボタンを構成するオプションを提供します。このように、あなたは一目であなたのチャート上で現在の市場の全体像を見ることができるので、あなたは機会を逃

Laguerre SuperTrend Clouds adds an Adaptive Laguerre averaging algorithm and alerts to the widely popular SuperTrend indicator. As the name suggests, Laguerre SuperTrend Clouds (LSC) is a trending indicator which works best in trendy (not choppy) markets. The SuperTrend is an extremely popular indicator for intraday and daily trading, and can be used on any timeframe. Incorporating Laguerre's equation to this can facilitate more robust trend detection and smoother filters. The LSC uses the
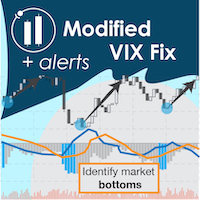
"The VIX Fix is a powerful indicator that detects market bottoms for any asset " The VIX (volatility index) is a ticker symbol of implied volatility of the S&P 500, calculated by the Chicago Board Options Exchange. VIX is a popular measure of market risk, and is one of the best measures of market bottoms that currently exists. Unfortunately, it only exists for the S&P 500... The VIX Fix was published by Larry Williams in 2007, and it synthesizes a VIX volatility index for any asset (not j
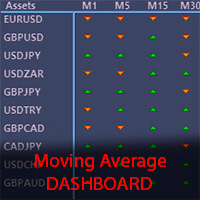
The Moving Average Dashboard indicator allows you to see the relationship between a fast and a slow moving average.
This indicator is working on multiple symbols and up to 21 timeframes. It's allows you to configure the fast and slow moving averages to whatever period, method or price is appropriate
The Moving Average Dashboard saves you time as you can use the indicator to scan multiple currency pairs or other symbols in just one window.
Installation Download the Indicator in your MT5 te

50+ Candlestick Patterns, Simulated Trading Results, Top Five Performers Candle Analysis extends Candlesticks Pattern Analysis by not only identifying Patterns but also recording the Past Performance of the Patterns. What it Does:- Identifies and plots results on chart Displays Top Patterns for both Bullish and Bearish type. Log can be printed in experts tab to see Simulated Trading results Displays All or Selected Patterns Alerts on Pattern formation More detailed information in Blog
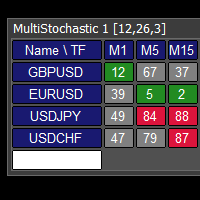
This tool monitors Stochastic indicators on all time frames in the selected markets. Displays a table with signals to open a BUY trade (green) or SELL trade (red). You can set the conditions for the signal. You can easily add or delete market names / symbols. If the conditions for opening a trade on multiple time frames are met, you can be notified by e-mail or phone message (according to the settings in MT5 menu Tools - Options…) You can also set the conditions for sending notifications. The li

This tool monitors MACD indicators on all time frames in the selected markets. Displays a table with signals to open a BUY trade (green) or SELL trade (red). You can set the conditions for the signal. You can easily add or delete market names / symbols. If the conditions for opening a trade on multiple time frames are met, you can be notified by e-mail or phone message (according to the settings in MT5 menu Tools - Options…) You can also set the conditions for sending notifications. The list of
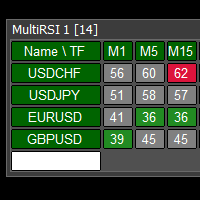
This tool monitors RSI indicators on all time frames in the selected markets. Displays a table with signals to open a BUY trade (green) or SELL trade (red). You can set the conditions for the signal. You can easily add or delete market names / symbols. If the conditions for opening a trade on multiple time frames are met, you can be notified by e-mail or phone message (according to the settings in MT5 menu Tools - Options…) You can also set the conditions for sending notifications. The list of s
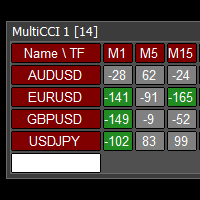
This tool monitors CCI indicators on all time frames in the selected markets. Displays a table with signals to open a BUY trade (green) or SELL trade (red). You can set the conditions for the signal. You can easily add or delete market names / symbols. If the conditions for opening a trade on multiple time frames are met, you can be notified by e-mail or phone message (according to the settings in MT5 menu Tools - Options…) You can also set the conditions for sending notifications. The list of s
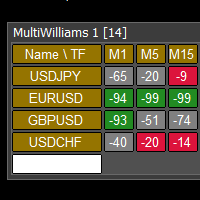
This tool monitors WilliamsPR indicators on all time frames in the selected markets. Displays a table with signals to open a BUY trade (green) or SELL trade (red). You can set the conditions for the signal. You can easily add or delete market names / symbols. If the conditions for opening a trade on multiple time frames are met, you can be notified by e-mail or phone message (according to the settings in MT5 menu Tools - Options…) You can also set the conditions for sending notifications. The li
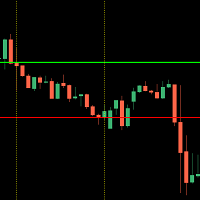
This indicator shows you the higher high and lower low of a certain period of time.
It is easy to use - select your desired time frame (current, 15Min, 1H, 1D) and the corresponding number of candles.
The indicator measures the highest and lowest point within the specified range and automatically draws the two corresponding lines.
The design of the lines is up to you!
Should the trend break one of the drawn lines with a closed candle, a message will be sent to you by the built-in alarm f

Trend Everest MT5 indicator is a trend following indicator that aids in decision making. It is based on the calculation of ATR that assist and the average hull. A key issue is that the Trend Everest MT5 nominee does not repaint, so you can backtest with greater confidence. When it is Green, UpTrend When it is a Red downtrend. Not that the Market is fractal, so the longer the graphic time, the greater its degree of assertiveness.

Looking for a quality pivot point indicator? So Prosecution is what you need! To identify pivot points, the Prosecution indicator analyzes many conditions, as the aggregate analysis provides a more accurate picture of the market situation.
What are pivot points? Pivot point analysis is often used in conjunction with the calculation of support and resistance levels, as is the case with trend line analysis. When analyzing pivot points, the first support and resistance levels are calculated
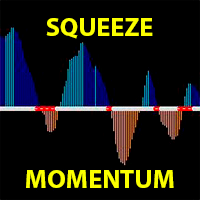
TTM Squeeze Momentum is a volatility and momentum indicator introduced by John Carter of Trade the Markets (now Simpler Trading), which capitalizes on the tendency for price to break out strongly after consolidating in a tight trading range.
This derivative Squeeze Momentum indicator attempts to identify periods of consolidation in a market. In general, the market is either in a period of quiet consolidation or vertical price discovery. By identifying these calm periods, one has a better oppo

Price reach indicator. It also serves as the perfect term for supports and resistance. I use it in two experts. The basic tool for professional trading. The indicator analyzes the last 500 bar and uses this to determine the levels ( but it doesn't predict the future ) . Personally, I use it on TF H1. It is very simple. Four lines on chart and that's all. Only two input parameters. Thousands of indicators. Why this? Is good ? No! Is very good. Please test the indicator prior to purchasing. You

価格チャネルは、現在の市場状況を分析するためのトレーダーの主要なツールです。その助けを借りて、あなたは将来の価格行動をうまく予測することができますが、利益を上げる主な要因はタイムリーな決定です。モニターを常に見ることは不可能であるため、これはしばしば問題になります。
このインジケーターは、異なる期間(高速と低速)の2つのトレンドチャネルを自動的に構築および更新します。傾向は線形回帰を使用して決定されます。自分で作成できるカスタムチャネルを1つ使用することもできます。
インジケータは、チャネルをパーセンテージゾーンに分割します。関心のある領域をパーセンテージで指定できます。価格がこのゾーンに達すると、通知が届きます。
このインジケーターの興味深い機能は、発散シグナルの受信です。これは、価格が異なる期間の反対のチャネルゾーンにある場合です。これは強いシグナルです。
「shift」パラメータは、チャネルを構築するときのスモールフォワードを定義します。
次の種類の通知を使用できます:電子メール、プッシュ通知、アラート、および任意のサウンドをwav形式で再生します。

Это классический вариант реализации экспоненциальной скользящей средней с коррекций ошибки, какой используется в индикаторах DEMA и TEMA. Соответственно названию, глубина коррекции ошибки увеличена до 33. Индикатор оптимизирован. Потребляет минимально возможные ресурсы. Достаточно быстр, учитывая объёмность вычислений. Может накладываться на другие индикаторы. Как и обычные скользящие средние, nEma_33 не перерисовывается (за исключением нулевого бара). Требуется история > Период*33*33. Согласно
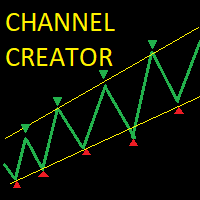
The auto-channel indicator creates a top line and bottom line that encloses a channel within which the symbol has been trading. The channel is created by finding high points for the top line and low points for the bottom line, these points are shown with arrows. A line of best fit is then plotted through these points and extended until the end of the chart. This indicator is useful for trading both within the channel and for breakouts. Inputs: MAPeriod - The moving average period over which the
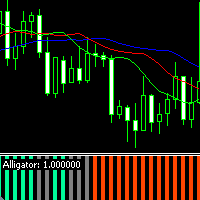
The modified Alligator indicator is designed as an oscillator. Facilitates the analysis of the Alligator indicator values by signaling the trader about market changes using a colored histogram. Histogram color values
Medium Spring Green - uptrend Orange Red - downtrend Gray - lateral movement (flat) Parameter values jaw_period - jaw period teeth_period - teeth period lips_period - lips period jaw_shift - jaw shift teeth_shift - teeth shift lips_shift - lips shift ma_method - method for calcula

The indicator connects the price in a cyclical-wave relationship. Thus, all intersection points will be optimal points at which the movement changes taking into account the indicator period. Crossing points can be used as potential market reversal points. But do not forget that the approach must be complex, the indicator signals require additional information to enter the market.
Suitable for forex, futures and binary options without redrawing. It gives a lot of signals, which requires additi
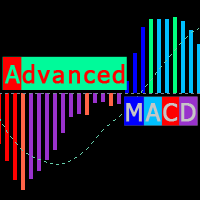
Modified MACD, for technical analysis of charts, with color backlight of histogram signals. The indicator highlights, the direction of the histogram movement, the change in the direction of the histogram movement, the histogram peaks, the interaction of the histogram and the signal curve. Also, the indicator makes it easier to find convergences / divergences between bars and the histogram (which serve as a powerful signal in some trading systems using the MACD indicator). Color designation of Ad

Clear Dom
This Indicator shows a pressure color box based on depth of market of the current symbol. Notice that it only works when book information is received.
You decide weather you want or not to display higher (ask) and lower (bid) levels of book.
The proportion ratio is calculated using volumes read from the book. You can read the actual pressure in the market any time.
Indicator parameters: color_Ask -> ASK box color and ASK value line color color_Bid -> BID box color and BID valu

This indicator shows supports and resistences calculated form historical data when market was swing. When market was swing ? When ADX was below 25 for some bars. In fact market can be considered without a trend. I mean and suggest timeframes H4 and Daily. Using that lines in the present you see resistance and support. More lines are distant and best is possible profit. Every ADX parameters can be set, so colors, swing market bars number.
I am available to get feedback or modify code. Thanks Al

このインジケーターは、現在の時間枠でより高い時間枠の予測を作成します。色付きのキャンドルの形での視覚化。市場内のプロセスとその規模およびダイナミクスをよりよく理解するのに役立ちます。これらすべてがインスピレーションの源となり、成功する取引戦略を見つけるための正しい道につながる可能性があります。インジケーターはローソク足パターンの検索を簡素化します。異なるパラメーターで複数のインジケーターを有効にして、同時に多くの時間枠を表示することができます。設定では、各方向のキャンドルの色と幅を変更できます。インディケータは、トレーディングアドバイザーと組み合わせてツールとして使用できます。時間枠オプション-現在の時間枠より大きくする必要があります。大きくしないと、インジケーターが起動せず、エラーが報告されます。以下は、さまざまなモードとテスターでの作業方法を示すビデオです。 重要!インジケーターに何も表示されない場合は、時間枠パラメーターが正しく選択されていないか(現在のパラメーターよりも大きい必要があります)、端末に選択した時間枠の履歴がありません。それをロードするには、この時間枠でチャートを

1. What is this Rising volatility and falling volatility are not the same, whether it is academic research or actual testing has shown this point. The original ATR indicator is calculated by putting up and down fluctuations together. This indicator is to calculate separately the upward volatility and the downward volatility, which can better help you study the market.
2. Indicator description There are two modes for the calculation of this indicator, as shown in the f

Индикатор с уникальным авторским алгоритмом определения направления тренда. Показывает лучшие результаты определения тренда на любых валютных парах, акциях, криптовалюте без перерисовки результата. Имеет встроенную статистику, что поможет сразу определить прибыльность текущей пары и таймфрейма. Использует паттерны Price action в связке с уникальным алгоритмом фильтрации. Подходит как новичкам так и профессионалам для всех видов торговли. Как выбрать прибыльный таймфрейм и оптимизировать индикато

Stochastic Cross Arrow is an indicator that automatically places arrow when stochastic K and D line crosses each other on a certain level.
Buffer Guide For Developers: Buffer 0 =Buy Arrow Buffer 1 =Sell Arrow Inputs: ---Stochastic Settings--- %K - %K value. %D - %D value. Slowing - Slowing value . Stochistic Method - Moving Average method. It can be any of enumeration values. Newbar - arrow only appear on new bar. Buy_Msgs - type info message when buy arrow appears. Sell Msgs - type inf
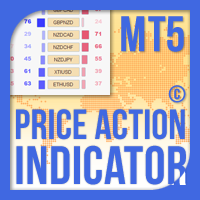
価格アクションインジケーターMT5は、指定された(デフォルトでは8)過去のろうそくの純粋な価格アクションデータに基づいて、任意のシンボル/楽器の売買力レベルのバランスを計算します。これにより、インジケーターのパネルで利用可能な32のシンボル/商品の価格アクションを監視することにより、可能な限り最も近い市場センチメントが得られます。 60%を超える売買力レベルは、特定のシンボルを売買するための非常に堅実なレベルを提供します(デフォルト設定を使用)。価格アクションインジケーターMT5には、価格アクションへの標準、高速、または低速の近接に使用できる3つの計算モードがあり、リアルタイムの動きにシャープまたはスムーズに適応するために調整可能な数の価格アクションキャンドルも提供します。
価格アクションインジケーターMT5は、あなたが注目し、最も取引したいペアを追加することにより、あなたの個人的な好みに合わせて32のシンボルボタンを構成するオプションを提供します。このようにすると、チャート上の現在の市場センチメントの全体像を一目で確認できるため、チャンスを逃すことはありません。さらに、現在の時

The Pirates MACD is a Momentum Indicator that shows us not just the Classical MACD, it also shows us high priority trades. the user has an option of selecting among several options the best settings that suits their trading style, even if one has no trading style, Pirates always find a way to survive hence the Pirates MACD is equipped with easy to understand tools. that reduce the strain on ones analysis giving them visual advantages over classical MACD techniques.
This product is made as an
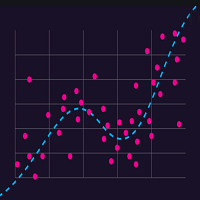
The Regression Channel consists of two lines equidistant above and below the regression trend line. The distance between the channel boundaries and the regression line is equal to the deviation of the maximum closing price from the regression line, only this definition corresponds to the most recent regression points.
The term regression refers to the field of statistics. The center line of the channel is the trend line. To calculate it, the method of least squares is used. The line above the

The utility helps to locate in the lower time frames the maximum and minimum of the upper time frame. The length of time frame level line represents the temporal length of the upper time frame. It's possible to OnOff the levels with a button or keys
The indicator draws lines that delimit the upper time frames candle and highlights his high-low price and the pips candle range. How it works:
Firstly . Choose which time frames levels to represent in the lower ones : monthly, weekly, da
Unlike a standard moving average, trendy traders unique algorithm will show you a less choppy signal resulting in a smoother and easier trend to follow thereby making your trading decisions more confident. Put simply when price moves above the average it signals a bullish trend and when price moves below the average it signals a bearish trend. The trader is then given 2 levels of take profit and a stop loss on each new signal. It can also be added to other trend-following systems for better pe

the indicator will show signal arrows on the graph at the crossing of Awesome Oscillator base level it has push and audible alerts and Email alert. By crossing above base level , a blue arrow will come out for the BUY, at the same time an audible signal will sound. By crossing Below base level, a red arrow will come out for the SELL, at the same time an audible signal will sound. Possibility to deactivate push and audible alerts.
MT4 version : Buy the 'Awesome cross' Technical Indicator for

Индикатор "Tiger" показывает развороты рынка. Основан на индексе относительной бодрости (RVI).
Представлен в виде осциллятора, который показывает энергию текущего ценового движения и отражает уверенность ценового движения от цены открытия к цене закрытия в диапазоне максимальных и минимальных цен за данный период. Это, в свою очередь, даёт трейдеру возможность находить точки разворота с большой вероятностью.
Не перерисовывает!
Хорошо показывает себя на боковом движении рынка, которое п

Brief description The ContiStat indicator calculate statistic frequency of green (up) and red (down) movement in the chart and determine movement dynamics (silver curve). There are two key parameters to understand the ContiStat principle: Block height and Block count . The ContiStat engine convert instrument price chart move to Blocks of constant height (price) regardles of how much time it take. Example 1: Block height is set to 50. DE30 index price make move from 15230 to 15443 in an hour. 4 g
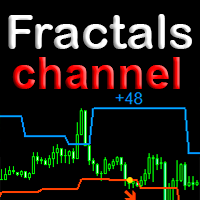
Trend indicator with a unique algorithm for detecting trend reversals. It uses Price Action and its own filtering algorithm to determine the trend. The algorithm is based on a price channel based on chart fractals. This approach helps to accurately determine the entry points and the current trend on any timeframe. Recognize a new emerging trend with fewer false positives without delay. Peculiarities
The advantage of the indicator is that its period is dynamic. Since it is tied not to the number

Info: marcobarbosabots
Pivot lines are an easy way to see market trend. The indicator provides the pivot line and three first support and Resistance lines.
Calculations used was:
Resistance 3 = High + 2*(Pivot - Low) Resistance 2 = Pivot + (R1 - S1) Resistance 1 = 2 * Pivot - Low Pivot point = ( High + Close + Low )/3 Suport 1 = 2 * Pivot - High Suport 2 = Pivot - (R1 - S1) Suport 3 = Low - 2*(High - Pivot)
You can use the calculated values on an EA too, just make sure the indicator

The Qv² Trend is an indicator that aims to identify trends.
Buying trend signals are indicated by arrows pointing up.
Selling trend signals are indicated by arrows pointing down.
It can be used in all deadlines.
It can be used in all pairs.
I use it on the H1 with a period of 24. Important Recommendation: Make sure you trade in trend market. Good Trades, in trend market
KF CROSS 3MA
This indicator show the collision points of moving averages in a separate window. so we will have a solitude chart. Features indicator: Show alert in Meta Trade Send notification to mobile Adjustable 3 MA (Fast-Middle-Slow) Can be used on all symbols Can be used in all time frames
Attention, the application does not work in the strategy tester
You can download the Demo version on the comments page : https://www.mql5.com/en/market/product/81152?source=Site
or cotact us : ht

ここに、デリバティブmt5取引プラットフォームでのBOOM合成インデックスによる取引に革命をもたらす指標があります。
ゴッドスパイクブーム。
主な特徴:
BOOMインデックスでのみ機能します。 トレンドフィルターがあります。 市場が上昇しているときにのみアラートを送信します。 サウンドアラート。 あなたはモバイルにアラートを送ることができます。
使い方:
m1とm5の一時性に適用します。 サウンドアラートを待ちます。 強い傾向があるか、それがすでに始まっていることを分析します。 トレンドの終わりに警戒しないでください。 合理的な毎日の利益を見つけます。 保有する資本に対して適切なリスク管理を行う。 レバレッジをかけすぎないでください。
詳細についてはお問い合わせください:
WhatsApp:+5930962863284

An customize Indicator by which you can have Triple moving averages at close prices and send push notification on each crossing. This indicator is especially useful when you are doing manual trading. Notes: Cation: forex trading is a very risky business,... don't invest the money you cannot bear to lose. the probability of losing is high ... more high aaaand exponentially high.... something like EMA enjoy losing with us...

This is a multi-symbol and multi-timeframe table-based indicator designed for a candlestick patterns detection with 46 patterns for META TRADER 5. Each formation has own image for easier recognition. Here you find most popular formations such as "Engulfing", "Hammer", "Three Line Strike", "Piercing" or Doji - like candles. Check my full list of patterns on my screenshots below. Also you can not only switch all bearish or bullish patterns from input, but also select formation for a specified symb
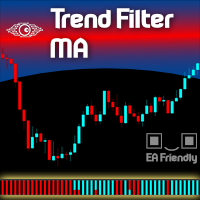
One of the best tools category for an Expert Advisor is the Filtering System . Using a filter on your entries will take your metrics to the good side. And even when you trade manually a filtering system is more than welcome. Let us present a commonly used filtering system based on Exponential Moving Averages - in fact, you can choose the type of the MAs as you wish and also mix them all up - we called this indicator Filter Trend MA . We present this indicator as a colored strip you can use at th

It will perfectly complement your working Expert Advisor or manual trading with up-to-date information.
There is a sound notification of exceeding the established profit and loss limits of open SELL and BUY orders.
Moreover, for each currency pair EURUSD, GBPUSD, XAUUSD, and others, various sound alerts are activated in English.
Indicators are displayed on a special panel on the chart from the moment the indicator is activated: Elapsed time
Fixed profit
Current profit Maximum drawdown Curr

The Bridge indicator displays potential entry points on the chart as signals (points of absolute trend reversal).
The Bridge forex indicator algorithm was created on the basis of the original indicators for searching for extremes, the indicator is well suited for determining a reversal or a large sharp jerk to one side, thanks to it you will know when this happens, it will notify you with the appearance of a blue dot to buy red to sell. The indicator, according to a certain algorithm, qualifi
This indicator is based on the same famous fractal indicator with a slight difference:
MetaTrader version 4 click here
Advantages:
Works on all instruments and time series,
Does not redraw its results,
Comparison depth is adjustable,
Works well with any popular strategy,
Adjust the power of fractals
Input settings:
Number of comparisons - The number of candles that each side selects for comparison.
Marker distance from the candlestick
You
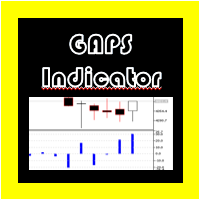
GAPSインジケーターメタトレーダー5
指数、株式、その他の資産で使用される戦略の一部では、通常、各ローソク足のギャップが測定されますが、これを手動で実行する場合、計算エラーが発生する可能性があります。
このため、「GAPインジケーター」が作成されました。これは、各キャンドルの間に提示された各GAPSのPIPS値を自動的に表示し、オプションがアクティブになっている場合、それらが表示されたときにアラームを生成します。 GAPSインジケーターメタトレーダー5
指数、株式、その他の資産で使用される戦略の一部では、通常、各ローソク足のギャップが測定されますが、これを手動で実行する場合、計算エラーが発生する可能性があります。
このため、「GAPインジケーター」が作成されました。これは、各キャンドルの間に提示された各GAPSのPIPS値を自動的に表示し、オプションがアクティブになっている場合、それらが表示されたときにアラームを生成します。

(自動翻訳) ほとんどのトレーダーは、1700 年代に 本間宗久 によって作成された有名な日本の 平均足 指標を知っています。 Heiken-Ashi と 綴られることもありますが、意味は同じで、日本語の「平均的なバー」です。 これは非常によく知られた 平均足 インジケーターの実装ですが、いくつかの機能が追加されています。 1 つは、値が ボリューム (ティックカウント ボリューム 、 実際のボリューム 、または真の範囲に基づく 疑似ボリューム) によって重み付けされることです。主な利点は、特に取引高が少ない期間における誤った反転の数が減少することです。また、高値と安値の尾引きを遅くするのにも役立ちます。 オプションとして、バーの実際の範囲に基づいた 疑似ボリューム の使用が可能になります。これは、実際のボリューム データもティック カウント ボリューム データも利用できないシンボルに役立ちます。 追加機能として、このインジケーターには、ストップに使用できる最大変位のレベルも表示されます。 その計算の基礎を理解しているトレーダーはほとんどいませんが、 平均足 は実際には指数移動平均に基

Indicator that shows you at any time the current number of closed deals as well as profit and loss totals of the closed deals of the account that you're logged into for a configurable period.
To do this, it is best to load Deals and "Complete history" in the account history in the terminal and then enter the desired period in the indicator (e.g. 2022.01.01-2023.01.01 would be for calendar year 2022).
Input options:
- Period (Attention: corresponding data must be loaded into the account h
This indicator is based on ParabolicSAR. This indicator does not change the trend easily and does not change the trend until it receives a clause and approval. This indicator can be used for trail stop or trend detection.
MT4 Version
benefits:
Works on all instruments and time series,
Does not redraw its results,
Comparison depth is adjustable,
Works well with any popular strategy,
The power of the areas is adjustable,
We assure you that we we

Indicator - HotKeys allows you to make your work in the MT5 terminal more comfortable
Indicator features: - Calling the creation of an object on the chart with keyboard shortcuts - Enable/disable auto scroll - Quick switching between main custom templates
Preset keyboard shortcuts: - Rectangle - Q - Fibo - E - Horizontal level - R - Cut - T - Auto Scroll - A
You can assign other keyboard shortcuts (capital letters of the English alphabet only)
Important: The indicator does not allow

Hello Traders
I have created this indicator to Catch SPIKES on Crash1000, Crash500 and Crash300. Follow the below mention instruction for better Result
1. When Red arrow pop up on the Chart, Take a Sell entry
2. Stay in trade until price break below from entry
3. Do not hold trades after all trades went in Blue
4. Keep adding position until spike cross below from intial entry
See Example for more assistance

The indicator helps to enter a trade following the trend, at the same time, after some correction. It finds strong trending movements of a currency pair on a given number of bars, and also finds correction levels to this trend. If the trend is strong enough, and the correction becomes equal to the one specified in the parameters, then the indicator signals this. You can set different correction values, 38, 50 and 62 (Fibonacci levels) are better. In addition, you can set the minimum trend lengt

A machine translation from English product description was used. We apologies for possible imprecisions. 英語の製品説明からの機械翻訳が使用されました。 不正確な可能性があることをお詫び申し上げます。 お気に入りのろうそく足の価格アクションパターンの視覚化システム。 アタッチされると、インジケーターはチャート上の次のパターンを自動的にマークします。 ピノキオバー - 長い「鼻」を持つ小さなボディのバー、非常によく知られている逆のパターン。 内側のバー - 範囲が前のバーの範囲内にあるバー。 それは市場の不確実性を表しています。 外側のバー - 範囲が前のバーの範囲を超えるバー。 それは市場の不確実性を表しています。 レールパターン - ほぼ等しく、より大きなボディを持つ 2 つの結果として生じる反対側のバー。 逆のパターン。これは、より高い時間枠のピノキオバーパターンと実際に一致します。 マスターキャンドル パターン - キャンドルの 5 つ、後続の 4 つのキャンド

This simple, yet powerful indicator is very good way to determine actual S/R levels. It's main purpose is making your overview on markets much better.It has built-in arrow signal system, which should be used along with MT indicators for best results.Just try it.
Recommended MT indicators to use along:
Bollinger Bands (default) RSI (period 3, levels 10/90)

このインジケーターをチャートに追加し、ZigZagのExtDepth設定を設定します
価格がトレンドラインのアッパー、ロワー、またはミドルチャネルに触れると即座にアラートを出します
特徴 :
-上、下、または中線のアラートを有効/無効にします -アラートの後に一時停止を数秒で追加 -チャート上のボタンでトレンドチャネルを一時停止または一時停止解除 -入力フィールドにポイントを追加して早期アラートを追加します。たとえば、ETH価格は2900.25で、ここでは25桁が「ポイント」です。したがって、入力フィールドに25をポイントで追加し、トレンドチャネルの下線の値が2900.25の場合、次のようになります。 2900.50に早期アラートを受け取ります(設定から25ポイントを追加)
-方向性タッチを有効/無効にします。詳細についてはスクリーンショットを参照してください。価格が下からの抵抗と上からのサポートに触れる場合、方向性タッチが考慮されます。この機能は、複数のアラートからのノイズを回避するために追加されます 1分から5分のチャートで下取りする場合、Extdepthへの推奨

BeST Swing Strategy MT5 is a Metatrader indicator based on the corresponding Jim Berg's work about volatility as described in his article "The Truth About Volatitlity" (TASC 2/2005).The indicator consists of 2 channel lines deriving as (MA+/- times the ATR) and can be used as a standalone trading system.The outlier prices of the Market as of the indicator's values can be used for producing Entry and Exit Signals.
Advantages of the indicator
== Uses 2 Swing Strategies
== Never repaints it
MetaTraderマーケットは自動売買ロボットとテクニカル指標を販売するための最もいい場所です。
魅力的なデザインと説明を備えたMetaTraderプラットフォーム用アプリを開発するだけでいいのです。マーケットでプロダクトをパブリッシュして何百万ものMetaTraderユーザーに提供する方法をご覧ください。
取引の機会を逃しています。
- 無料取引アプリ
- 8千を超えるシグナルをコピー
- 金融ニュースで金融マーケットを探索
新規登録
ログイン