YouTubeにあるマーケットチュートリアルビデオをご覧ください
ロボットや指標を購入する
仮想ホスティングで
EAを実行
EAを実行
ロボットや指標を購入前にテストする
マーケットで収入を得る
販売のためにプロダクトをプレゼンテーションする方法
MetaTrader 4のための有料のエキスパートアドバイザーとインディケータ - 165

Reverse Trend Solution And Trade Panel For All Symbols In One Tool! MuteLight AK Trade Pro's smart algorithm monitor the markets price, filters out noise and gives recommendation of entry time. Monitor different pairs in one chart Support to open, monitor and close orders automatically Trade Panel allow to open market or hidden pending orders with preset parameters to best fit different market condition.
Advantages You Get Easy, visual and effective reverse trend detection. Gives you the abili

Bot blocks trading when daily drawdown limit or maximum losing trades number are achieved. Bot makes sure that there is a 5-minute pause after each losing trade. Also Bot lets to place price alerts from mobile terminal (android/ios) and send it by Email, Push, or Terminal Alerts. Just place any pending order from your mobile device and delete it within 10 seconds, Bot will remember the order price and create Alert. If pending order don’t remove within 10 seconds, Bot set Stop Loss and Take Profi

Trending mathematical expert with the ability to work both on trends (default settings) and in the flat, depending on the chosen mode of work. The EA is independent of current market factors and will always work, everywhere and on most trading instruments, including indices, oil, gold, shares, etc. The essence of the strategy is this: At the beginning of the new day (default at 01-30) by terminal time, two deals are made in the same lot for the purchase and sale at a distance of the ATR volatili
ADX
Welcome to the ADX Crossover Trader ================================= The Robot is based on ADX Crossovers. You decide which time frame. The Ea has the following settings Recommended Time Frame EUro / CHF Day On the lower Frames there are too many small trades but its up to yourself. I would recommend to test it on a Cent Account if you are not sure. The Ea has been created by myself and i use it as well for my private trading. The EA has more settings It can be used as Fixed TP and SL

This is the old version of North East Way Ea.
North East Way EA for MT4 terminal will not be developed.
In accordance with the rules of mql5.com, I will continue to support this EA and, if critical errors are found, I will fix them.
I recommend that you use the NorthEastWay MT5 version of my EA . North East Way EA は、完全に自動化された「プルバック」取引システムであり、人気のある「プルバック」通貨ペア(AUDCAD、AUDNZD、NZDCAD)での取引に特に効果的です。 このシステムは、外国為替市場の主要なパターンを取引に使用します。つまり、あらゆる方向への急激な動きの後の価格のリターンです。 時間枠:M15
基本通貨ペア:AUDNZD、NZDCAD、AUDC

This is automated version of my ProTrend Indicator (20x5* reviews) - so please look on indicator first how it works
---- https://www.mql5.com/en/market/product/47367 ----
It works based on the result of multiple EMAs, with some specific averaging and algorithm . Output of an EMA is the input for another EMA.
Works on Forex, Commodities, Indicies, Stocks, Crypto, ... on all timeframes (but recommend 1H or 4H) and on every brooker.
If you want this and all my other products for FREE ,

Hello all The expert works on the Renko chart Watching the video explains how Renko works With expert work. Work like expert image settings as shown in the image First, the Renko chart generation expert only works with the market
Wait for the market to work and try like explaining the video Parameters:
Lot1: Manual Lot Size Auto_Lot: Set true to automatically calculate optimal Lot Size based on risk preferences, Set False if you want to use manual lot size. Max_Risk: Max Risk as percentage
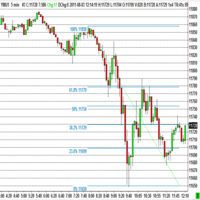
The program automatically draws fibonacci. This will save you a great deal of time in studying the chart. My intention is to facilitate those who carry out a study of the graph manually and use Fibonacci. In the screenshot you can see the result.The script applies to the chart of any currency pair or any stock. It will not open any purchase or sale operation because this program is limited only to drawing fibonacci.

SCALP ARROW EXIT SIGNALS
PLEASE REFER THE COMMENTS AREA - HOW THE SIGNALS CAN BE MADE BETTER QUALITY USING RENKO CHARTS IF YOU REQUIRE THE RENKO CHARTS DO LET ME KNOW , WILL HELP
Indicator is a professional tool for guiding reliable entries, exits, reentries, and RETRACEMENT entries and pull back entries. It is a complete blackbox system and can be used to get signals for any instrument and any time frame. The indicator generates signals, alerts - ENTRY -EXIT . Its can be used to scalp -

Trend Line Chart Pattern Signals Is a traders Tool for Signals based on Strong Patterns Formed By a pair of robust trend lines. They FOR WITH DIFFERENT POPULAR PATTERNS ON CHARTS LIKE – TRIANGLES, FLAGS,RANGE , ASCENDING TRIANGLES, DESCENDING PATTERNS, PENNANTS ETC. The TREND LINES form dynamically on running bars. The sensitivity of the trend lines can be changed by custom settings. The Buy and Sell Signals Generate upon Break Of the Trend Line + "Close" of the same bar above the previo
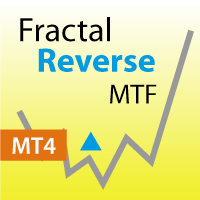
Fractal Reverse MTF - Indicator for determining the fractal signal to change the direction of the trend for МetaТrader 4.
The signal is determined according to the rules described in the third book of B. Williams:
- In order to become a signal to BUY, the fractal must WORK ABOVE the red line
- In order to become a signal for SALE, the fractal must WORK BELOW the red line
- Signals are not redrawn/ not repainting
The main idea of the indicator:
- Determine the change in the dire

The Grid stability plus semi automatic expert Advisor trades on the signals of the RSI indicator. Trades are made in different directions when the indicator reaches values of 30 or 70 . If the indicator is greater than 70 , the Short direction is selected for initial trades, and if the indicator is less than 30 , the Long direction is selected. Profitable trades are closed by take profit. Unprofitable ones are processed by the expert Advisor using the averaging method, a network of transactions
The Simple Lot Size Calculator can help you with risk management. Just type risk percentage, stop loss points and click calculate to get required lot size. The Simple Lot Size Calculator calculates a current chart's instrument. It's lightweight. Just load it to your chart then The Simple Lot Size Calculator will apper in the left upper corner of your chart.

The adviser uses a strategy based on trading in the daily interval of the chart using the M5, M15, M30 timeframe. Advisers calculates the signal using technical indicators and only on the daily time intervals. The EA uses an intelligent algorithm for partial closing of an order in profit, thereby minimizing the lot size and in case of a price reversal, the loss will be small. Each position is strictly protected by stop loss. A multi-currency adviser trades in 26 currency pairs. Use multicurrency

Multi-Time-Frame-Multi Currency Signals Dashboard Indicator It is an Advanced multi-utility dashboard which works with full customization of signal settings and graphical interface. It works with Multi Symbols and Multi-Time frames from 1 SINGLE CHART TEMPLATE. It will automatically open the charts where the latest signals had formed- showing the important levels (Entry, Targets, Stop Loss) Many types of sorting methods for the scanner. A robust ENTRY based on TREND OF MULTI-TIME FRAMES ( Co

時に顧問と動的最後の停止と最後の益となりました。
OpenTimeTral2エキスパートアドバイザは、指定された時間に選択された注文タイプを設定し、最初のマーケットオーダーに動的なトレーリングストップとトレーリング 注文タイプの選択に関する制限: 1. できるだけ選択タイプのいずれかを購入または売れない。 選択した成行注文では、保留注文を選択することはできません。 2. 保留中および指値注文は、任意の組み合わせで選択できます。 最初の保留中または指値注文を成行注文に変換した後、残りの保留中および指値注文は削除されます。 動的な最後の停止で使用する。 Stoplossは、買い注文の現在の入札価格と売り注文のAsk価格からトレーリングストップ値を超えない距離で修正され、線形またはフィードバック加速式を使 TakeProfitでは、一定の末尾の値も使用されます。 現在の価格がテイクプロフィットレベルに近づくと、テイクプロフィットはトラリングプロフィット距離によって変更されます。 TrailingStopまたはTrailingprofitが必要ない場合は、対応する値0を選択します。 トレー
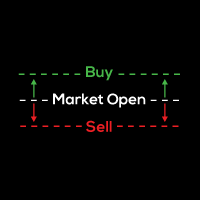
戦略の簡単な説明: コンサルタントは、3つの主要市場(ニューヨーク、ロンドン、東京)の公開市場で発生する大きな価格変動を利用することを目指しています。アドバイザー「ストラドル」(買い注文を上に、売り注文を下に置く)-市場の始値または始値前の価格帯。多くの運用入力/出力フィルターは、複数の期間にわたって使用され、トレンドの方向で運用が実行されることを保証し、アドバイザーに悪い市場条件を回避するためにアドバイザーを提供します。アドバイザーは、高度なリスク管理と転倒防止機能を備えています。 GBP / USDでテストされ、さらに6ペアがテストされています。
結果: 1.これは、2007年1月1日から2009年1月1日までのGBP / USDの過去のテストに関するビデオへのリンクです。 Tick Storyから取得した100-1のレバレッジを使用し、実際の実行スプレッドを遅延させたクォートデータを使用して、履歴のテストをすべて実行します。 https://drive.google.com/open?id=14tGwt8mc_cdaakOky5XVnquAZMpkN_y0

Советник основан на алгоритме, который позволяет определять вход больших объемов как в текущем, так и в обратном направлении.
Он имеет функцию защиты от отложений, когда функция активируется без потерь. В этом случае рентабельность будет ниже, но с повышенной безопасностью для аккаунта.
Настройки позволяют использовать как среднесрочную торговлю, так и скальпинг, все зависит от настроек.
Он работает на всех временных интервалах и на всех инструментах с различной стабильной производительно

外国為替トレーダーであれば、テクニカル分析における フィボナッチ 取引戦略の威力を理解しているでしょう。ただし、フィボナッチ レベルを手動で描画および調整するには時間がかかる場合があります。そこで、貴重な時間を節約するために Fibonacci Of Yesterday EA が登場します。前日の価格変動に基づいたフィボナッチ戦略を使用した取引専用に設計されており、この革新的なツールはフィボナッチレベルに基づいてエントリー、ストップロス、テイクプロフィットレベルの識別を自動化します。この自動化により、取引プロセスが合理化され、効率が向上します。この EA には、最新のトレーリング システムと包括的なリスク管理システムも備えており、取引を効果的に管理するのに役立ちます。
Fibonacci Of Yesterday EA を使用すると、特定されたフィボナッチ レベルに基づいて取引を迅速に開始および終了することで、迅速な市場活動を活用できます。さらに、EA は通知アラートを提供し、取引プラットフォームから離れているときでも市場の動きに関する情報を提供します。 Fibonacci O

Trend Scalper EA is developed based on AI driven technology that focus on co-relation factor, divergance and trend reading. I think the EA is first time introduced in MQL Market which is suitable for intraday players. The EA is fully automated, no manual intervention required once it is set up. The EA works on multi currency pairs which gives advantages to catch trend and this gives maximum possibility to get smaller profits in very short time and get your basket with a good number at the end
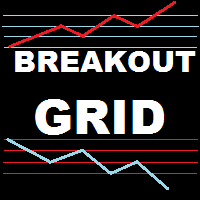
This expert is a combination between a grid and a scalper and it uses a grid of ten pending orders , five for long and five for short , with a 500 point spacing between them with a 100 point scalp target. It has three working modes , first , the entry by level , the expert starts operation when the price aproaches an important trade level ( a former resistance or support) , second , the entry by time , launches the expert at a specific time (input by user) and the third type is continuous operat

This EA has been developed for GBPUSD H1 TF. It also works very well on EURUSD H1 TF. Everything is tested and ready for immediate use on real account. You will get 2 strategies for lower price, that means better equity curve, higher profits and lower drawdowns. Everything is tested for H1 timeframes . Strategy is based on breakout of the CURRENT BAR OPEN and as a filter is used Bollinger Band indicator . It enters if price is outside the Bollinger Band after some time of consolidation . It

Working long-term EA for GBPUSD, EURUSD H1 . By long term I mean profits are generated in long-term, because EA itself is a day trader. There is always max one trade active, always sl and tp, EA is active in day hours
Money management is to be provided in the adviser. For management you may choose to use:
a fixed lot for opening positions an adaptive lot that opens a transaction with a percentage of the deposit

Fibonacci indicator based on fractal.This software can automatically draw the golden section proportional line of two trend lines, and mark all the recent high and low prices.And the percentage value of volatility is a multi-cycle, multi-currency oscillation indicator.It is very effective for traders to find support and resistance lines and find entry and exit points near them.

This Expert Advisor base on ichimoku stratergy. Ichimoku setting is default (9,26,52). Available to modify default value. Price above cloud is BUY signal while below cloud is SELL signal Timeframe M15 (recommended). Pairs GBP and Gold (recommended). Other pairs (takeprofit and stoploss must be adjusted based on backtest data). All trade parameters are in points (1000points = 100pips). Available trailing stop for position trade.

NOTE: The setting CloseDaily = true-open trade will close at the end of the day; false-open trade will not close until hit stoploss or takeprofit Initial_Lot = initial position size maxLot = maximum position size for martingale strategy TP = take profit (600points = 60pips) SL = stoploss (300points = 30pips) No_trade = number of maximum lossing streak.(eg. 4 trade,after 3 lossing streak next position size = initial_Lot. Open_hour = London open time base on mt4 time. Multiplier

Moving Average EA
=============== This Robot is fully automated and has been created for everyone. The Robot works also on cent accounts.
The Ea is based on Moving averages ========================================= You can set up which Moving Averages you want to cross. But keep in mind if you use a smaller frame you will get more signals.And also consider the profit when there was a crossover but the market is trading sideways. Maybe better to go for small profit, set it on higher time fr

This is a price channel that shows five important price levels on the chart. Those levels are: 1. The Highest High (HH) of the previous x bars.
2. The Highest Low (HL) of the previous x bars.
3. The Center Line.
4. The Lowest High (LH) of the previous x bars.
5. The Lowest Low (LL) of the previous x bars. How does Bermaui Channels Captures Overbought area
Think of the distance between HH and HL levels as an overbought area.
When the price candles or bars crosses the HL to the upside this

ECHO INDICATOR V2.2 Update
A top-quality indicator works with trend and pattern. The tool is a good assistant for the traders use various levels in trading.
When price approaches a level, the indicator produces a sound alert and (or) notifies in a pop-up message, or via push notifications. A great decision making tool for opening orders. Can be used any timeframe and can be customized
Easy to trade It implements alerts of all kinds It implements a multi-timeframe
Trade with Trend + s
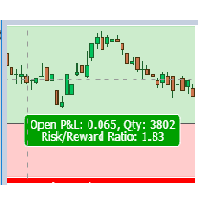
Risk Reward Panel This is a useful tool to plan a trade risk to reward visually. The indicator is very simple to use with minimum settings. Long or Short You can use the indicator for both long and short positions.
Lot Size Calculator You can also use this indicator as a lot size calculator. If you set the risk amount the indicator will calculate the lot size for you based on the stop loss line. You do not need to calculate the lot size manually.
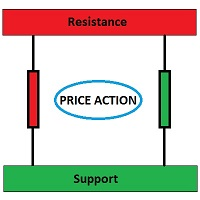
This is a price action support resistance level indicator for MT4, simply working in all time frames and all chart types. It creates Major support/resistance in specified time frame. You can also add a support/resistance level manually. For doing this, first add a horizontal line to the chart and rename it to 'Line'.
Input variables: timeFrame: You can select one of these values (M1, M5, M15, M30, H1, H4, D1, W1 and MN) or leave it empty to use Current Timeframe. majorLineColor: To specify c

Unique trend trading algorithm with advanced filtering and many features which should become a part of your trading arsenal. This indicator can give you also trading advisors (with take profit target), success rate scanner and much more. TrendMagiX PRO comes with built-in multi-pair and multi-timeframe scanner which is fully adjustable. User can select own symbols and time-frames to monitor. + ALL the features of standard TrendMagiX indicator
Important information For additional detailed infor
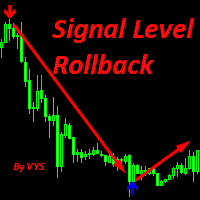
Signal Level Rollback the tool is designed to determine the lows and highs to determine the pivot of the market recommended for use with resistance support levels buy signal blue arrow sell signal red arrow It is recommended to use on a timeframe from M15 and higher since there are large movements and less market noise Stoploss is set for the nearest minimum or maximum or at a distance of 10-30 points.....
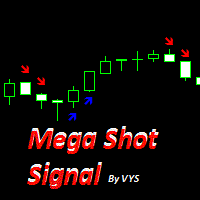
This tool is designed for binary options. The accuracy of this tool is more to 75%. Opening transactions is worth 1 candle. To increase profitability, you can use 4-knee martingale management. it is worth opening a buy deal when a signal appears in the form of a blue arrow it is worth opening a buy deal when a red arrow appears It is recommended to trade on timeframes from m1 to m15 highest accuracy on time frames m1 and m5

Pulse Scalping Line - an indicator for identifying potential pivot points. Based on this indicator, you can build an effective Martingale system. According to our statistics, the indicator gives a maximum of 4 erroneous pivot points in a series. On average, these are 2 pivot points. That is, the indicator shows a reversal, it is erroneous. This means that the second signal of the indicator will be highly accurate. Based on this information, you can build a trading system based on the Martingale

Very Fast Arrows (VFA) is a comprehensive indicator with visualization in arrows that has a little false signals at minimal delay time.
VFA is a counter-trend indicator. However its flexible algorithm is adjusted to market behavior and becomes more sensitive to rollbacks in the case of trend.
The algorithm of the indicator is based on wave analisys and can be optimized to any currency pair and time frame at minimal number of inputs. The possibility to optimize the indicator by pressing the but

Contact us for any custom order, CodeYourTrade.com .
Trend Direction indicator finds the direction of the trend using 2 indicators ADX and Parabolic SAR. Change the color of the Sell and Buy strength from the Colors tab in indicator settings. After you attached the indicator to a chart it will show the following information on the chart: 1. Parabolic SAR: Input values of Parabolic SAR Indicator 2. ADX: Input values of ADX Indicator 3. Trend Strength: Direction of the trend

Contact us for any custom order, CodeYourTrade.com .
Trade Notifier indicator is used to notify opening or closing of the trades via email or alert. It can also send regular trade updates via email. After you attached the Indicator to a chart, it will show the following information on the chart: 1. Alert information 2. Email information 3. Details to include in email body You can hide all the information displayed in the chart by setting false to Display . Indicator Settings A

Contact us for any custom order, CodeYourTrade.com .
With the Technical Indicator Multi-Timeframe, you can easily identify the oversold/overbought levels or buy/sell levels points on several different timeframes by using only one chart. You can confirm Short Term trades by higher timeframe Levels. It supports 4 technical indicators as of now Stochastic, RSI, Parabolic SAR & Heiken Ashi. After you attached the indicator to a chart it will show the following information on the chart: Timeframe

With the Technical Analysis indicator, you can find the trading signals using the combination of different technical indicators. It supports the following technical indicators: 1. RSI 2. Stochastic 3. Stochastic RSI 4. MACD 5. ADX 6. CCI 7. ATR 8. Ultimate Oscillator 9. ROC 10. Bull/Bear Power After you attached the indicator to a chart it will show the following information on the chart: 1. Technical indicators, their values and the signal generated fro

Spread & Swap Indicator is used to check the spread and swap for the current pair. You can hide all the information displayed in the chart by setting false to Show On Chart . Indicator Settings: Main Setting Display Spread : Shows the spread of the current pair. Display Swap (per lot) : Show the swap charges per lot for the current pair. Display Setting Display : Shows the indicator information on chart Location : Location of the display window Top-Left : Display all the details in top-left p

Contact us for any custom order, CodeYourTrade.com .
The Stochastic RSI indicator is essentially an indicator of an indicator. It is used in technical analysis to provide a stochastic calculation to the RSI indicator. This means that it is a measure of RSI relative to its own high/low range over a user-defined period of time. This indicator is primarily used for identifying overbought and oversold conditions. You can hide all the information displayed in the chart by setting false to Sho

Contact us for any custom order, CodeYourTrade.com .
This indicator is used to calculate the pivot points using 5 different methods: Classic Fibonacci Camarilla Woodie DeMark After you attached the indicator to a chart it will show the following information on the chart: Pivot points levels of the current chart using different methods. Indicator Setting Pivot Point Calculator Show Pivot Point Calculator: Show all pivot points on chart Pivot Points Timeframe: It tells which time is used to ca

Contact us for any custom order, CodeYourTrade.com .
Multiple Moving Average (MA) indicator is used to find the direction of the trend using multiple Moving Average indicators. It calculates using the following rules: · Ask < MA, it is SELL · Bid > MA, it is BUY · Ask > MA > Bid, it is None (no signal) After you attached the indicator to a chart it will show the following information on the chart: Multiple MAs arranged by their method Buy and Sell count Summary: Co

Contact us for any custom order, CodeYourTrade.com .
Keltner Channels are volatility-based envelopes. Moving average dictates direction and the ATR sets the channel width. It’s a trend following indicator used to identify reversals. Channels can also be used to identify overbought and oversold levels when the trend is flat. Trading Strategy We have created 2 zones SELL ZONE and BUY ZONE using the Keltner channels. In SELL ZONE (upper) we take only sell orders and in BUY ZONE (lower) we take

This expert tries to benefit from mean returning behavior. The full strategy can be found at link (Portuguese post). Real profitable strategy being used by a lot of people manually, now automatized!
Parameters: p1 : Distance from EMA13 to EMA200 according to the strategy UseMoneySteps : Enable/disable money management for step mode MoneyStep : Amount of money to increase one minimal lot UseMoneyPercentage : Enable/disable money management based on percentage and stoploss MoneyPercentage : Perc

This indicator provides the technical overview using following tools: Pivot Points Technical Indicators Moving Averages Pivot Points are calculated using five different methods: Classic Fibonacci Camarilla Woodie DeMark With the technical indicator , you can find the trading signals using the combination of different indicators. It supports the following technical indicators: RSI Stochastic Stochastic RSI MACD ADX CCI ATR Ultimate Oscillator ROC Bull/Bear Power Moving Averages is used to find th

Contact us for any custom order, CodeYourTrade.com .
Currency Sessions Highlight indicator is used to highlight the sessions. The maximum number of sessions visible at a time is 3. A user has to input the input the start and end time of the session in the format HH:MM. You can hide all the information displayed in the chart by setting false to Show On Chart . Indicator Settings: Main Setting Show Session 1 : Draw Session 1 on chart or not Session 1 Start : Start time of the session 1 Sess

Continuous Bars indicator is used to track the continuous bars closed in one direction. For example : Continuous Bars = 3 (we are looking for 3 continuous bars) Now, if (Open > Close) or (Close > Open) for 3 continuous bars it is notified via email or alert. You can hide all the information displayed in the chart by setting false to Show On Chart . Indicator Settings: Main Setting Bars : Number of continuous bars we are looking Price Setting Use M1 Timeframe: Look for continuous bars in M1 ti

Contact us for any custom order, CodeYourTrade.com .
Candle Close Time indicator is used to track the time remaining or passed on a current candle at any point of time. To get notified set the time in format DD:HH:MM:SS. For example : EnableNotify = true & (Day Left : Hour Left : Minute Left : Second Left) = 00:02:20:20. Let’s say remaining time to close candle is 00:03:23:21 (DD:HH:MM:SS). Now, when the time remaining reaches below 00:02:20:20, it shows an Alert box. You can hide all the in

Contact us for any custom order, CodeYourTrade.com . Channel Breakout indicator shows the channels based on the number of bars. It is used to trades the breakouts or reversals. Breakout is quite efficient, since it tries making profit when the market crashes!! You can also invent your own technique out of it. After you attach the indicator to a chart it will show the following information on the chart: 1. Channel 1 and channel 2 information 2. Alert and email information You can hid

the indicator was developed for the forex market, it was taken into account the moments when there is a flat (lateral movement) on the market and it was read that there is devergency and this is an olin from strong phenomena, in the end it turned out to make this tool blue line is a buy signal gray line is a sideways movement red line is a sell signal when you see a signal, open a trade; if a signal about sideways movement appears after the signal line, then you should close the trade since in m

Общие сведения Для начала торговли достаточно небольшого депозита. Идеален для быстрого разгона депозита!!! Подходит для мультивалютной торговли. Невосприимчивость к большой задержке и величине спреда.
Принцип работы После запуска советника на графике советник запоминает уровень открытия первого ордера. Выше уровня открытия первого ордера советник выставляет сеть ордеров на Sell . Ниже уровня открытия первого ордера советник выставляет сеть ордеров на Buy . Если общая прибыль ордеров на поку

Gives the average times of the High of The Day and Low of The Day + the ADR over 2 different look back periods. Every day there is a High of the Day and a Low of the Day, and the distance between them is the ADR (Average Daily Range). If you are trading reversals at the first High/Low of the Day for high Reward:Risk trading, it’s useful to know the Morning Reversal time. If you are trading the End of Day Reversal back into the range after the ADR has been hit at the opposing High/Low of the Day,

Vol 2 DPOC volume vol 2 DOC-dynamic horizontal volume indicator for any time periods
Main settings of the indicator: Volume Source -selecting data for volumes (tick or real) DPOCOn -enabling / disabling the indicator DPOCFrom -calculation start date DPOCTo -settlement end date The indicator allows you to manually select areas on the chart to analyze changes in the maximum volume over time.
You can do this by using vertical lines and moving them along the chart. Or by setting specific dates
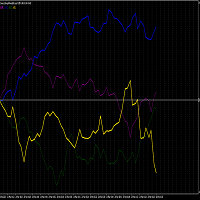
PLEASE NOTE THAT LIKE MANY SUCH INDICATORS ON THIS MARKET, THIS INDICATOR WILL NOT WORK AS A DEMO DOWNLOAD FOR STRATEGY TESTER. Therefore the 1 month option at the lowest cost allowed of $10 is available for you to test. One of the better ways to trade is to analyze individual instruments rather than in pairs. This is impossible with standard chart indicators on MT4. This volatility and strength meter allows one to trade the XAUUSD, XAUER or XAUAUD. Each instrument (not pair) is measured co

The EA is based on the zigzag indicator. The algorithm calculates each zigzag change based on the interest of buyers and sellers. This allows you to accurately determine the mood of the market. Works on all MT4 tools. Trading is carried out by a grid of orders. For the maximum result of the adviser, it is necessary to optimize these settings for each pair separately. All questions about the use and configuration write to the chat. All success and good luck.

Recovery Bad Order MT4 (System to recovery lost trader whit recovery algorithm).
This system used algorithm in the ea for initial recovery algorithm, this system close one part of loses trader, whit algorithm recovery. (the lot recovery is a factor o lot used in the entry recommended used 0,1 for lot and 0,01 for recovery lot). https://youtu.be/FlpOhpiy7Pc Recovery Bad Order MT4 is an Expert Advisor for recovering losses of positions that were opened in the wrong direction (that were open

----------OVERVIEW--------- BORASO RISK CONTROLLER is an useful tool to record the equity gains and drawdown that your account reaches, so that you can adjust the level of power of investment. It is important if you trust a trader and you subscribe to a signal confident in never overcome a certain drawdown, saving big part of your capital if the bad day arrives. Please note that signal trades can be reopened after the "safety exit" but you can decide to stop the autocopying with a better protect

Miser 4 Miser 4 is an intraday trading system that makes profit on short-term price movements. The EA is optimized for several currency pairs. Optimized parameter set files published in product news You can get acquainted with the EA operation statistics for different brokers on different instruments in the Trading Signals section for MetaTrader 5. It is possible to include martingale, which requires special care . Parameters Management of risks: enter allotted funds - (<= 0-OFF, <= 2.0 -

Description: The CCI Scalper leverages a group of Exponential Moving Averages and the Commodity Channel Index to find and trade the trend. This expert advisor works very well with EUR/USD and USD/CHF on a M15 chart.
Features: - No Dangerous trading methods such as Martingale's or Grids. - Every trade has a Stop Loss as well as the option for a Trailing Stop. - Setup is easy and not overly complex like most other Expert Advisors tend to be.
Parameters: - Take Profit - Lots - Trailing Stop -


1. Record the price data for each Tick transaction. Data file contents: "Tick time", "ASK price", "BID price", "SPREAD SPREAD", "Tick quoted quantity". 2. Meanwhile, generate a quotation data file with a 1-minute period. Content of 1min data file: "ASK time", "ASK OPEN price", "ASK HIGH price", "ASK LOW price", "ASK CLOSE price", "BID time", "BID OPEN price", "BID HIGH price", "BID LOW price", "BID CLOSE price", "Tick quoted quantity". 3. Save all quotation data in one file every day, which is c

Beat Your Broker Track your broker's real (not advertised!) spreads. A no-brainer price for an essential tool for every legit trader. Load like a normal EA to track the average spread for up to 8 symbol_time periods. So for example, track the average spread for: EURUSD on 30m chart NAS100 on 5m chart GBPUSD on 15m chart etc Each symbol_time will generate its own .csv file that is easily accessible from the data folder, for you to download and manipulate. The file has three columns - Date, Time,

I will support only my client. สำหรับลูกค้า Parameters
General Trade Settings Money Management
Lot : Fixed (can change) Strategies - H4 Strategies it is fixed with MA, Bollinger band, Candlestick Levels Close Functions - H4 Strategies MagicNumber - individual magic number. The EA will only manage position of the chart symbol with this magic number. NextOpenTradeAfterMinutes - 15 minutes is default, can change it MaxSpread - upto currency pairs, MaxSlippage - upto currency pairs, Push

This Bot lets to place price alerts from mobile terminal (android/ios) and send it by Email, Push, or Terminal Alerts. Just place any pending order from your mobile device and delete it within 10 seconds, Bot will remember the order price and create Alert: EURUSD Set ALERT at 1.1234 When the price reach target value, you will get Alert notification: EURUSD ALERT: BID>1.1234 If pending order don’t remove within 10 seconds, Bot set Stop Loss and Take Profit values: StopLoss = SL x ATR, TakeProf

BLACKBOX BEAST provides the investment market a highly sophisticated, proprietary, Black-Box trading software system and infrastructure that is fully automated, algorithmic, non-subjective input, that maximizes the application and use of AI (Artificial Intelligence), that is non-directional that makes money simultaneously regardless whether the market is going up or down, and that is revolutionary in its ability to make profits in the market in that it is a “3-dimensional” trading philosophy (m
FFXMV Dashboard Plus
This is a custom indicator created to give Traders a full view of what is going on in the market. It uses a real time data to access the market and display every bit of information needed to make successful trading. The PLUS there to produce the kind of RESULTS as you see in the SCREENSHOTS, I added a MultipleOrder Utility EA with it with instructions on how to use it with FFXMV Dashboard.
INSTALLATION : Read the MANUALS that comes with the rest of the PACKAGE after yo
Analyzer is a multiple indicator multi timeframe that allow you to know the status of RSI , Stochastic and ADX in all time frame, from 5 minute to monthly. In input you can insert your preferred setting which will be applied to the whole indicator. Trade with this indicator is very simple. You can follow the trend or find the best opportunity for reversal. A green histogram is shown when the indicator report a bullish tendency. A red histogram appears whether the indicators indicate a bearish te

McDuckEA – works on the martingale strategy. It shows good results when trading on Gold, XAUUSD. Martingale orders are opened with a step from each other and only after the opening of a new bar of the set timeframe. During the release of important news, the EA suspends the opening of new orders. The EA has an internal risk control system and, if the risk is exceeded, it starts to exit the market, closing extreme positions in pairs. The level of loading of the deposit determines the risk and prof
MetaTraderマーケットはトレーダーのための自動売買ロボットやテクニカル指標を備えており、 ターミナルから直接利用することができます。
MQL5.community支払いシステムはMetaTraderサービス上のトランザクションのためにMQL5.comサイトに登録したすべてのユーザーに利用可能です。WebMoney、PayPal または銀行カードを使っての入金や出金が可能です。
取引の機会を逃しています。
- 無料取引アプリ
- 8千を超えるシグナルをコピー
- 金融ニュースで金融マーケットを探索
新規登録
ログイン