YouTubeにあるマーケットチュートリアルビデオをご覧ください
ロボットや指標を購入する
仮想ホスティングで
EAを実行
EAを実行
ロボットや指標を購入前にテストする
マーケットで収入を得る
販売のためにプロダクトをプレゼンテーションする方法
MetaTrader 4のための新しいテクニカル指標 - 2
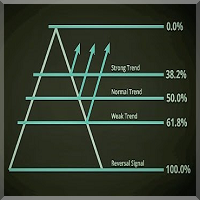
序章 フィボナッチレベルプロフェッショナルインディケータは、他のインディケータを補完するものとして毎日の取引に最適なツールであり、取引設定や市場が移動する傾向がある場所をよりよく確認できます。このインジケーターはセットアップが簡単で、すべての通貨ペアと時間枠で機能します。M15-W1をお勧めします。
この指標の目的は、チャート、日次、上線、下線にフィボナッチレベルを表示することです。追加機能として、このインジケーターはチャートにリトレースラインとエクスパンションラインを描画し、高値、安値、レンジ、スプレッドの日数を示します。フィボナッチレベルプロインジケーターは、前日の高値と安値を使用して、計算された線を描画します。これはすべてのトレーダーにとってなくてはならないツールです! 特徴 セットアップが簡単で、複雑な設定はありません きれいで滑らかなチャートラインと読みやすい すべての通貨ペアと時間枠で機能します フィボナッチラインの調整可能な色設定 調整可能なダッシュボードの色 アカウント情報を含むダッシュボード インジケーターパラメーター UpperFiboColor-上部フィボナ
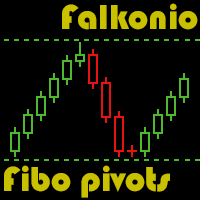
The indicator presents reversal points by Fibo levels based on the previous day prices. The points are used as strong support/resistance levels in intraday trading, as well as target take profit levels. The applied levels are 100%, 61.8%, 50%, 38.2%, 23.6%. The settings allow you to specify the amount of past days for display, as well as line colors and types. Good luck!
This indicator will draw Support and Resistance lines calculated on the nBars distance. The Fibonacci lines will appear between those 2 lines and 3 levels above or under 100%. You may change the value of each level and hide one line inside 0-100% range and all levels above or under 100%.
Input Parameters: nBars = 24; - amount of bars where the calculation of Support and Resistance will be done. Fibo = true; if false then only Support and Resistance will be shown. Level_1 = true; - display of t

This indicator is another variant of the famous powerful indicator Fibonacci-SS https://www.mql5.com/en/market/product/10136 but has different behaviour in placing Pending Order and TP Line. Automatically places Fibonacci retracement lines from the last highest and lowest visible bars on the chart with: An auto Pending Order (Buy/Sell). Taking Profit 1, Taking Profit 2 is pivot point and Taking Profit 3 for extended reward opportunity. The best risk and reward ratio.
Simple and powerful indica
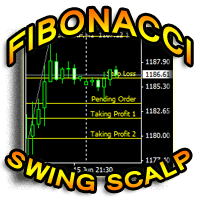
Fibonacci Swing Scalp (Fibonacci-SS) This indicator automatically places Fibonacci retracement lines from the last highest and lowest visible bars on the chart with an auto Pending Order (Buy/Sell), Stop Loss, Taking Profit 1, Taking Profit 2 and the best risk and reward ratio. This is a very simple and powerful indicator. This indicator's ratios are math proportions established in many destinations and structures in nature, along with many human produced creations. Finding out this particular a

This indicator draws Fibonacci level automatically from higher high to lower low or from lower low to higher high. With adjustable Fibonacci range and has an alert function.
How to use Fibonacci Risk Reward Ration (R3) into trading strategy Forex traders use Fibonacci-R3 to pinpoint where to place orders for market entry, for taking profits and for stop-loss orders. Fibonacci levels are commonly used in forex trading to identify and trade off of support and resistance levels. Fibonacci retrace

The indicator for automatic drawing of Fibonacci-based Moving Averages on the chart. It supports up to eight lines at a time. The user can configure the period of each line. The indicator also provides options to configure color and style of every line. In addition, it is possible to show indicator only on specific time frames. Please contact the author for providing additional levels or if you have any other suggestions.

Simply drop the indicator to the chart and Fibonacci levels will be shown automatically! The indicator is developed for automatic drawing of Fibonacci levels on the chart. It provides the abilities to: Select the standard Fibo levels to be shown Add custom levels Draw the indicator on the timeframes other than the current one. For example, the indicator is calculated on the weekly period (W1) and is displayed on the monthly period (MN1) Select the timeframes the indicator will be available on Ca

Fibonacci Arcs in the full circles are based on the previous day's candle (High - Low).
These arcs intersect the base line at the 23.6%, 38.2%, 50%, 61.8%, and 78.6%. Fibonacci arcs represent areas of potential support and resistance.
Reference point - the closing price of the previous day.
These circles will stay still all day long until the beginning of the new trading day when the indicator will automatically build a new set of the Fibonacci Arcs.

フィボナッチ・レベルは、サポートとレジスタンス・レベルを識別してトレードオフするために金融市場取引で一般的に使用されています。
大幅な価格変動の後で、新しいサポートとレジスタンスレベルは、多くの場合、これらのトレンドラインまたはその近くにあります
フィボナッチラインは、前日の高値/安値を基に構築されています。
参照ポイント-前日の終値。 フィボナッチ・レベルは、サポートとレジスタンス・レベルを識別してトレードオフするために金融市場取引で一般的に使用されています。
大幅な価格変動の後で、新しいサポートとレジスタンスレベルは、多くの場合、これらのトレンドラインまたはその近くにあります
フィボナッチラインは、前日の高値/安値を基に構築されています。
参照ポイント-前日の終値。
価格の下落が止まり、方向を変え、上昇し始めると、サポートが発生します。 多くの場合、サポートは価格をサポートまたは維持する「フロア」と見なされます。
レジスタンスは、上昇する価格が止まり、方向を変え、下落し始める価格レベルです。 レジスタンスは、価格が上昇するのを防ぐ「上限」と見なされることがよくあります。 外国為替トレーダーは、フィボナッチリトレースメントを使用して、市場参入のための注文の場所を特定し、利益とストップロス注文を受け取ります。 フィボナッチレベルは、サポートとレジスタンスレベルを特定してトレードオフするために外国為替取引で一般的に使用されます。 トレーダーは、38.2パーセント、50パーセント、61.8パーセントの主要なフィボナッチリトレースメントレベルを、それらの価格レベルでチャート全体に水平線を引くことでプロットし、最初の大きな価格変動によって形成された全体的なトレンドを再開する前に市場がリトレースする領域を特定します。
このインジケーターは、nBars距離で計算されたサポートラインとレジスタンスラインを描画します。
入力パラメーターFibo = tr

Fibonacci Ratio is useful to measure the target of a wave's move within an Elliott Wave structure. Different waves in an Elliott Wave structure relates to one another with Fibonacci Ratio. For example, in impulse wave: • Wave 2 is typically 50%, 61.8%, 76.4%, or 85.4% of wave 1. Fibonacci Waves could be used by traders to determine areas where they will wish to take profits in the next leg of an Up or Down trend.

Fibonacci SR Indicator
This indicator creates support and resistance lines. This indicator is based on Fibonacci Retracement and Extension levels. It will consider many combinations of the Fibonacci levels and draw support/resistance lines based on these. This indicator uses tops and bottoms drawn by the ZigZag indicator in its calculations. The ZigZag can also be drawn on the chart, if necessary. The indicator considers many combinations of past reversal points and Fibonacci ratio levels, and
FREE

Fibonacci sequence is defined by integer sequence: 0, 1, 1, 2, 3, 5, 8, 13, 21, 34, 55, 89, 144, ... By definition, it starts from 0 and 1, the next number is calculated as a sum of two previous numbers. Instead of the standard moving average, the indicator uses the following calculation of average price: Bar0 + Bar1 + Bar2 + Bar3 + Bar5 + Bar8 + Bar13 + Bar21 + ...
Input parameters FiboNumPeriod_1 - numbers in the following integer sequence for Fibo Moving Average 1. nAppliedPrice_1 - Close p

This indicator is based on the same idea as https://www.mql5.com/en/market/product/2406 , but instead of Average Bars it uses series or Fibonacci sequence. When the previous Price Close is above the previous indicator Bar, the probability to go Long is very high. When the previous Price Close is under the previous indicator Bar, the probability to go Short is very high.
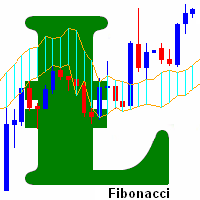
This indicator is based on the Fibonacci sequence. The input parameters fiboNum is responsible for the number in the integer sequence. The input parameter counted_bars determines on how many bars the indicator's lines will be visible. When the previous Price Close is above the previous indicator Bar, the probability to go Long is very high. When the previous Price Close is under the previous indicator Bar, the probability to go Short is very high.

Fibonacci sequence is defined by integer sequence: 0, 1, 1, 2, 3, 5, 8, 13, 34, 55, 89, 144, ... By definition, it starts from 0 and 1, the next number is calculated as a sum of two previous numbers. Instead of the standard moving average, the indicator uses the caluclation of average price in form:
Bar0 + Bar1 + Bar2 + Bar3 + Bar5 + Bar8 + Bar13 +... Input parameters: FiboNumPeriod (15) - Fibonacci period; nAppliedPrice (0) - applied price (PRICE_CLOSE=0; PRICE_OPEN=1; PRICE_HIGH=2; PRICE_LOW
MetaTraderマーケットはMetaTraderプラットフォームのためのアプリを購入するための便利で安全な場所を提供します。エキスパートアドバイザーとインディケータをストラテジーテスターの中でテストするためにターミナルから無料のデモバージョンをダウンロードしてください。
パフォーマンスをモニターするためにいろいろなモードでアプリをテストし、MQL5.community支払いシステムを使ってお望みのプロダクトの支払いをしてください。
取引の機会を逃しています。
- 無料取引アプリ
- 8千を超えるシグナルをコピー
- 金融ニュースで金融マーケットを探索
新規登録
ログイン