Hi Can I have an indicator with following requirements:
A. Plot Monthly, Weekly and Daily Pivot Points in any chart
/ time frame I am in.
1. Color & size
of each line should be adjustable (Default- Monthly: Red, Weekly: Orange,
Daily: Yellow)
2. Each lines can
be set to visible or invisible
3. All lines can be either diplayed only at the right side of chart or draw across the chart
B. Plot a line for any price which is a whole number in any
chart / time frame I am in.
1. Color & size
of line should be adjustable (Default: White)
2. Line can be set
to visible or invisible
3. All lines can be either diplayed only at the right side of chart or draw across the chart
C. Plot a line for 200 Period EMA calculated using Daily
timeframe in any chart / time frame I am in.
1. Color & size
of line should be adjustable (Default: Red)
2. Line can be set
to visible or invisible
3. All lines can be either diplayed only at the right side of chart or draw across the chart
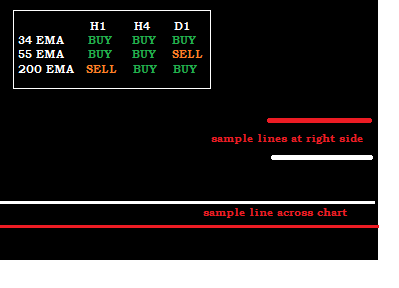
D. Price trend signals from Daily, H4 and H1 timeframes.
Check if price is
below or above following EMA's on Daily, H4 and H1 timeframes and display
warning accordingly on chart corner with font adjustable
(attached sample
image on how it should display)
34 Period EMA / Close
55 Period EMA / Close
200 Period EMA /
Close
E. Price alert (mobile/email) on following conditions. (Soch
& RSI inputs should adjustable).
(Display of Stoch
and RSI on chart can be set to visible or invisible).
1. Uptrend End Alert for H1:
Condition:
H1 trend is UP, Stochastic is oversold
AND RSI is oversold (Both should be true. If RSI enters first wait for Stoch and
vice versa)
2. Downtrend End Alert
for H1:
Condition: H1 trend is DOWN, Stochastic is overbought AND RSI is
overbought (Both should be true. If RSI enters first wait for Stoch and vice
versa)
3. Uptrend End Alert for H4:
Condition:
H4 trend is UP, Stochastic is oversold
AND RSI is oversold (Both should be true. If RSI enters first wait for Stoch and
vice versa)
4. Downtrend End Alert
for H4:
Condition: H4 trend is DOWN, Stochastic is overbought AND RSI is
overbought (Both should be true. If RSI enters first wait for Stoch and vice
versa)
5. Uptrend End Alert for D1:
Condition:
D1 trend is UP, Stochastic is oversold
AND RSI is oversold (Both should be true. If RSI enters first wait for Stoch and
vice versa)
6. Downtrend End Alert
for D1:
Condition: D1 trend is DOWN, Stochastic is overbought AND RSI is
overbought (Both should be true. If RSI enters first wait for Stoch and vice
versa)
7. Master alert
when all timeframes - H1, H4, D1 - are in the same trend direction and Stochastic
AND RSI is overbought in ALL TIMEFRAMES or oversold in ALL TIMEFRAMES
Attached sample images.
類似した注文
Hello, I’m looking for an experienced MQL5 developer to help integrate cloud-based parameter control for an existing MT5 EA. The goal is to allow EA parameters to be adjusted via a secure web interface. Please reach out via private message for more details and to discuss further
Hi Developer, I would like to create the indicator based for Mt4 on the investing.com data https://www.investing.com/currencies/eur-usd-technical. Indicator must show and read all the timeframe in order to get the real time result. Indicator also have selection to select each time frame. Indicator must work at 5 major currencies and gold as well. it will show at MT4 as below Buy = green Sell = red neutral = grey
I need to make EA (Expert Advisor) and would appreciate it if you could provide your most competitive quote. Please let me know your best price for completing these changes, as I’m looking to get this done promptly and effectively. Thank you
I need a programmer for converting a MetaTrader indicator into ea for TradeLocker. Additionally, I would like to have a new EA built in TradeLocker that mirrors the logic of the original MetaTrader, including the specific rules and conditions I need. Please contact me only if you have prior experience converting scripts from MetaTrader to TradeLocker
I HAVE A SQ EA AND IT NEEDS TO RUN WITH 3 SETS WITH DIFFERENT TIME CONFIGURATION. Basically the trade logic will read different input values for the same parameter with the same and/or different timeframes and manage trades accordingly and individually. If it is a trouble, timeframe can be ignored and we can continue only with the parametrization
I need to make several modifications to an EA (Expert Advisor) and would appreciate it if you could provide your most competitive quote for these edits. Please let me know your best price for completing these changes, as I’m looking to get this done promptly and effectively. Thank you
hello here am looking for someone that can assist me in removing validation form my demo file and if anyone is interested dm the for more details i will be waiting to get any reply by some on that can assist me with this
I want a combined Standard deviation channel and Fibonacci channel indicators into just one indicator. The standard deviation channel lines would have same characteristics as the Fibonacci lines in terms of format (adjustable width, colors, type, size etc.). I want unique buffer values for all the lines (for both the 3 upper and 3 lower STD.DEV lines and the same for the Fibonacci channel lines) which would be
A green point should be added at the Low point of candlesticks in the oversold zone—it is the L point. If there is at least one L point between two H points, search for a LL point in the interval between two H points. The candlestick with the lowest Low price will be the LL point. Generally, the LL point is not necessarily an L point. Search for candlesticks with the lowest Low price. If there is at least one H point
Trading robots are programs, which operate according to underlying algorithms. An algorithm is a set of actions that need to be performed in response to certain events. For example, the most common task in algo trading is the identification of the "New bar" event. When the event occurs, the robot checks the emergence of trading signals and acts accordingly. Before you decide to program or order a trading robot, you