Hi Can I have an indicator with following requirements:
A. Plot Monthly, Weekly and Daily Pivot Points in any chart
/ time frame I am in.
1. Color & size
of each line should be adjustable (Default- Monthly: Red, Weekly: Orange,
Daily: Yellow)
2. Each lines can
be set to visible or invisible
3. All lines can be either diplayed only at the right side of chart or draw across the chart
B. Plot a line for any price which is a whole number in any
chart / time frame I am in.
1. Color & size
of line should be adjustable (Default: White)
2. Line can be set
to visible or invisible
3. All lines can be either diplayed only at the right side of chart or draw across the chart
C. Plot a line for 200 Period EMA calculated using Daily
timeframe in any chart / time frame I am in.
1. Color & size
of line should be adjustable (Default: Red)
2. Line can be set
to visible or invisible
3. All lines can be either diplayed only at the right side of chart or draw across the chart
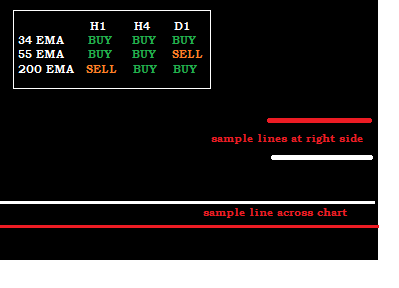
D. Price trend signals from Daily, H4 and H1 timeframes.
Check if price is
below or above following EMA's on Daily, H4 and H1 timeframes and display
warning accordingly on chart corner with font adjustable
(attached sample
image on how it should display)
34 Period EMA / Close
55 Period EMA / Close
200 Period EMA /
Close
E. Price alert (mobile/email) on following conditions. (Soch
& RSI inputs should adjustable).
(Display of Stoch
and RSI on chart can be set to visible or invisible).
1. Uptrend End Alert for H1:
Condition:
H1 trend is UP, Stochastic is oversold
AND RSI is oversold (Both should be true. If RSI enters first wait for Stoch and
vice versa)
2. Downtrend End Alert
for H1:
Condition: H1 trend is DOWN, Stochastic is overbought AND RSI is
overbought (Both should be true. If RSI enters first wait for Stoch and vice
versa)
3. Uptrend End Alert for H4:
Condition:
H4 trend is UP, Stochastic is oversold
AND RSI is oversold (Both should be true. If RSI enters first wait for Stoch and
vice versa)
4. Downtrend End Alert
for H4:
Condition: H4 trend is DOWN, Stochastic is overbought AND RSI is
overbought (Both should be true. If RSI enters first wait for Stoch and vice
versa)
5. Uptrend End Alert for D1:
Condition:
D1 trend is UP, Stochastic is oversold
AND RSI is oversold (Both should be true. If RSI enters first wait for Stoch and
vice versa)
6. Downtrend End Alert
for D1:
Condition: D1 trend is DOWN, Stochastic is overbought AND RSI is
overbought (Both should be true. If RSI enters first wait for Stoch and vice
versa)
7. Master alert
when all timeframes - H1, H4, D1 - are in the same trend direction and Stochastic
AND RSI is overbought in ALL TIMEFRAMES or oversold in ALL TIMEFRAMES
Attached sample images.
Похожие заказы
good day i have an indicator but need the source for this reason The indicator only work on a single Time frame open trade, and close with only a single TF i will like the indicator work on multiple time frame just like other installed indicator My coder said the reason it cannot work like other indicator installed is because it has no buffer First confirm if you have the source code because its a popular indicator
Hello! I am looking for an experienced Pine Script coder to create a custom indicator for mapping market structure based on fractals. The developer must be skilled in Pine Script and have a solid understanding of how to code market structure indicators. Looking forward to working with a talented developer
Hello developers, I would like to hire someone can convert the Radar Signal indicator: https://www.youtube.com/watch?v=5DmKcy7rb-U  ; to it's TradingView equivalent. Radar signal indicator is the combination of 7 classic MT4 indicators. They include ADX, RSI , CCI , OsMA, ATR, WPR. The indicator shows the values of these indicators in blue and red. Red color indicates a bearish market condition and the blue shows
Hi , i want a indicator that shows the trades history on the chart, just for current day, like : first trade : -54 Second trade : -52 Third trade : +126 , and after three trades, display "No more trades"
Hello i need someone who can convert a trading view indicator into an mt5 indicator that can work smoothly also need to add an alert on the indicator i will require to test the indicator run it for 1-2days to confirm all is okay thank you
Here's a clearer step-by-step guide to checking the last 50 candles on your chart and applying Fibonacci retracement levels based on their colors: Identify Candle Color: Start from the 100th candle from the left on the chart and check its color. If the 100th candle is green (i.e., the close is higher than the open): Draw a Fibonacci Retracement: From the highest price to the lowest price of this candle. Check the
Here's a clearer step-by-step guide to checking the last 50 candles on your chart and applying Fibonacci retracement levels based on their colors: Identify Candle Color: Start from the 100th candle from the left on the chart and check its color. If the 100th candle is green (i.e., the close is higher than the open): Draw a Fibonacci Retracement: From the highest price to the lowest price of this candle. Check the
I have an equity reporter. This equity reporter displays the maximum and minimum equity reached over a specific interval. So, if the interval is set to 24 hours, the script will generate data in the format: "Profit ATT" (profit AtThatTime) shows max./min. during the specific interval This specific report shows data in pips. It can also be set to display in price or percentages. The interval is also easily adjustable
I want you to make me an indicator in Training View. Its idea is very simple, and I want it to have an alarm. Here's a clearer step-by-step guide to checking the last 50 candles on your chart and applying Fibonacci retracement levels based on their colors: Identify Candle Color: Start from the 100th candle from the left on the chart and check its color. If the 100th candle is green (i.e., the close is higher than the
Hello, is it possible to be made accommodation of provided signal for Forex for mt4? I bought a signal for multiple pairs. it is executing all pair.I want to use it on couple of pairs.Is it possible to be made some modifications?I do not have codes for the signal